Catching NGC 4051 in the low state with XMM-Newton
Abstract
The Narrow Line Seyfert 1 (NLS 1) galaxy NGC 4051 shows unusual low flux states, lasting several months, when the 2-10 keV X-ray spectrum becomes unusually hard (photon index) while the spectrum at lower X-ray energies is dominated by a large soft excess. A Chandra TOO of the low state has shown that the soft excess and hard components are variable and well-correlated. The variability of the hard component rules out an origin in a distant reflector. Here we present results from a recent XMM-Newton TOO of NGC4051 in the low state, which allows a much more detailed examination of the nature of the hard and soft spectral components in the low state. We demonstrate that the spectral shape in the low state is consistent with the extrapolation of the spectral pivoting observed at higher fluxes. The XMM-Newton data also reveals the warm absorbing gas in emission, as the drop in the primary continuum flux unmasks prominent emission lines from a range of ion species.
1 INTRODUCTION
The NLS 1 galaxy NGC 4051 is highly variable in X-rays on both long and short time-scales [1]. In particular, on long time-scales, the X-ray light curve of NGC 4051 shows unusual low-flux states lasting months, during which the source varies little (compared with the normal variability amplitude) and the 2-10 keV X-ray spectrum becomes extremely hard (photon index ) [2, 3, 4]. The first broadband X-ray spectrum of a confirmed low state, obtained in 1998 by BeppoSAX [2], suggested that the hard spectral shape (above keV) could be explained as being due to pure reflection from distant cold material (possibly the putative molecular torus). At lower energies, a different, much softer, spectral component was revealed () which, it was suggested, may be associated with extended emission from hot gas on scales of hundreds of parsecs [5]. Thus the lack of variability in the low state spectrum, and its unusual shape, were explained entirely in terms of emission and reprocessing from large-scales, while the primary continuum was itself ‘switched off’.
Subsequently however, a Chandra observation of NGC 4051 in a normal state in April 2000 [10] (and a later low state observation in February 2001 [4]) showed that there is in fact no significant soft X-ray emission on scales of hundreds of parsecs. Furthermore, although the source spectrum had the same unusual hybrid form of the 1998 low state (albeit at a higher continuum flux level), Chandra showed that the continuum in the low state is significantly variable in both hard and soft bands, and both hard and soft components are well-correlated. Thus, Chandra showed that the unusual shape of the low state spectrum was in fact intrinsic to the primary continuum emission and not due entirely to reflection and emission on larger scales. It was suggested [4] that in the low state, the unusually hard spectral shape seen above a few keV is simply due to an extrapolation of the spectral variability of NGC 4051 seen at higher fluxes [6], where the power-law continuum pivots, to become softer at higher fluxes (and consequently much harder at low fluxes). Furthermore, the Chandra 2001 low state observation showed evidence for strong reflection, consistent with the presence of a reflection component including a relativistic diskline, which is independent of continuum flux (also observed in MCG–6-30-15 [6, 7]). These results suggest that the continuum emission processes in the low state are not really distinct from those in the much briefer (hours) low-flux epochs observed during the source’s normal state, and therefore the physical structure of the source, and perhaps the mode of accretion, is fairly stable despite the large-amplitude flux variability.
In order to test our earlier interpretation of the 2001 low state data, which was somewhat limited by the relatively low throughput of Chandra, we used a 33 ksec (useful exposure) XMM-Newton TOO to observe NGC 4051 in a low state in November 2002 (the observation was triggered using our RXTE monitoring campaign [1]). In this paper, we present some of the highlights of this observation and their relevance to our earlier interpretation of the spectral shape and variability. A more detailed analysis can be found in forthcoming papers [8, 9].
2 RESULTS
2.1 The flux-flux plot: evidence for spectral pivoting
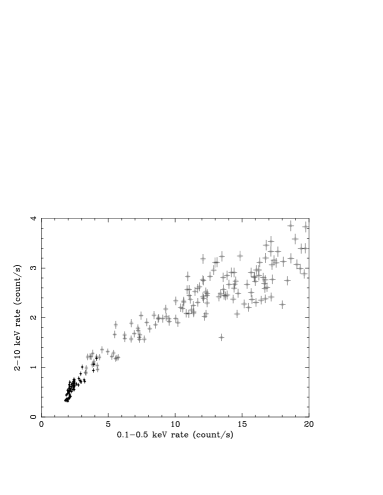
In order to examine the form of the continuum spectral variability of NGC 4051 in a model-independent way, and test whether the low state spectrum is consistent with that expected from the spectral variability seen at higher fluxes, we can produce a combined flux-flux plot [6] of EPIC-pn fluxes obtained during the low state TOO observation and an earlier (2001 May) ksec XMM-Newton observation of NGC 4051, obtained during its normal, higher flux state. The normal-state data is described in more detail in [1]. For both low and normal states, we obtained 500 s resolution light curves in the 0.1-0.5 keV soft and 2-10 keV hard bands. We first examine the unbinned flux-flux relation in Figure 1. We note two main points. First, the overall distribution of points clearly does not follow a linear relationship. Second, the distribution of low state data seems to join smoothly on to the distribution of normal state data: the normal state distribution bends towards low fluxes and this bending continues in the low state data. Hence we conclude that the same process which causes the spectral variability in the normal state continues to lower fluxes in the low state. There is significant intrinsic scatter in the relation (which was also observed in the RXTE flux-flux relations [6]), which implies that there is also spectral variability which is not correlated with flux variations. Note that this scatter increases towards higher fluxes, which suggests that it is caused by some additional spectral variability in the pivoting component, rather than independent variations in a separate component.
To remove the scatter and so find the functional form of the flux-flux relation, we binned the data into 15 flux bins (minimum of 10 data points per bin), which are logarithmically spaced in order to maximise the usefulness of the low state data to constrain the flux-flux relation (error bars are standard errors determined using the spread of data points in each bin). We use a general power-law plus constants model [6] to describe the relationship of hard and soft fluxes, and obtain a good fit to the data ( for 11 d.o.f.) for a power-law index with constant offsets on the hard and soft axes of and respectively. The binned flux-flux plot and best-fitting power-law plus constants model are plotted in Figure 2. Using xspec simulations we find that the 90% confidence range of power-law indices fitted to the binned flux-flux plot corresponds to a pivoting model with a pivot energy between 75-300 keV. The positive offset on the soft axis of the present flux-flux plot implies a significant constant soft component which counteracts the effect of the hard constant component detected at higher energies [6] to produce an offset on the soft axis.
Since the spectral shape at low energies ( keV) is best described by thermal emission [4, 10] rather than a power-law, then in order to produce a flux-flux relation consistent with the pivoting observed by RXTE [6], the pivoting power-law is probably attached to the thermal component and pivoting may be driven by the variations in the thermal component. An obvious physical realisation of this picture is that the thermal component (perhaps disk emission) is the source of seed photons which are Comptonised to produce the power-law observed at higher energies.

2.2 Evidence for reflection
In Figure 3 we plot the ratio of the 3-12 keV spectrum to a simple power-law model, which is fitted only over the 3-4 keV and 9-12 keV ranges (i.e. excluding the region where significant emission features may be expected). Clear broad residuals can be seen, in addition to a narrow iron emission line observed at keV. Consequently, a power-law plus narrow, unresolved Gaussian fitted to the data is a very poor fit (reduced chi-squared, for 120 d.o.f.). We find that including a pexrav reflection component (with parameters fixed to those used to describe the May 1998 low state spectrum [3]) improves the fit substantially (), and an edge at keV (optical depth ) is also formally required (resulting for 117 d.o.f). The observed edge energy corresponds to the K-shell photoionisation edge expected from Fexvii, a species which is seen in emission at lower energies (see next section). Removing the edge and including a Laor diskline, worsens the fit ( for one less degree of freedom). Adding the 7.9 keV edge in addition to the diskline does not improve on the reflection+edge fit significantly ( for three fewer degrees of freedom). Worse fits are obtained in each case by including a diskline from a non-rotating black hole. Therefore we conclude that a diskline is not formally required to fit the low state spectrum. However, the reflection required is factor larger than than that used to explain the entire May 1998 hard continuum flux, while the narrow 6.4 keV line flux is not larger than observed in May 1998. Therefore we suggest that strong disk reflection is in fact present in the low state spectrum, but the diskline may not be detectable, perhaps due to extreme relativistic smearing in the unstable inner disk.

2.3 RGS spectrum
Finally, we show in Figure 4 the RGS spectrum obtained during the 2002 low state observation. The drop in the continuum from normal flux levels reveals a host of emission lines, associated with the ionised ‘warm absorber’ gas, which has not had time to respond to the drop into the low state. The spectrum demonstrates how TOOs of AGN at unusually low fluxes can clearly reveal their X-ray emission lines, which may not be apparent in higher-flux observations where the lines are more likely to be seen in absorption. Besides providing additional diagnostics in their own right [9], the emission lines can be used to increase the information gained from grating spectra obtained at higher fluxes, e.g. determining the true optical depths of absorption lines which are partly filled in by emission lines.

References
- [1] I. M. McHardy, I. E. Papadakis, P. Uttley, M. J. Page and K. O. Mason, submitted to MNRAS (2003), also see these proceedings.
- [2] M. Guainazzi, et al., MNRAS 301 (1998) L1.
- [3] P. Uttley, I. M. McHardy, I. E. Papadakis, M. Guainazzi and A. Fruscione, MNRAS 307 (1999) L6
- [4] P. Uttley, A. Fruscione I. M. McHardy and G. Lamer, ApJ in press (2003).
- [5] K. P. Singh, MNRAS 309 (1999) 991.
- [6] R. D. Taylor, P. Uttley and I. M. McHardy, MNRAS 342 (1999) L31.
- [7] A. C. Fabian and S. Vaughan, MNRAS 340 (2003) L28.
- [8] P. Uttley, et al., submitted to MNRAS (2003).
- [9] M. J. Page, et al., in preparation (2003).
- [10] M. J. Collinge, et al., ApJ 557 (2001) 2.