Absolute timing with IBIS, SPI and JEM-X aboard INTEGRAL††thanks: Based on observations with INTEGRAL, an ESA project with instruments and science data centre funded by ESA member states (especially the PI countries: Denmark, France, Germany, Italy, Switzerland, Spain), Czech Republic and Poland, and with the participation of Russia and the USA.
We have verified the absolute timing capabilities of the high-energy instruments aboard INTEGRAL, i.e. the imager IBIS, the spectrometer SPI and the X-ray monitor JEM-X. Calibration observations of the Crab, contemporaneous with the Rossi X-ray Timing Explorer (RXTE), have been used to measure the absolute phase of the main pulse of the Crab pulse profile using the same Jodrell Bank radio ephemeris. The three INTEGRAL instruments and RXTE give within the statistical and systematic uncertainties consistent results: The X-ray main pulse is leading the radio pulse by . Also the shapes of the X-ray pulse profiles as measured by the different instruments are fully consistent with each other. In addition, we present the first measurement of the absolute phase of the main pulse at -ray energies above 30 MeV using data from the EGRET instrument aboard the Compton Gamma-Ray Observatory: The -ray main pulse is leading the radio one by , consistent with the value for the X-ray main pulse. Comparing absolute arrival times at multiple frequencies gives important constraints to models explaining the production of non-thermal emission in magnetospheres of rotation powered neutron stars.
Key Words.:
Stars: neutron – pulsars: individual: PSR B0531+21 – X-rays: stars – gamma rays: stars1 Introduction
The high-energy instruments aboard INTEGRAL (Winkler et al. winkler (2003)) are designed to allow timing studies of e.g. radio pulsars with periods down to the very short periods of millisecond pulsars. This requires very precise and stable timing information, particularly for studies at the high-energy end of the INTEGRAL window where the counting rates are low and long integration times required. An important aspect in timing studies is the measurement of absolute arrival times. Particularly in multiwavelengths studies of pulsars, the comparison of absolute arrival times is an important diagnostic in the detailed modelling of the structures of the production sites in magnetospheres of rotation-powered neutron stars.
We used INTEGRAL calibration observations of the Crab pulsar (PSR B0531+21) and contemporaneous observations with the Proportional Counter Array (PCA, Jahoda jahoda (1994)) on the Rossi X-ray Timing Explorer (RXTE) to verify the correct absolute timing calibration for the imager IBIS (Ubertini et al. ubertini (2003)), the spectrometer SPI (Vedrenne et al. vedrenne (2003)) and the X-ray monitor JEM-X (Lund et al. lund (2003)). This was done by measuring the absolute phase of the main pulse of the Crab pulse profile with the INTEGRAL instruments and the PCA. All data have been analyzed with the same Jodrell Bank radio ephemeris, reducing systematic effects due to e.g. dispersion measure variations causing systematic variations in the measured arrival times.
Finally, the arrival time of the main pulse of the Crab pulsar has been studied from radio, IR, optical up to X-ray wavelengths (e.g. Ray et al. ray (2003)). We present here a first estimate of the -ray (30 MeV – 30 GeV) radio delay using data from EGRET (Thompson et al. thompson (1993)) aboard the Compton Gamma-Ray Observatory (CGRO).
2 INTEGRAL timing resolution
In order to stay within the limited telemetry budget of INTEGRAL, the event timing information measured by the instruments has been degraded on board. The accuracy of the On Board Time (OBT) for IBIS/ISGRI (optimized for energies 15 – 200 keV, Lebrun et al. lebrun (2003)) is thus , for IBIS/PICsIT (optimized for energies 175 keV – 10 MeV, Di Cocco et al. dicocco (2003)) is (for IBIS the least significant 8 bits are cleared), for SPI (the least significant 11 bits are cleared) and for JEM-X (the readings of the Digital Front End Electronics clock). There are additional smaller uncertainties affecting the event timing accuracy, e.g. the OBT might have an uncertainty up to about , uncertainties in the orbit predictions can cause similar uncertainties and for pulsar studies the conversion to the arrival time at the Solar System Barycentre (SSB) will again add a similar error. These uncertainties affect the timing of single events and cause a broadening of derived timing signatures. We estimate that the resulting timing resolutions for pulsar timing studies using the arrival times at the SSB are for IBIS, for SPI and for JEM-X ( accuracy). As a first check, we used the Crab calibrations to compare the pulse profiles measured by the INTEGRAL instruments with the RXTE profile. A more accurate calibration should be performed in the future by studying the profiles of millisecond pulsars.
3 Observations and data
INTEGRAL observed the Crab from 7 February 2003 (revolution 39) up to and including 27 February 2003 (revolution 45). The spacecraft and instruments were in different modes during this calibration period. For our investigations we need photon-by-photon modes in which each event is time tagged. The IBIS/ISGRI detector, SPI and JEM-X were all in photon-by-photon mode during revolution 42, roughly in the middle of the Crab observations. We used for these three instruments the data from revolution 42, collected at the REDU groundstation, which provided ample statistics. The IBIS/PICsIT detector, unfortunately, cannot routinely be configured in photon-by-photon mode due to PICsIT’s high count rate and the tight telemetry budget of INTEGRAL. In revolutions 39 and 40, PICsIT was part of the time commanded in photon-by-photon mode allowing a test of the timing capabilities. We used these data collected at REDU.
The RXTE PCA (Jahoda jahoda (1994)) routinely monitors the Crab pulsar, and had one observation on 13 February 2003, roughly in the middle of our Crab calibrations, and one on 27 February 2003, at the end of the INTEGRAL observations. We retrieved these data from the High Energy Astrophysics Science Archive Research Center (HEASARC) at NASA/Goddard Space Flight Center.
EGRET, sensitive to high-energy -rays from 30 MeV to 30 GeV (Thompson et al. thompson (1993)), had the Crab 20 times in its field-of-view with high signal-to-noise over a 7.5 year baseline starting in April 1991 (details of the EGRET observations of the Crab are given in Kuiper et al. kuiper (2001)) . We used these data to study the -ray radio delay of the main pulse.
| Parameter | Value |
|---|---|
| Val. range (MJD) | 52 671–52 699 |
| (MJD; TDB) | 52 685.0 |
| (Hz) | 29.8092705122612 |
| ( Hz s-1) | 3.73661 |
| ( Hz s-2) | 2.01 |
| RMS of ToA fit | s |
| Phase of radio MP at zero epoch () | 0.2838 |
| 05h34m31s.972 | |
| 22°00′52″.07 |
4 Timing analysis
The Jodrell Bank radio telescope (UK) performs monthly monitoring of PSR B0531+21, providing us with a Crab radio ephemeris valid for INTEGRAL revolutions 39 – 45, including the dates of the RXTE observations (see Table 1).
4.1 RXTE analysis and results
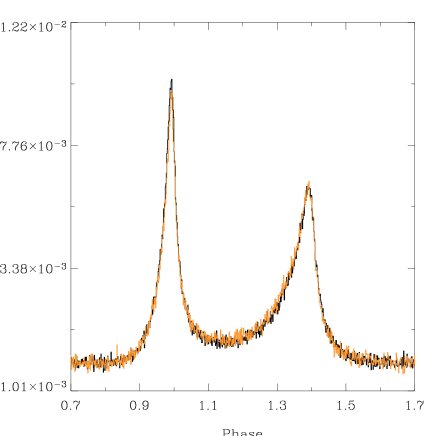
In the timing analysis of the RXTE PCA data of 13 and 27 February 2003 the barycentered event arrival times were folded with the ephemeris in Table 1, providing us with accurate X-ray pulse profiles in absolute phase (see Fig. 1). The PCA events are time tagged with a accuracy with respect to the spacecraft clock and with an absolute time accuracy of 5 – 8 with respect to UTC. The maximum of the main radio pulse is at phase 0.0, the fiducial point in the radio template. For both data sets (13 and 27 February), we determined the absolute arrival time/phase of the main X-ray pulse by fitting the profile with an asymmetric Lorentzian plus a constant background. The fits were perfect with the X-ray maxima leading the radio pulse by and , respectively. The errors are , statistical only. The difference between the two estimates is a measure of the systematic uncertainty in the radio parameters, e.g. due to dispersion measure variations, and is consistent with earlier RXTE estimates of (Rots et al. rots (2000) and Tennant et al. tennant (2001)) and also with a recent estimate of using XMM-Newton data (Kirsch et al. kirsch (2004)).
4.2 INTEGRAL analysis and results
For the analysis of the INTEGRAL data, we selected all time-tagged events received via the REDU groundstation during revolution 42. For both JEM-X monitors Pulse Height Analyzer channels 128 – 192 were selected, corresponding at the time of the Crab calibration for JEM-X1 to energies 9 – 23 keV, and JEM-X2 6 – 15 keV (a complementary timing study of the Crab pulsar with JEM-X is reported by Brandt et al. brandt (2003)). For IBIS/ISGRI and SPI events were used with energies 20 – 50 keV. Finally, for IBIS/PICsIT we had 214 ks exposure in photon-by-photon mode in revolutions 39 and 40, and selected events with energies 180 – 580 keV (PHA 25 – 75). Unfortunately, the latter data set has low statistics.
The arrival times of the events at the spacecraft are registered in On Board Time (OBT), which is converted on ground to Terrestrial Time, expressed in INTEGRAL Julian Date (IJD) (see Walter et al. walter (2003)). The correlation between the OBT and IJD needs to take into account delays on board for each of the instruments, delays within the ground stations and due to light travel time. A full description with correction values is given in Walter et al. (walter (2003)). In this work we applied all these corrections valid during the Crab calibrations to obtain absolute time: Offset added to UTC ; delays ESA REDU grounstation and NASA DSS-16 groundstation ; delays per instrument derived from ground calibrations, IBIS , SPI and JEM-X .
The arrival times of the INTEGRAL time-tagged events were also converted to the arrival time at the Solar System Barycentre and folded with the Crab ephemeris in Table 1. The resulting Crab profiles in absolute phase (i.e. the main radio pulse is at phase 0.0) are shown in Fig. 1, with the profiles of JEM-X1 and JEMX-2 summed in one figure. The excellent agreement with the RXTE PCA profiles is evident for the JEM-X data. At higher energies the INTEGRAL data display the known evolution of the Crab pulse profile with increasing energy: 1) a higher level of bridge emission between the peaks for IBIS and SPI compared to RXTE and JEM-X, 2) the relative intensity of the first pulse is higher for IBIS and SPI than for RXTE and JEM-X (see e.g. Kuiper et al. kuiper (2001)). On this scale, we do not see any broadening of the INTEGRAL profiles relative to the RXTE profile. For comparison, the half-width-half-maximum of the first Crab pulse is about .
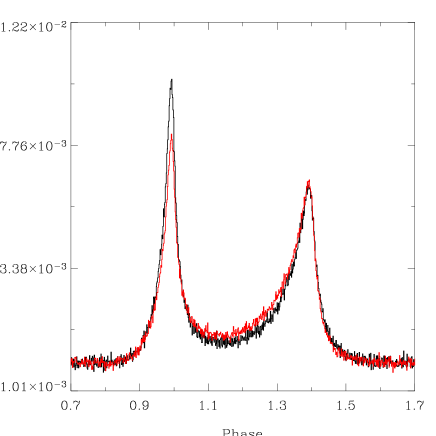
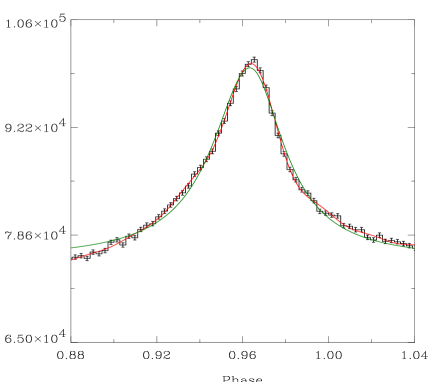
In order the compare the absolute times more accurately, we determined for JEM-X1, JEM-X2, IBIS/ISGRI and SPI the arrival phases of the main (first) pulses, similar to what was done for RXTE. In each case the profile of the main pulse was fitted with an asymmetric Lorentzian plus constant background and the phase of the maximum was determined. The uncertainties in the latter have a small statistical error, but there is also a systematic uncertainty which depends on the choice of the fit function. In order to get an estimate of the magnitude of the systematic uncertainties, we also made Fourier fits with 40 harmonics. Fig. 2 shows as an example the fits for IBIS/ISGRI. The phase difference between the two fit maxima is , representative for the systematic uncertainties for all instruments.
For the Fourier fits, we find the following X-ray radio delays: JEM-X1 , JEM-X2 , IBIS/ISGRI , SPI . The errors are , statistical only. Taking the systematic uncertainties into account, the average value for the measured X-ray radio delay is . It can be noted that, firstly, the INTEGRAL instruments give fully consistent results, and, secondly, the average INTEGRAL value is fully consistent with the RXTE PCA values derived using the same radio ephemeris, even though the two X-ray measurements employ very different means of measuring time and satellite position and thus have different systematic error budgets.
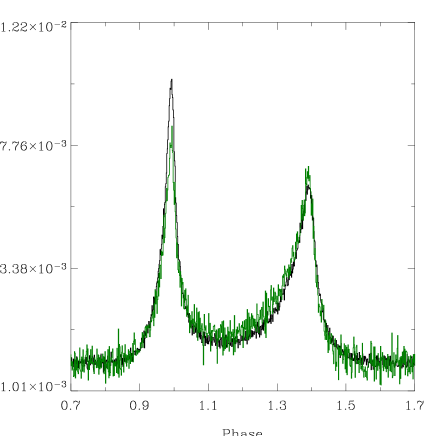
Due to the tight telemetry budget, it is foreseen that IBIS/PICsIT will hardly be configured in photon-by-photon mode. For timing studies observers can select the spectral-timing mode with highest time resolution of 0.97656 ms. To verify the correct performance, PICsIT was in revolutions 40 and 41 also in spectral-timing mode for 345 ks. We produced the Crab pulse profile shown in Fig. 3, which has a significance of . The profile is consistent with those shown in Fig. 1. The intense bridge emission between the peaks is expected for the selected high energy range (band 3, 260 – 364 keV).
4.3 Arrival time Crab main pulse at -ray energies above 30 MeV
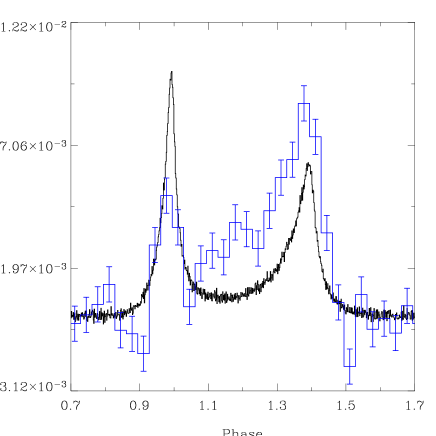
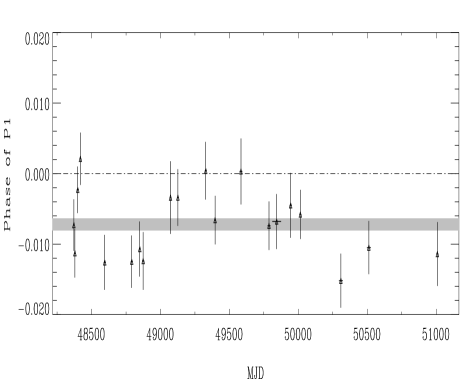
For the 20 EGRET observations with high-statistics Crab data, we constructed for all observations the high-energy (30 MeV – 30 GeV) pulse profiles, following Kuiper et al. kuiper (2001). It should be noted that different ephemerides had to be used over the CGRO mission lifetime, such that the different profiles can not be directly summed in absolute phase. Due to e.g. variations in the dispersion measure, derived arrival phases will scatter around the genuine value. The main peak of the high-energy profile is very symmetric, because the bridge emission is very weak at these high energies. Therefore, we determined for each observation the arrival phase of the main pulse by fitting a symmetric Lorentzian profile plus a constant background to the measured event distribution in a relatively broad (0.3) phase window centered around phase 0. In Fig. 4 these arrival phases are shown as a function of time over a year baseline. The error bars on the individual datapoints are composed of a statistical contribution from the profile fit and of a systematic component of about () reflecting the uncertainties in the dispersion measure from the radio pulsar timing observations (see explanatory supplement README.txt in the Princeton CGRO database directory). The arrival phases have been fitted by a constant value yielding as optimum value for an acceptable value of 1.59 for 19 degrees of freedom. This offset in the phase domain translates to an offset of in the time domain and indicates that the high energy -ray photons from the main pulse also arrive earlier than the maximum of the main radio pulse. This value of is significantly larger than the quoted CGRO absolute timing uncertainty of better than and is fully consistent with the results obtained above from the INTEGRAL and RXTE X-ray data.
5 Discussion
We have determined with all high-energy instruments aboard INTEGRAL, i.e. the imager IBIS, the spectrometer SPI and the X-ray monitor JEM-X, the X-ray radio delay between the absolute arrival times of the X-ray and radio main pulses in the profile of the Crab pulsar, PSR B0531+21. Within the statistical accuracies these instruments measured the same delay, on average (the error includes estimates of statistical and systematic uncertainties), the X-ray pulse leading the radio one. This value is consistent with the delays we measured twice with the RXTE/PCA during the period of the INTEGRAL Crab calibrations, namely and , statistical errors only. These results show that INTEGRAL meets its specifications and can measure absolute arrival times with accuracies down to about . Fig. 5 shows the X-ray main pulse measured by ISGRI for energies 20 – 50 keV together with its radio counterpart at 812.5 MHz measured with the Greenbank 140 ft telescope (Lundgren lundgren (1994)). In addition to the phase shift, it is evident that the profile shapes are very different. The narrow radio profile is shifted but contained in the phase range covered by the X-ray profile.

We also measured the delay of the arrival time of the main pulse in the high-energy (30 MeV – 30 GeV) -ray profile relative to the main radio pulse, using 20 Crab observations by CGRO/EGRET over a year baseline: . This value appears to be consistent with the delay measured for the main X-ray pulse and is an additional constraint in the three-dimensional modelling of the production processes and sites in the magnetospheres of rotation powered pulsars.
In Kuiper et al. kuiper (2001), presenting for the Crab a coherent high-energy picture from soft X-rays up to high-energy -rays, it is argued that models with an outer gap are more successful in reproducing the overall characteristics of PSR B0531+21 as measured from the radio up to the -ray domain, than polar cap models. These are the two competing model scenario’s attempting to explain the high-energy radiation from magnetized rotating neutron stars. The known large magnetic inclination angle , i.e. the angle between the pulsar spin axis and magnetic moment axis, and aspect angle , i.e. the angle between the spin axis and the observer’s line of sight, which are for the Crab both estimated from radio and optical observations to be , cause for polar cap scenarios problems to reproduce the structure of the Crab light curve (see e.g. discussion in Kuiper et al. kuiper (2001)). Fig. 6 shows the phase aligned total Crab profiles for the energy windows we are addressing in this work (for a detailed presentation of the frequency-dependent behaviour of the average radio pulse profile, see Moffett Hankins moffett (1996)). Outer gap scenarios can for these large geometrical angles and account for the measured double peaked profile with bridge emission in the X-ray and soft -ray band (e.g. Chiang & Romani chiang (1994)), and are also succesful in reproducing characteristics as the observed polarization position angle swings of the Crab pulsar at optical wavelengths (Romani & Yadigaroglu romani (1995)). The radio precursor, visible in the 430 MHz profile in Fig. 6 a, originates in the outer gap models from near the polar cap. The phase shift between the high-energy main pulse (X-rays and -rays) and the main radio pulse is an additional detail to be accounted for. More recently, Cheng, Ruderman & Zhang cheng (2000) extended the outer magnetospheric gap model to a detailed three dimensional model with photon emission moving outward and inward from regions in outer gaps above both poles, the gaps being limited along the azimuthal direction by pair production of inward-flowing photons from the outer gaps. In their model the main X-ray/-ray pulse is produced high in the magnetosphere at 0.8 1.0 with the light cylinder radius. In order to account for the delay of the radio main pulse, the production site of radio emission in the narrow outer gap should be slightly shifted inwards to the neutron star with respect to the production site for the high-energy emisssion, but still contained in the latter. It is expected that the intensity weighting along the gap surface differs for different energy bands, but the non-thermal radio emission is likely produced in a narrower region of the thin outer gap along the last closed field line. More detailed modelling should show whether this can explain the profiles shown in Fig. 5.

Acknowledgements.
We wish to thank the High Energy Astrophysics Science Archive Research Center (HEASARC) at NASA/Goddard Space Flight Center for maintaining its online archive service which provided the RXTE data used in this research. LF acknowledges financial support by the Italian Space Agency (ASI) and the hospitality of the ISDC during part of this work.References
- (1) Brandt, S., Budtz-Jørgensen, C., Lund, N., et al. 2003, A&A, this volume
- (2) Cheng, K.S., Ruderman, M., Zhang, L., 2000, ApJ 537, 964
- (3) Chiang, J., Romani, R.W., 1994, ApJ 436, 754
- (4) Di Cocco, G., Caroli, E., Celesti, E., et al. 2003, A&A, this volume
- (5) Jahoda, K. 1994, AAS Meeting 26, 894
- (6) Kirsch, M.G.F., Becker, W., Benlloch-Garcia, S., et al. 2004, to appear in the proceedings of the SPIE 2003 conference
- (7) Kuiper, L., Hermsen, W., Cusumano, G., et al. 2001, A&A, 378, 918
- (8) Lebrun, F., Leray, J.P., Lavocat, P., et al. 2003, A&A, this volume
- (9) Lund, N., Brandt, S., Budtz-Jørgensen, C., et al. 2003, A&A, this volume
- (10) Lundgren, S.C. 1994, PhD Thesis, Cornell University
- (11) Moffett, D.A. & Hankins, T.H. 1996, ApJ 468, 779
- (12) Ray, P.S., Wood, K.S., Wolff, M.T., et al. 2003, Am. Astrono. Soc. HEAD meeting 35, 2213
- (13) Romani, R.W., Yadigaroglu, I.A. 1995, ApJ 438, 314
- (14) Rots, A.H., Jahoda, K., Lyne, A.G., 2000, Am. Astron. Soc. HEAD meeting, 32, 3308R
- (15) Tennant, A.F., Becker, W., Juda, M., et al. 2001, ApJ 554, L173
- (16) Thompson, D.J., Bertsch, D.L., Fichtel, C.E., et al. 1993, ApJS 86, 629
- (17) Ubertini, P., Lebrun, F., Di Cocco, G., et al. 2003, A&A, this volume
- (18) Vedrenne, G., Roques, J.-P., Schönfelder, V., et al. 2003, A&A, this volume
- (19) Walter, R., Favre, P., Dubath, P., et al. 2003, A&A, this volume
- (20) Winkler, C., Courvoisier, T.J.-L., Di Cocco, G., et al. 2003, A&A, this volume