ATOMIC DEUTERIUM/HYDROGEN IN THE GALAXY
Abstract
An accurate value of the deuterium/hydrogen (D/H) ratio in the local interstellar medium (LISM) and a better understanding of the D/H variations with position in the Galactic disk can provide essential information on the primordial D/H ratio in the Galaxy at the time of the protosolar nebula, and the amount of astration and mixing in the Galaxy over time. Recent measurements have been obtained with UV spectrographs on FUSE, HST, and IMAPS using hot white dwarfs, OB stars, and late-type stars as background light sources against which to measure absorption by D and H in the interstellar medium along the lines of sight. Recent analyses of FUSE observations of seven white dwarfs and subdwarfs provide a weighted mean value of D/H = ( ppm), consistent with the value of ( ppm) obtained from analysis of lines of sight toward nearby late-type stars. Both numbers refer to the ISM within about 100 pc of the Sun, which samples warm clouds located within the Local Bubble. Outside of the Local Bubble at distances of 200 to 500 pc, analyses of far-UV spectra obtained with IMAPS indicate a much wider range of D/H ratios between 0.8 to 2.2 ppm, providing information on inhomogeneous astration in the Galactic disk.
Appl. Opt. Jeffrey L. Linsky, JILA, University of Colorado, Boulder, CO 80309-0440, USA; jlinsky@jila.colorado.edu
1 Why are Accurate Measurements of the D/H Ratio Important?
Measurements of D/H, the number ratio of deuterium in all forms to hydrogen in all forms, are important for at least two reasons. First, an accurate measurement of the primordial ratio, (D/H)prim, counts the number of baryons in the universe to determine the ratio of the baryon density to the closure density, and tests our assumptions concerning nucleosynthesis during the first 100–1,000 seconds of the universe (e.g., \openciteBurlesetal01). Deuterium is our best probe of primordial nucleosynthesis because theory predicts that D was formed only in the very early universe, D is the easiest isotope to be destroyed by nuclear reactions in stars (astration), and is a very sensitive single-valued function of (D/H)prim. The best approximation to (D/H)prim would be an accurate measurement of D/H in gas where there has been little chemical fractionation or star formation, as indicated by very low metal abundances, but such measurements remain difficult.
Second, measurements of D/H in different locations in our Galaxy will provide an accurate test of the assumptions underlying Galactic chemical evolution models. A major problem in astrophysics is understanding how galaxies evolve and, in particular, how the chemical element abundances evolve. In broad overview, we know that stars form out of gas clouds and over time they destroy D, create metals, and return some of this deuterium-poor and metal-rich material to the ISM by winds and supernova explosions. The detailed rates for these processes depend on the initial stellar masses. Thus with time D/H should decrease and metal abundances should increase. Theoretical models for Galactic chemical evolution rest on many assumptions that measurements of D/H in different environments can test. In particular, the temporal and spatial scales for mixing in the ISM are poorly known and likely depend on the magnetic field, which is also poorly known.
2 What is the Best Way of Measuring D/H?
While I believe that the most accurate D/H measurements are obtained from interstellar H and D Lyman line absorption in warm interstellar gas, I first summarize the various techniques that have been used to measure D/H in the Galaxy:
- Deuterated molecules in cold interstellar clouds:
-
HDO/H2O 1000 ppm111I express D/H ratios in parts per million (ppm) in bold face to facilitate intercomparisons. and other deuterated molecules also show very high abundances. Since deuterated molecules are more tightly bound than nondeuterated molecules, the small difference in the binding energies divided by can be large at cold temperatures (10–20 K). For example, the reaction HD + H2O HDO + H2 at low temperatures leads to HDO/H2O D/H. Carbon molecule chemistry also creates huge overabundances of the deuterated molecules.
- HD/H2 in the ISM:
-
In cold clouds nearly all D is tied up in HD molecules, so HD/H2 measures D/H. Measurement of the HD J = 1 0 pure rotation line (112 m) in the Orion Bar [Wright et al. (1999)] by the ISO spacecraft gives D/H = 10 3 ppm. This value for D/H may not be representative of the gas, however, since HD is not self-shielded like H2 and will have a higher photodissociation rate from stellar and diffuse UV radiation.
- Balmer- line in the Orion Nebula:
-
\inlinecite
Hebrardetal00 first detected narrow deuterium Balmer- and Balmer- emission lines. Accurate measurements of the D/H ratio from the Balmer lines is difficult, however, because the D Balmer lines are fluorescent lines pumped by the hot star continuum, whereas the H Balmer lines are recombination lines (cf. \openciteOdelletal01).
- Hyperfine structure line:
-
The most recent search for the 92 cm (327 MHz) deuterium line in the ISM toward the Galactic anticenter yields a possible detection [Chengalur et al. (1997)] with D/H = ppm.
- D/H in the Sun:
-
A search for D Balmer- emission at –1.785 Å relative to H Balmer- [Beckers (1975)] gives an upper limit of D/H 0.25 ppm. This very low value for D/H is consistent with the burning of D deep in the convective zone and the mixing of this D-depleted gas throughout the solar atmosphere.
- D/H in the solar system:
-
In his review paper, \inlineciteRobertetal00 list for D/H in comets 300 ppm, meteorites 80–1000 ppm, Jupiter and Saturn 25 ppm, Uranus and Neptune 60 ppm. The standard explanation is that the initially highly deuterated water and other molecules become less deuterated with time by isotopic exchange with H2 at warmer temperatures. Terrestrial water also started with a very high D/H ratio and subsequently reached its present ratio of HDO/H2O = 150 ppm via partial isotopic re-equilibrium with warm H2.
3 Measuring D/H with UV Spectra from HST
The Goddard High Resolution Spectrograph (GHRS) and the Space Telescope Imaging
Spectrograph (STIS) instruments on HST with resolution of km s-1
are providing beautiful spectra of interstellar Lyman- absorption
with which to measure the column densities N(D I) and N(H I) and thus D/H.
Several serendipidous results have already emerged from this analysis.
Virtues of this approach:
-
Since no molecules are present in the warm ( K) ISM clouds, there is no chemical fractionation and the fractional ionization of H and D are the same. Thus N(D I)/N(H I) equals the D/H ratio in these warm clouds.
-
For lines of sight through the LISM, N(H I) – cm-2 and N(D I) – cm-2. Thus for either Lyman- or higher Lyman series lines, the D line has measurable opacity while the corresponding H line is not too optically thick to absorb completely the D line located at –82 km s-1. The “horizon” set by the H I column density at which the saturated core of the interstellar H absorption is as wide as 82 km s-1 is cm-2 for Lyman-, cm-2 for Lyman-, and larger for the higher Lyman lines.
Problems with this approach:
-
For many lines of sight, overlapping velocity components may permit one to measure (D/H)total, but not D/H for each component separately.
-
Low column density cloudlets of hydrogen that are Doppler shifted with respect to the main interstellar absorption feature add to the saturated H Lyman line absoption but have insufficient opacity to be detected in lines of D or any metal. When not included in the analysis, this “invisible” hydrogen can lead to large errors in N(H I) and thus the D/H ratio [Lemoine et al. (2002)].
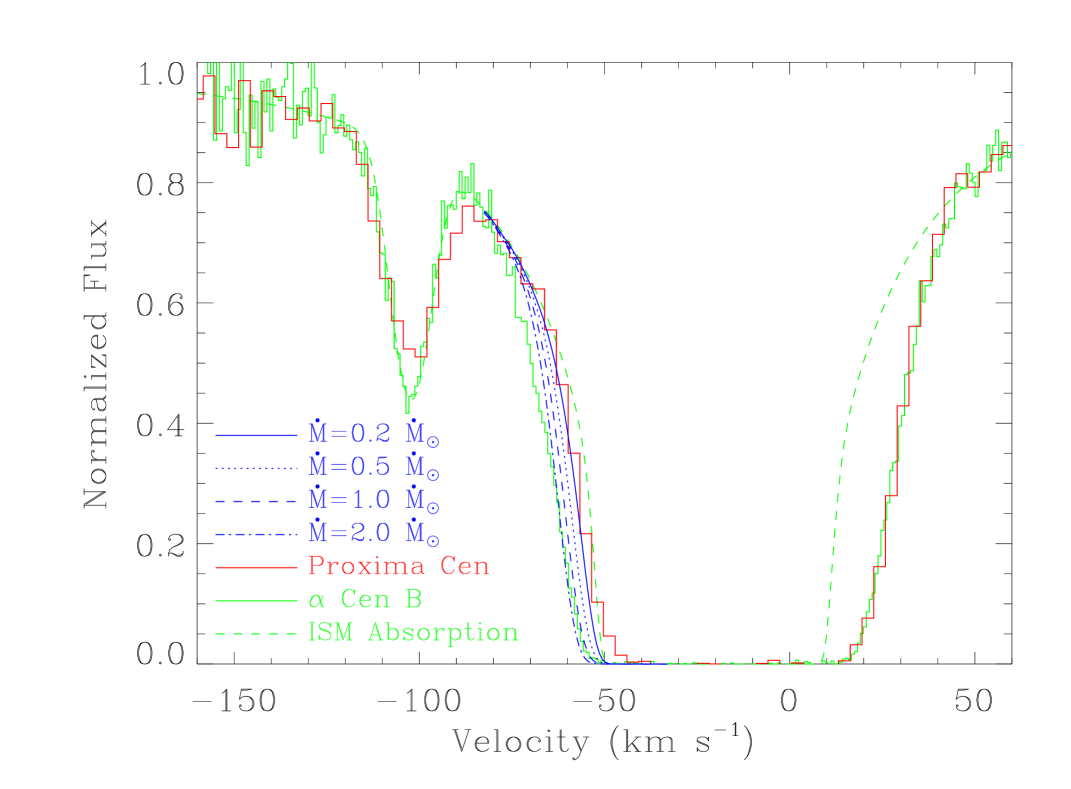
As an example of the complexities in the data analysis and the serendipidous results that have emerged from measuring the D/H ratio for the lines of sight to the nearby stars, I summarize recent studies (cf. \openciteLinskyWood96 and \openciteWoodetal01) of the short (1.3 pc) lines of sight to the triplet Centauri system: A (a G2 V star like the Sun), B (a K2 dwarf), and C (Proxima Centauri, an M dwarf).
-
The interstellar Fe II and Mg II resonance lines formed in the lines of sight to these stars show absorption at only one velocity, indicating that there is only one warm cloud, the so-called G (or Galactic Center) Cloud along this simple line of sight. However, the central velocity of the H Lyman- absorption is redshifted by 2.2 km s-1 relative to the D Lyman and metal line absorption, indicating the presence of a second red-shifted absorber in the H line.
-
Additional absorption on the red side of the H Lyman- absorption profile (see Fig. 1) is due to the “hydrogen wall” in the heliosphere produced by the interaction and charge exchange of inflowing LISM neutral H with outflowing solar wind protons near the heliopause (e.g., \openciteZanketal01). N(H I) N(H I)Gcloud, which is sufficient to explain the additional H absorption but insufficient to provide measurable D or metal line absorption. If the H wall absorption is not included in the analysis, then the inferred N(H I) would be a factor of 2 too large and the inferred D/H ratio a factor of 2 too small.
-
Additional absorption on the blue side of the H Lyman- absorption profile of Cen A and B (see Fig. 1) is due to hydrogen wall absorption in their astrospheres produced by the interaction of LISM neutral H with their ionized stellar winds. The blue shift relative to the interstellar absorption results from viewing the decelerated H wall from the outside. The near absence of H wall absorption in the astrosphere of Proxima Centauri indicates a very low mass loss rate for this star. Studies of astrospheric absorption toward a number of nearby stars allowed \inlineciteWoodetal02a to infer stellar mass loss rates as small as , and to estimate the mass loss rate of the young Sun, which is important for understanding the evolution of the Martian atmosphere.
-
\inlinecite
Lemoineetal02 and \inlineciteVidalferlet02 have argued that systematic errors in deriving N(H I) from saturated Lyman line absorption are much larger than previously assumed, leading to very uncertain D/H values. Large systematic errors can indeed be present, but in several well studied examples independent measurements of N(H I) inferred from the shape of the Lyman continuum absorption are in excellent agreement with the Lyman- absorption results. Since the two diagnostic techniques are very different and the Lyman- and Lyman continuum optical depths differ by a factor of , the agreement in N(H I) to better than 10% using the two techniques indicates that the systematic errors for these lines of sight are not large. \inlineciteLinskyetal00 summarized the close agreement between the two different techniques for the lines of sight to the white dwarfs HZ 43 and G191-B2B, and for groups of late-type and white dwarf stars located within a few degrees of each other with lines of sight through the same clouds. Examples include the HZ 43, 31 Com, and GD 153 group, and the Capella and G191-B2B pair.
-
Analysis of Lyman- absorption for 12 sightlines through the LIC yield a mean value of D/H = 15.0 1.0 ppm [Linsky (1998)] and no trend with distance to the target star (up to 100 pc) or Galactic longitude. Other investigators have also analyzed GHRS and STIS data using different approaches. For example, \inlineciteVidalmadjaretal98 confirmed that the D/H ratio for the Capella line of sight through the LIC is consistent with the mean LIC value. The G191-B2B line of sight has generated more controvery, although \inlineciteVidalmadjaretal98, \inlineciteLemoineetal02, and \inlineciteSahuetal99 agree that D/H in the LIC component is consistent with the mean value. They disagree, however, on the value of D/H in the one or two other velocity components along the line of sight to this star located only pc away.
4 Structures in the Local Interstellar Medium
The D/H ratio is unlikely to be constant throughout the Galaxy. Prime candidates for different D/H ratios are those locations where the gas has been confined for a long time and the gas composition has been altered by stellar mass loss of astrated material with limited mixing with the gas in the rest of the Galaxy. We do not know a priori what these structures are, but as a start we should measure the D/H ratio in ISM gas located in identifiable structures in our local region of the Galaxy.
The Galactic halo extends for many kiloparsecs (kpc) above and below the Galactic plane and likely consists primarily of hot gas with low metal abundances. A prime goal of the Far Ultraviolet Spectrograph Explorer (FUSE) mission is to measure D/H in sightlines through the halo, but there are no results available to report. The thin disk of the Galaxy, in which most giant molecular clouds are located and star formation occurs, has a vertical scale height of 325 pc and a radial scale height pc. The D/H ratios measured toward OB stars in the thin disk by the Copernicus satellite and the IMAPS instrument will be discussed below.
The Sun is located inside a region of very low density called the Local Cavity. \inlineciteSfeiretal99 have modelled the contours of the Na I absorption that likely delineate the outer edge of hot low density gas ( 6.0–6.1) called the Local Bubble (LB), which extends outward by 100–200 pc from the Sun. It is likely that the LB fills most or all of the Local Cavity, but this is not yet demonstrated. The LB was likely formed by the winds and supernovae explosions of stars in the Scorpius-Centaurus Association as the 26 km s-1 flow vector is from the center of the Association. The age of the LB is a few million yr and the gas within it is likely well mixed and could be D-poor and metal-rich given its origin.
Within the LB are a number of small clouds consisting of warm, partially ionized gas (see Fig. 2). The Sun is located within but close to the edge of the Local Interstellar Cloud (LIC). First identified from its kinematics by \inlineciteLallementBertin92, the LIC was modelled by \inlineciteRedfieldLinsky00 as roughly spherical with dimensions of 5–8 pc, K, and cm-3. Within the LIC, D/H and the depletions of Mg and Fe appear to be constant. Located near the LIC are at least nine other warm clouds with similar temperatures but a wide range of metal depletions, indicating that grains in some clouds have been evaporated by shocks. The ionization fractions of H and He in the LIC are consistent with steady-state equilibrium for which the photoionization is from nearby stars (primarily CMa), the UV background, and an assumed UV radiation field formed at the boundary between warm clouds and the hot surrounding gas (cf. model 17 in \openciteSlavinfrisch02 and \openciteWoodetal02b).

5 FUSE Measurements of D/H Along the Lines of Sight to Nearby Hot White Dwarf Stars
The FUSE spacecraft obtains spectra of stars and extragalactic sources in the far–UV (910–1180 Å) with about 20 km s-1 resolution. For a description of the satellite and its capabilities see \inlineciteMoosetal00 and \inlineciteSahnowetal00. A major goal of the FUSE observing program is to measure D/H in local and more distant interstellar gas. The first results of this program are published in a series of eight papers appearing in the May 2002 issue of ApJ Supplements. \inlineciteMoosetal02 summarize the results obtained from analyses of the lines of sight to five white dwarfs (HZ 43, G191-B2B, WD 0621-376, WD 1634-573, and WD 2211-495) located at distances of 37–69 pc within the LB and to two subdwarfs (Feige 110 and BD +28∘4211) located at distances of 104–179 pc outside of the LB. White dwarfs are useful targets because they have a bright continuum with few stellar absorption lines, relatively simple lines of sight, and no stellar winds.
The basic approach taken in analyzing these spectra is to fit Voigt (convolved Doppler and damping) profiles to the interstellar absorption seen in the FUSE and STIS spectra to determine the number of absorption components and the total column densities for H, D, and important metals. One complication is that the FUSE spectra have insufficient spectral resolution to determine N(H I) from the shapes of the higher Lyman lines, so N(H I) is better determined from the Lyman- profile or EUVE measurements of the Lyman continuum absorption. Uncertainties in the FUSE line spread function and velocity scale also complicate the analysis. The possible presence along the line of sight of hot hydrogen absorbers with low column densities increases the uncertainty in N(H I) and thus D/H.
| Number Ratio | 5 sightlines inside LB | All 7 sightlines |
|---|---|---|
| D I/O I (FUSE LISM) | ||
| O/H (Sun) | ||
| D/H (ppm) | 18.42.3 | 19.52.5 |
| D/H (Ogas/O) | 14.71.8 | 15.62.0 |
| O I/H I (ISM) | ||
| D/H (ppm) | 12.90.8 | 13.70.8 |
| O I/H I (FUSE LISM) | ||
| D/H (ppm) | 14.81.5 | 12.11.0 |
An example of this work is the line of sight to G191-B2B analyzed by \inlineciteLemoineetal02. The line of sight to this hot DA white dwarf ( K, ) has 3 ISM velocity components: 19.6 km/s (LIC), 11.5 km/s, and 7.4 km/s. The inclusion of uncertainties in N(H I) from the possible presence of hot H absorbers and uncertainties in the stellar Lyman line shapes against which the interstellar absorption is measured leads to log N(H I) = (2 ) and (D/H)tot = 16.6 ppm.
For all seven lines of sight typical uncertainties in N(D I) are 10% (1), but the values of N(H I) obtained from EUVE, GHRS, STIS, or IUE spectra are typically uncertain by 17% (1). The weighted mean D/H = 15.2 0.8 ppm and the range in D/H values is 14–21 ppm. The line of sight with the highest D/H = 21.44.1 ppm is Feige 110, which is located ouside of the LB. D/H for the other six lines of sight cluster closely about 15 ppm.
An alternative and perhaps more accurate way of determing D/H is from measurements of D/O and O/H. Oxygen is a good proxy for hydrogen as the ionization potentials for O I and H I are nearly the same and their ionization equilibria are closely tied by charge exchange reactions. The presence of many optically thin O I lines in the FUSE spectrum leads to typical uncertainties in N(O I) of 10%. Typical uncertainties in D/O are 15%, and for the five white dwarfs inside the LB the weighted mean value is D/O = 0.0376 0.0020 (5%). The usually cited value is O I/H I = [Meyer (2002)] for the ISM at distances of 200–1000 pc. I take the new solar value of O/H = from \inlineciteAllende2001, who use their three-dimensional time-dependent hydrodynamical model solar atmospheres to analyze the [O I] 6300 Å line. Table I summarizes the D/H ratios derived using the measured D/O ratios and either the O/H ratio for the Sun (assuming 0% or 20% depletion of oxygen on to grains in the ISM), the Meyer (2002) value for the ISM gas, or the FUSE values for the LISM gas. For nearly all of these cases, the inferred D/H value is consistent with the directly measured value of D/H = 15.2 0.8 ppm.
6 What have We Learned about D/H in the Galaxy?
| Measurement Procedure | D/H (ppm) | Reference |
|---|---|---|
| HST (solar-like stars within 100 pc) | 15.01.0 | \inlineciteLinsky98 |
| FUSE (5 sightlines inside LB) | 15.20.8 | \inlineciteMoosetal02 |
| FUSE (D/O and O/H in LISM) | 14.81.5 | \inlineciteMoosetal02 |
| FUSE (D/O, solar O/H) | 18.42.3 | Table I |
| FUSE (D/O, solar O/Hx0.80) | 14.71.8 | Table I |
| Star | D (pc) | D/H (ppm) | Instrument | Reference |
|---|---|---|---|---|
| BD+28∘4211 | 104 | 13.91.0 | FUSE | \inlineciteSonnebornetal02 |
| Car | 135 | 5.01.6 | Copernicus | \inlineciteAllenetal92 |
| Feige 110 | 180 | 21.44.1 | FUSE | \inlineciteFriedmanetal02 |
| Cas | 188 | 132.5 | Copernicus | \inlineciteFerletetal80 |
| Sco | 216 | 7.62.5 | Copernicus | \inlineciteYork83 |
| Vel | 258 | 21.82.0 | IMAPS | \inlineciteSonnebornetal00 |
| Pup | 430 | 14.21.5 | IMAPS | \inlineciteSonnebornetal00 |
| Ori A | 500 | 7.41.0 | IMAPS | \inlineciteJenkinsetal99 |
| 4 QSOs | 304 | Keck | \inlineciteOmearaetal01 |
-
Within the Local Bubble (out to 100 pc or more from the Sun), D/H probably has a single value (i.e., the local ISM is well mixed). The measurements of D/H summarized in Table II lead me to conclude that the best value for D/H in the Local Bubble is (D/H)LB = 15 1 ppm.
-
Table III and Figure 3 summarize the D/H measurements of gas beyond the LB, including measurements toward two hot subdwarfs by FUSE, to three O stars by Copernicus, to three O stars by the IMAPS experiment, and the mean of four quasar sightlines studied with the Keck telescope. These results show a wide range of D/H = 5–22 ppm in the Galactic disk.
-
If we adopt the most recent quasar sightline value of D/H = 30 4 ppm [O’Meara et al. (2001)] as an approximate value for (D/H)prim, then the deuterium astration in the Local Bubble, (D/H)prim/(D/H)LB = ()/() = . The range of deuterium astration in the Galactic disk from the data in Table III is then 1.35–6.0.
-
Theoretical estimates of deuterium astration over the lifetime of our Galaxy are [Tosi et al. (1998)] and appear to be inconsistent with the wide range of observed astration values. However, the models make a number of assumptions that may not be valid. For example, the young Galaxy has primordial D/H and no metals, and the infalling gas from the halo has primordial or near-primordial abundances. Each ring of the Galaxy (several kpc wide) is assumed to be well mixed, and the gas is not mixed with gas in other rings. If the D/H results beyond the Local Bubble are valid, the Galactic chemical evolution models are overly simplified. The next generation of Galactic chemical evolution models must include episodic star formation (star bursts) with rapid mass loss and supernovae events and more realistic mixing scenarios.
-
All Galactic chemical evolution models predict that D/H and metal abundance should be anti-correlated, but the initial results from FUSE do not show this. Rather, there appears to be a weak positive correlation between D/H and O/H. Analysis of D/H and O/H for more lines of sight is needed.
-
(D/H) (D/H) 30 4 ppm is consistent with the primordial abundance of He and 7Li according to present models of Big Bang nucleosynthesis (e.g., \openciteBurlesetal01). The ratio of baryons to photons is , and the ratio of the baryon density to the closure density, . Big bang nucleosynthesis theory looks basically right.

Acknowledgements.
This work is supported by NASA grant S-56500-D to the University of Colorado and NIST and contract NAS5-32985 to The Johns Hopkins University for the NASA–CNES–CSA FUSE project. I would also like to thank Greg Herczeg, Seth Redfield, and Brian Wood for discussions, support, and figures.References
- Allen et al. (1992) Allen, M.M., Jenkins, E.B., and Snow, T.P.: 1992, ‘Interstellar Absorption along the Line of Sight to Carinae using Copernicus Observations’, Astrophys. J. Suppl. 83, 261–272.
- Allende Prieto et al. (2001) Allende Prieto, C., Lambert, D.L., and Asplund, M.: 2001, ‘The Forbidden Abundance of Oxygen in the Sun’, Astrophys. J. 556, L63–L66.
- Beckers (1975) Beckers, J.M.: 1975, ‘A Search for Deuterium on the Sun’, Astrophys. J. 195, L43–L45.
- Burles et al. (2001) Burles, S., Nollett, K.M., and Turner, M.S.: 2001, ‘Big Bang Nucleosynthesis Predictions for Precision Cosmology’, Astrophys. J. 552, L1–L5.
- Chengalur et al. (1997) Chengalur, J.N., Braun, R., and Butler Burton, W.: 1997, ‘D I in the Outer Galaxy’, Astron. Astrophys. 318, L35–L38.
- Ferlet et al. (1980) Ferlet, R., York, D.G., Vidal-Madjar, A., and Laurent, C.: 1980, ‘The Interstellar Medium on the Cassiopeiae Line of Sight’, Astrophys. J. 242, 578-583.
- Friedman et al. (2002) Friedman, S.D., Howk, J.C., Chayer, P. Tripp, T.M., Hebrard, G., Andre, M., Oliveira, C., Jenkins, E.B., Moos, H.W., Oegerle, W.R., Sonneborn, G., Lamontagne, R., Sembach, K.R., and Vidal-Madjar, A.: 2002 ‘Deuterium and Oxygen Toward Feige 110: Results from the Far Ultraviolet Spectroscopic Explorer (FUSE) Mission’, Astrophys. J. Suppl. 140, 37–49.
- Hébrard et al. (2000) Hébrard, G., Péquignot, D., Vidal-Madjar, A., Walsh, J. R., and Ferlet, R.: 2000, ‘Detection of Deuterium Balmer lines in the Orion Nebula’, Astron. Astrophys. 354, L79–L82.
- Jenkins et al. (1999) Jenkins, E.B., Tripp, T.M., Wozniak, P.,W., Sofia, U.J., and Sonneborn, G.: 1999, ‘Spatial Variability in the Ratio of Interstellar Atomic Deuterium to Hydrogen. I. Observations toward Orionis by the Interstellar Medium Absorption Profile Spectrograph’, Astrophys. J. 520, 182–195.
- Lallement and Bertin (1992) Lallement, R., and Bertin, P.: 1992, ‘Northern-Hemisphere Observations of Nearby Interstellar Gas - Possible Detection of the Local Cloud’, Astron. Astrophys. 266, 479–485.
- Lemoine et al. (2002) Lemoine, M. et al.: 2002, ‘Deuterium Abundance toward G191-B2B: Results from the Far Ultraviolet Spectroscopic Explorer (FUSE) Mission’, Astrophys. J. Suppl. 140, 67–80.
- Linsky (1998) Linsky, J.L.: 1998, ‘Deuterium Abundance in the Local ISM and Possible Spatial Variations’, Space Science Reviews 84, 285–296.
- Linsky and Wood (1996) Linsky, J.L., and Wood, B.E.: 1996, ‘The Centauri Line of Sight: D/H Ratio, Physical Properties of Local Interstellar Gas, and Measurement of Heated Hydrogen (the “Hydrogen Wall”) near the Heliopause’, Astrophys. J. 463, 254–270.
- Linsky et al. (2000) Linsky, J.L., Redfield, S., Wood, B.E., and Piskunov, N.: 2000, ‘The Three-Dimensional Structure of the Warm Local Interstellar Medium. I. Methodology’, Astrophys. J. 528, 756–766.
- Meyer (2002) Meyer, D.: 2002, ‘CNO Abundances in the Diffuse Interstellar Medium’, in R. Ferlet et al. (eds.), Gaseous Matter in the Galaxies and Intergalactic Space, XVIIth IAP Colloquium, pp. 135–140.
- Moos et al. (2000) Moos, H.W., et al.: 2000, ‘Overview of the Far Ultraviolet Spectroscopic Explorer Mission’, Astrophys. J. 538, L1–L6.
- Moos et al. (2002) Moos, H.W., et al.: 2002, ‘Abundances of Deuterium, Oxygen, and Nitrogen in the Local Interstellar Medium: Overview of First Results from the Far Ultraviolet Spectroscopic Explorer Mission’, Astrophys. J. Suppl. 140, 3–17.
- O’Dell et al. (2001) O’Dell, C.R., Ferland, G.J., and Henney, W.J.: 2001, ‘Measurement and Interpretation of Deuterium-Line Emission in the Orion Nebula’, Astrophys. J. 556, 203–214.
- O’Meara et al. (2001) O’Meara, J.M., Tytler, D., Kirkman, D., Suzuki, N., Prochaska, J., Lubin, D, Wolfe, A.M.: 2001, ‘The Deuterium to Hydrogen Abundance Ratio toward a Fourth QSO: HS 0105+1619’, Astrophys. J. 552, 718–730.
- Redfield and Linsky (2000) Redfield, S., and Linsky, J.L.: 2000, ‘The Three-Dimensional Structure of the Warm Local Interstellar Medium. I. The Colorado Model of the Local Interstellar Cloud’, Astrophys. J. 534, 825–837.
- Redfield and Linsky (2001) Redfield, S., and Linsky, J.L.: 2001, ‘Microstructure of the Local Interstellar Cloud and the Identification of the Hyades Cloud’, Astrophys. J. 551, 413–428.
- Robert et al. (2000) Robert, F., Gautier, D., and Dubrulle, B.: 2000, ‘The Solar System D/H Ratio: Observations and Theories’, Space Science Reviews 92, 201–224.
- Sahu et al. (1999) Sahu, M.S., Landsman, W., Bruhweiler, F.C., Gull, T.R., Bowers, C.A., Lindler, D., Feggans, K., Barstow, M.A., Hubeny, I., and Holberg, J.B., 1999 ‘The D/H Ratio in Interstellar Gas toward G191-B2B’, Astrophys. J. 523, L159–L163.
- Sfeir et al. (1999) Sfeir, D.M., Lallement, R., Crifo, F., and Welsh, B.Y.: 1999, ‘Mapping the Contours of the Local Bubble: Preliminary Results’, Astron. Astrophys. 346, 785–797.
- Sahnow et al. (2000) Sahnow, D.J., et al.: 2000, ‘On-Orbit Performance of the Far Ultraviolet Spectroscopic Explorer Satellite’, Astrophys. J. 538, L7–L11.
- Slavin and Frisch (2002) Slavin, J.D., and Frisch, P.C.: 2002, ‘The Ionization of Nearby Interstellar Gas’, Astrophys. J., in press.
- Sonneborn et al. (2000) Sonneborn, G., Tripp, T.M., Ferlet, R., Jenkins, E.B., Sofia, U.J., Vidal-Madjar, A., and Wozniak, P.R.: 2000, ‘Spatial Variability in the Ratio of Interstellar Atomic Deuterium to Hydrogen. II. Observations toward Velorum and Puppis by the Interstellar Medium Absorption Profile Spectrograph’, Astrophys. J. 545, 277–289.
- Sonneborn et al. (2002) Sonneborn, G., Andre, M., Oliveira, C., Hebrard, G., Howk, J.C., Tripp, T.M., Chayer, P., Friedman, S.D., Kruk, J.W., Jenkins, E.B., Lemoine, M., Moos, H.W., Oegerle, W.R., Sembach, K.R., and Vidal-Madjar, A.: 2002, ‘Interstellar Deuterium, Nitrogen, and Oxygen Abundances Toward BD +28 4211: Results from the Far Ultraviolet Spectroscopic Explorer’ Spectrograph’, Astrophys. J. Suppl. 140, 51–66.
- Tosi et al. (1998) Tosi, M., Steigman, G. Matteucci, F. and Chiappini, C.:1998 ‘Is High Primordial Deuterium Consistent with Galactic Evolution?’, Astrophys. J. 498, 226–240.
- Vidal-Madjar and Ferlet (2002) Vidal-Madjar, A., and Ferlet, R.: 2002, ‘Hydrogen Column Density Evaluations Toward Capella: Consequences on the Interstellar Deuterium Abundance’, Astrophys. J. Letters, in press.
- Vidal-Madjar et al. (1998) Vidal-Madjar, A., Lemoine, M., Ferlet, R., Hébrard, G., Koester, D., Audouze, J., Cassé, M., Vangioni-Flam, E., and Webb, J.: 1998, ‘Detection of Spatial Variations in the (D/H) Ratio in the Local Interstellar Medium’, Astron. Astrophys. 338, 694–712.
- Wood et al. (2001) Wood, B.E., Linsky, J.L., Müller, H.R., and Zank, G.P.: 2001, ‘Observational Estimates for the Mass-loss Rates of Centauri and Proxima Centauri using Hubble Space Telescope Ly Spectra’ Astrophys. J. 547, L49–L52.
- Wood et al. (2002a) Wood, B.E., Müller, H.R., Zank, G.P., and Linsky, J.L.: 2002a, ‘Measured Mass Loss Rates in Solar-like Stars as a Function of Age and Activity’, Astrophys. J., in press.
- Wood et al. (2002b) Wood, B.E., Redfield, S., Linsky, J.L., and Sahu, M.S.: 2002b, ‘Elemental Abundances and Ionization States within the Local Interstellar Cloud Based on HST and FUSE Observations of the Capella Line of Sight’, Astrophys. J., submitted.
- Wright et al. (1999) Wright, C.M., van Dishoeck, E.F., Cox, P., Sidher, S.D., and Kessler, M.F.: 1999, ‘Infrared Space Observatory-Long Wavelength Spectrometer Detection of the 112 Micron HD J = 1 –> 0 Line toward the Orion Bar’, Astrophys. J., 515, L29–L33.
- York (1983) York, D.G.: 1983, ‘The Interstellar Medium near the Sun. III - Detailed Analysis of the Line of Sight to Scorpii’, Astrophys. J., 264, 172–195.
- Zank et al. (2001) Zank, G.P., Müller, H.-R., and Wood, B.E.: 2001, ‘The interaction of the Solar Wind and Stellar Winds with the Partially Ionized Interstellar Medium’, Physics of Plasmas, 8, 2385–2393.