11email: ebisawa@obs.unige.ch 22institutetext: code 662, NASA/GSFC, Greenbelt, 20771 Maryland, USA 33institutetext: Observatory of Geneva, 51 chemin des Maillettes, 1290 Sauverny, Switzerland
High-Energy sources before INTEGRAL
We describe the INTEGRAL reference catalog which classifies previously known bright X-ray and gamma-ray sources before the launch of INTEGRAL. These sources are, or have been at least once, brighter than mCrab above 3 keV, and are expected to be detected by INTEGRAL. This catalog is being used in the INTEGRAL Quick Look Analysis to discover new sources or significantly variable sources. We compiled several published X-ray and gamma-ray catalogs, and surveyed recent publications for new sources. Consequently, there are 1122 sources in our INTEGRAL reference catalog. In addition to the source positions, we show an approximate spectral model and expected flux for each source, based on which we derive expected INTEGRAL counting rates. Assuming the default instrument performances and at least sec exposure time for any part of the sky, we expect that INTEGRAL will detect at least 700 sources below 10 keV and 400 sources above 20 keV over the mission life.
Key Words.:
INTEGRAL – X-ray sources – gamma-ray sources – catalog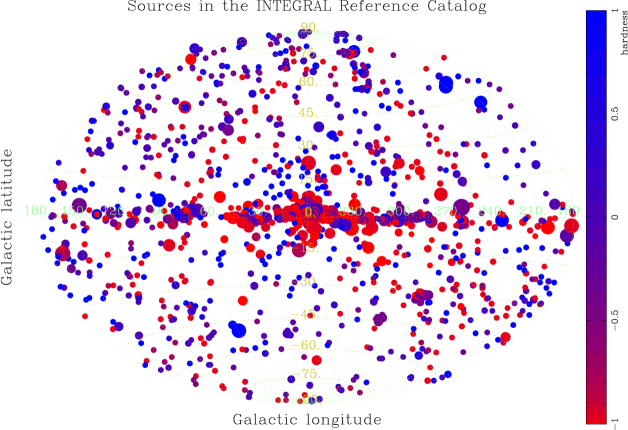
1 Introduction
One of the main purposes of the INTEGRAL mission is to discover new X-ray/gamma-ray sources, and also to monitor significantly variable sources. When new or transient sources are detected, INTEGRAL is expected to give prompt announcements to the worldwide astronomical community. Near real-time monitoring of the INTEGRAL data, i.e., Quick Look Analysis (QLA), is carried out at the INTEGRAL Science Data Center (ISDC; Courvoisier et al. 2003a). To this end, we need a reliable X-ray/gamma-ray source catalog with which INTEGRAL QLA results can be compared.
Many X-ray/gamma-ray source catalogs have already been published. To make the INTEGRAL Reference Catalog, which we describe in the current paper, we searched the literature, took several high-energy catalogs, combined them and selected sources to suit our needs. Note that the INTEGRAL Reference Catalog is continuously updated for the QLA purpose by incorporating new sources discovered by INTEGRAL and other high-energy satellites. In this paper, we describe all the sources included in the INTEGRAL Reference Catalog at the end of June 2003, except those sources discovered by INTEGRAL.
All the sources in the INTEGRAL Reference Catalog are shown in Figure 1 in Galactic coordinates. Size and color of the symbol indicate approximate fluxes and spectral hardness.
2 Method of selecting sources
The idea behind the INTEGRAL Reference Catalog is to put all sources which are possibly detected and identified by INTEGRAL. Corresponding to the expected sensitivity and energy range of INTEGRAL, we select sources that are, or have been at least once, brighter than 1 mCrab in any energy band from 3 keV to 8000 MeV (energy range covered with JEMX, IBIS and SPI). Thus, for example, historic X-ray novae are included even if they are expected in quiescence when observed with INTEGRAL, since these sources may be detected when brightened. In addition, we include all the EGRET sources in Macomb and Gehrels (1999) even if they have never been detected in the INTEGRAL energy band.
We took all the sources in the following catalogs.
-
•
High-mass X-ray binary catalog by Liu et al. (2000).
-
•
Low-mass X-ray binary catalog by Liu et al. (2001).
-
•
Gamma-ray sources catalog by Macomb and Gehrels (1999).
-
•
The 4th Uhuru catalog by Forman et al. (1978).
-
•
HEAO1 A4 catalog by Levine et al. (1984).
-
•
BATSE observation of the Piccinotti’s sample AGNs.
-
•
ASCA AGN data from the Tartarus database (http://tartarus.gsfc.nasa.gov).
-
•
IAUC circulars until June 30, 2003.
3 Information included in the catalog
The INTEGRAL Reference Catalog is published in the electronic form together with the present paper. It is an ASCII file written in the LaTeX tabular form, so that readers can run LaTeX and easily print. Since column entries are formatted with fixed-width columns, the file is legible even in the original ASCII format.
The catalog is also available in the html version and FITS version from the ISDC web-site (http://isdc.unige.ch). The FITS version of the catalog is used in the actual QLA operation and INTEGRAL data analysis. In the html version, the source name and the position reference is hyper-linked to its corresponding page in SIMBAD and ADS, respectively.
The following is an explanation of each column in the catalog:
-
•
Catalog source number
-
•
Source name:
Often there are two or more names commonly used for the same source. We take the name which we consider most popular in high-energy astrophysics and is also used as a SIMBAD source identifier. Thus, users can directly put the source name into the SIMBAD query box. -
•
Right Ascension and Declination in J2000 coordinates:
These are given in “hh mm ss.s” and “deg arcmin arcsec” format, respectively. In most cases, positions are taken from SIMBAD. From time to time, however, we found and adopted a more recent position determination than SIMBAD. Accuracy depends on individual sources, which is reflected in the representation of the source positions. For example, an Uhuru source 4U 113014 has the source position (11 33, 14.9), namely, no accuracy of arcseconds in Uhuru. -
•
Galactic coordinates
-
•
Reference for the position determination:
This is for readers who need to know the position accuracy and/or position determination method. Often SIMBAD gives the source position reference as well as the position itself, in which case we take both. Otherwise, we searched for proper references by ourselves. -
•
Spectral Model and Model Parameters:
We put a “typical” spectral model and model parameters, including the model normalization. We follow the XSPEC (Arnaud 1996; http://xspec.gsfc.nasa.gov) format for definition of the models and model parameters. See Section 4 for details. -
•
Energy fluxes:
Energy fluxes are in ergs s-1 cm-2 and are calculated from the assumed spectral models for several energy bands. We take typical JEMX soft and hard energy bands (3–10 keV and 10–30 keV), and ISGRI soft and hard bands (20–60 keV and 60–200 keV). -
•
JEMX, ISGRI counting rates:
Using the nominal detector responses, expected JEMX and ISGRI counting rates are calculated for the soft and hard energy bands indicated above. In the actual QLA operation, JEMX and ISGRI source counting rates are measured in these energy bands to compare with the catalog. The following calibration files, most recent ones in July 2003 (but still based on pre-launch calibration), are used in this calculation: jmx2_rmf_grp_0003.fits for JEMX and isgr_rmf_grp_0005.fits and isgr_arf_rsp_0002.fits for ISGRI.After the launch of INTEGRAL, the pre-launch estimate of the JEMX effective area was revealed to be overestimated by a factor of (P. Kretschmar, private communication). Therefore, we divided the JEMX counting rates calculated using the aforementioned responses by a factor of two. This prescription has been confirmed to be valid from simultaneous INTEGRAL–XTE observations of 3C 273 (Courvoisier et al. 2003b) and Cyg X-1 (Pottschmidt et al. 2003).
For ISGRI, actual observations of Crab pulsar ane other sources confirmed that the pre-launch estimate of the effective area was more or less correct (within % or so).
-
•
Name aliases:
Since there are many varieties of sources, we do not have a consistent rule to decide which aliases to choose. However, we try to put at least one alias directly related to high-energy satellites and/or catalogs. For example, “4U” for 4th Uhuru catalog (Forman et al. 1978), and “2EG” for second EGRET source catalog (Thompson et al. 1995). -
•
Comment on the nature of the source:
Such as low-mass X-ray binaries, high-mass X-ray binaries, Seyfert-1 galaxy, etc.
4 Method to determine the spectral models and fluxes
Except for a small number of sources which are known to be invariable, it is hardly possible to put a single “typical” spectral model for each source to represent its energy spectrum from 3 keV to 8000 keV, In practice, however, we only require rough estimates of the source fluxes for the INTEGRAL QLA operation, in which we want to detect only the very significant flux variations of more than a factor 10 with JEMX and ISGRI in 3 to 200 keV. This means that the requirement of the flux estimate in our catalog can be as loose as a factor 10 in 3 to 200 keV, which we believe is more or less achieved.
The published catalogs we use provide source fluxes in a very inhomogeneous set of energy bands and units. In order to use this information in our catalog, it is essential to harmonize the available data in the published catalogs. For isolated pulsars (including the Crab pulsar) which are known to be invariable and well approximated with power-law spectra, we adopt the known power-law slopes and normalizations. For other sources, we take a typical spectral model to describe the emission for a class of sources (Table 1), and adjusted only the normalization of the model for each source using the published data. We use the spectral models that are appropriate for the most probable state of any given source (for example, “low” state for Cyg X-1). For X-ray novae, on the other hand, we use the published fluxes obtained when the source is bright. Often there are two or more flux measurements for a given source in the same state; in such a case we adopt the average normalization which best fits all the available measurements.
| Source category | model | 1 | 2 | or † | ||
| ( cm-2) | [keV] | [keV] | ||||
| X-ray binaries | ||||||
| LMXB | wabs*cutoff | 1.0 | 1.7 | – | 5 | – |
| LMXB with hard-tail | wabs*(cutoff+powerlaw) | 1.0 | 1.7 | 2.5 | 10 | – |
| HMXB | wabs*highecut*powerlaw | 1.0 | 1.0 | – | 10 | 15 |
| AGN | ||||||
| Seyfert 1 | wabs*cutoff | 1.0 | 1.7 | – | 100 | – |
| Seyfert 2I | wabs*cutoff | 10.0 | 1.7 | – | 100 | – |
| Blazar | wabs*cutoff | 1.0 | 1.7 | – | 100 | – |
| Quasar | wabs*cutoff | 1.0 | 1.7 | – | 100 | – |
| Clusters of Galaxies | wabs*cutoff | 1.0 | 1.7 | – | 10 | – |
| Unidentified | ||||||
| X-ray sources | wabs*cutoff | 1.0 | 1.7 | – | 10 | – |
| COMPTEL sources | wabs*bknpower | 100 | -1.5 | 2.1 | – | 1000 |
| EGRET sources | wabs*bknpower | 100 | -1.5 | 2.1 | – | 10000 |
| † for highecut model and for bknpower model. | ||||||
5 Discussion
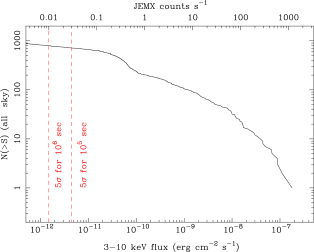
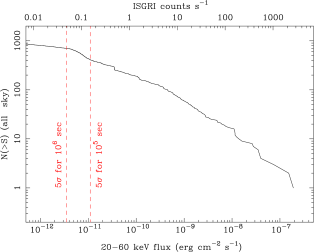
In Figure 2, we show curves of the sources in our catalog in 3 – 10 keV and 20 – 60 keV, as well as corresponding JEMX and ISGRI counting rates and sensitivities. The sensitivities are calculated based on the pre-launch estimates available in the IBIS and JEMX Observer’s Manual, Issue 1.
Thanks to the large field of view and dithering strategy, INTEGRAL observations cover vast regions of the sky (IBIS bottom-to-bottom field of view is ). Thus the entire sky is expected to be covered during the INTEGRAL mission life, at least with sec, which is a standard exposure time. For the Galactic plane region, at least sec of exposure is expected because of the Galactic center and plane survey core programs. In Figure 2, we show 5 detection limits for and sec exposures, respectively. Since our catalog is not complete, we see flattening of the curves at around the INTEGRAL detection limit, more conspicuously in JEMX. In any case, our catalog includes and sources, respectively, which are brighter than the JEMX and ISGRI sensitivities with sec exposure. We may expect to detect still more sources, which may be transient, or dim persistent sources because of the incompleteness of the catalog. Also, initial operation of ISGRI has already detected several heavily absorbed, transient Galactic sources (e.g, IGR J163184848 see Walter et al. 2003 and references therein), which may not have been noticed previously below 10 keV, but may be discovered with INTEGRAL.
Note that our catalog was made by combining observations of many different instruments; not a single satellite has observed so many sources above 20 keV. One of the main purposes of INTEGRAL is to create a homogeneous and most complete high-energy source catalog above 20 keV.
Acknowledgements.
We acknowledge all the INTEGRAL team members who gave comments to improve early versions of the INTEGRAL reference catalog. This research has made use of the SIMBAD database operated at CDS (Strasbourg, France), NASA’s Astrophysics Data System Service, the High Energy Astrophysics Science Archive Research Center (HEASARC) provided by NASA’s Goddard Space Flight Center, and the TARTARUS database supported by Jane Turner and Kirpal Nandra under NASA grants NAG5-7385 and NAG5-7067. We thank Dr. Peter Kretschmar for the information on the latest JEMX effective area calibration.References
- (1) Arnaud, K.A., 1996, Astronomical Data Analysis Software and Systems V, eds. Jacoby G. and Barnes J., p17, ASP Conf. Series volume 101.
- (2) Courvoisier, T.J.-L., Walter, R. Beckmann, V. et al. 2003a, A&A, in this volume
- (3) Courvoisier, T.J.-L., Beckmann, V., Bourban, G. et al. 2003b, A&A, in this volume
- (4) Forman, W., Jones, C., Cominsky, L. et al. 1978, ApJS,182,489
- (5) Macomb, D. J. and Gehrels, N. 1999, ApJS, 120, 335
- (6) Levine, A. M., Lang, F. L., Lewin, W. H. G. et al. ApJS, 54, 581
- (7) Liu, Q. Z., van Paradijs, J. and van den Heuvel, E. P. J., 2000, A&AS, 147, 25
- (8) Liu, Q. Z., van Paradijs, J. and van den Heuvel, E. P. J. 2001, A&A, 368, 1021
- (9) Malizia, A., Bassani, L., Zhang, S. N. et al. 1999, ApJ,519,637
- (10) Pottschmidt, K., Wilms, J., Chernyakova, M. et al. 2003, A&A, this volume
- (11) Thompson, D. J., Bertsch, D. L., Dingus, B. L. et al. 1995, ApJS, 101, 259
- (12) Walter, R., Rodriguez, J, Foschini, L. et al. 2003, A&A, in this volume