The Nature of Near-UV Selected Objects in the Chandra Deep Field South 111Based on observations taken with the NASA/ESA Hubble Space Telescope, which is operated by the Association of Universities for Research in Astronomy, Inc. (AURA) under NASA contract NAS5-26555 and on observations collected at the European Southern Observatory, Chile
Abstract
We present the first results of the pure parallel near-UV observations with WFPC2 in the Chandra Deep Field South. The main goal is to search for the population of objects that contribute to the rise in the volume-averaged star formation rate at intermediate redshifts (z1). A total of 34 objects, were identified in the WFPC2 images and their counterparts found in the ACS images. We use template fitting of the spectral energy distributions to classify the objects and found that 17 are starbursts, 9 are late-type, 2 are early-type galaxies, and 6 are stars; two of the late-types and one of the starbursts are X-ray sources. The colors of the starbursts were reproduced by the stellar evolutionary synthesis code Starburst99 which shows a mixed population of bursts with ages 1 Gyr. Analysis of the light concentration, asymmetry and clumpiness, shows that this sample is a mixed bag, containing dwarf ellipticals, early and late-spirals and peculiar objects which resemble mergers in progress.
1 Introduction
A major goal in modern extragalactic astronomy is to understand how the Universe of galaxies has evolved with cosmic time. The rise in the volume-averaged star-formation rate at intermediate redshifts (0z1) is often attributed to a disk epoch when gaseous galactic disks are converting into stars (e.g. Madau et al. (1996); Roche et al. (1998); Lilly et al. (1998)). The fate of these galaxies is unknown. They could either fade away and would not be seen at z=0 or merge to form larger systems. In either case, they are experiencing strong star formation at intermediate-z and going through an important phase in galaxy evolution when star formation rate was higher than that for the local universe. Little is known of the nature of these objects, since deep, high resolution images are required to analyze their properties. Most of what is known comes from the Hubble Deep Field project (Williams et al., 1996, 2000) which has detected thousands of galaxies at intermediate to high redshifts. However, the small sizes of the fields translates to a relatively small effective volume at z1, limiting the ability to probe the evolution of UV-bright objects at moderate redshifts. The Advanced Camera for Surveys (ACS) aboard HST has started to improve this situation covering a larger field-of-view than WFPC2 with higher resolution.
Ultraviolet (UV) light from hot, high-mass stars dominates the spectral energy distribution of galaxies going through strong star formation, also known as starbursts. The UV light can be observed directly from space or indirectly in the infrared as the dust reprocesses the UV starlight and re-emits it in the infrared. The UV observations probe unobscured star formation (see Windhorst et al. (2002) for an HST survey of mid-UV morphology of nearby galaxies), therefore, observing in the UV directly accesses the population of objects that contribute to the rise in the star-formation rate at intermediate-z. Knowing the properties of these UV sources is also important when analyzing high-z galaxies because optical observations of high-redshift galaxies measure the rest-frame UV. In this Letter we report the first results of a survey designed to study the the UV sources by using the HST/WFPC2 (F300W) in combination with the HST/ACS multi-wavelength images.
2 Observations and Reduction
We implemented a WFPC2 pure parallel program aimed at maximizing the synergy between the parallels and the prime proposals of HST. For parallel fields that fell within the Great Observatories Origins Deep Survey (GOODS) fields, we took near-UV images with the F300W filter (U band) of galaxies that have been imaged at redder wavelengths with ACS. More details regarding the ACS data are given in Giavalisco et al. (2003) in this issue.
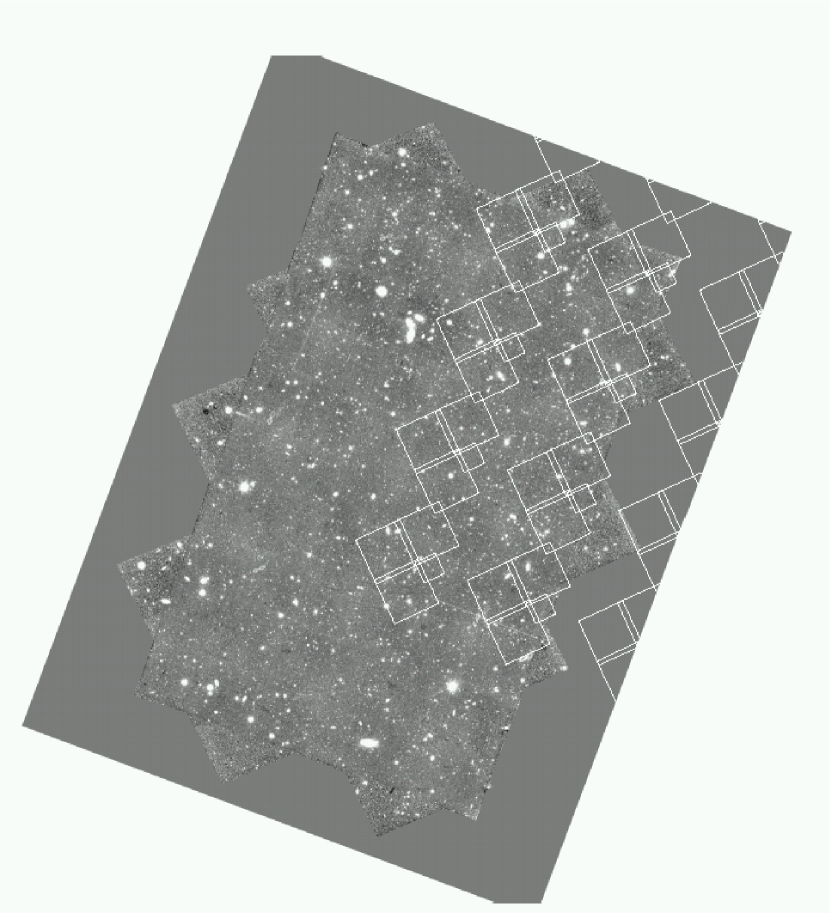
In this Letter we present preliminary results from this program, and discuss the sample that was selected from the WFPC2 data taken during HST/ACS first visit of the Chandra Deep Field South. Fig.1 shows the area observed on top of the ACS mosaic and the 8 WFPC2 images which were analyzed. The program continued through the later epochs and in the northern field, and those data will be discussed in future papers.
WFPC2 images were reduced using the HST pipeline and dithered using the package PyDrizzle which provides an automated method for dither-combining and distortion-correcting images. The quality of the drizzled image was checked by analyzing the PSF of a few stars present in some of the images.
3 Sample Selection and Gallery of Objects
We detected sources on the U-band image using SExtractor v2.2.2 (Bertin et al. (1996), hereafter SE). Our detection criterion was that a source must exceed 1.5 sky threshold in 5 contiguous pixels and we also use a detection filter with a Gaussian FWHM of 4 pixels. A total of 58 objects were identified by SE. Their magnitude range is 18mU26 where mU (AB system) is SE’s mag-auto, which is calculated using a flexible elliptical aperture around every detected object. These numbers agree with what is expected with the U band (6 objects in 2 to 3-orbit exposure). For comparison, the HDF project included a long (45 orbit) U exposure and has 133 objects with 23.5mU25 (Vega system, Metcalfe et al. (2001)).
The next step was to match the U-band catalog with the ACS B-band catalog (B435) produced by the GOODS team. We adopted a maximum offset radius of 1.5 arcsec between the WFPC2 coordinates and the ACS B band, and identified a total of 34 objects. The remaining objects are either spurious detections or outside the ACS field. Most of the 34 objects identified are in 4 of the WFPC2 images with larger exposure times (4320s, 6320s, 7420s, 7620s). From visual inspection we were able to identify 7 point-like objects in the sample which were further investigated using the SIMBAD database. SIMBAD finds at least one star within 10 arcsec of six of the point-like objects and one QSO. The six point-like objects identified as stars were removed from the analysis. In Section 5 we discuss the object identified as a QSO in more detail.
We constructed a gallery of images including the WFPC2 U band, and ACS B, V, i, z images which is available on-line 222http://goods.gsfc.nasa.gov/goods/duilia/gallery/. The gallery also includes other parameters such as coordinates, links to the SIMBAD identifications, spectral types, structural parameters and photometric redshifts which are described below.
4 Photometric Redshifts, Spectral Types
Photometric redshifts were estimated by the GOODS team using the Bayesian photometric redshift method (Benitez, 2000) which includes templates of the spectral energy distribution of E, Sbc, Scd, Im (Coleman et al., 1980), and two starbursts (Kinney et al., 1996) – below we refer to these as spectral types 1 to 6. The uncertainties estimated from comparison with ground based spectroscopy are (. The redshift distribution of the 28 objects in the U catalog peaks at redshift 1 (Fig. 2). The WFPC2 data were not included in the photometric redshift estimation due to large photometric errors in comparison to ACS photometry.
Aperture magnitudes (diameter=2′′) in the HST filter system were calculated using SE. These were transformed into absolute magnitudes in the Johnson (1966) filter system by adding distance modulus and appropriate K-corrections. The K-corrections were calculated using information on filter transmission curves for both systems, spectral shape of the object (i.e., the best-fitting spectral energy distribution) and the photometric redshifts. Absolute magnitudes are obtained using the cosmological model h=0.7, =0.7, =0.3.
5 Starbursts and AGNs
We investigated the morphology and colors of the sample. The spectral types obtained from the photometric-z estimation were used to separate the sample into starbursts and non-starbursts. Starbursts have SED similar to the starbursts in Kinney et al. (1996). In this Letter galaxies called starbursts are unobscured by dust, however the non-starburst sample may include dust obscured starbursts.
In Fig.3 we have separated the starbursts from non-starbursts (filled symbols are galaxies with spectral types 4, i.e. starbursts) and have added starbursts colors generated with the evolutionary synthesis code Starburst99 (Leitherer et al. (1999), see also de Mello et al. (2000)). Models of the emission from starburst stellar populations were calculated as a function of age, with a Salpeter initial mass function (IMF), and stellar evolutionary tracks of solar metallicity. We used a continuous star formation law at a constant rate (1 solar mass per year) over 10 Gyr. Extinction of E(B-V)=0.2, 0.25, 0.3, 0.35 and a Calzetti law (Calzetti et al., 2000) was applied to the model. Dust absorption reddens B-R more than U-B and a moderate extinction correction is able to reproduce the colors of most galaxies. Starbursts are closer to the young ages ( Gyr) of the models whereas non-starbursts have colors compatible with older population; except for one object which has a very low B-R. This object, although classified as Scd, is a peculiar galaxy with a double nucleus. Peculiar galaxies have a greater spread of values in two-color plots than morphologically normal galaxies due to the great diversity in their star formation history Larson and Tinsley (1978). We have not made any attempt to correct the colors of the models for nebular line emission. Models including stellar light, nebular continuum emission, and nebular line emission have been shown in Johnson et al. (1999), where it is clear that some of the broadband colors are strongly affected at ages 100 Myr.
We investigated the 3 objects which are much bluer (U-B0) than the models in more detail. These objects have very low photometric redshifts (z0.04) with high uncertainties and could be in the range 0z0.2. A higher redshift could shift their colors by at least 0.3 which will make their colors more typical of starburst galaxies (see morphology section for more details on these objects). The bluest non-starburst galaxy is a very peculiar late-type galaxy and it is probably an obscured starburst.
We also checked the two galaxies with photometric redshifts of z=1.9 and 2.6. The uncertainties in the photometric redshift of the first object is extremely high and there is almost no constraint in the phot-z determination. The 95% confidence interval is between z=0.01 and 2.28. The second object has also high uncertainty in the phot-z but not as high as the previous one with 95% confidence interval of having 1.95z3.07. Although their colors are not used in the analysis, they were kept in the sample and flagged as triangles in all plots.
We also searched for AGN in the sample. Three objects in the U-band sample have X-ray emission (see Koekemoer et al. 2003 in this issue). We adopted 3.0 arcsec as the maximum offset radius between the U and the ACS z-band coordinates. These objects are flagged as squares in all plots and are shown in the gallery. Visual inspection of the three X-ray sources shows that one of them is a point-like object and the other two are late-type galaxies. The point-like object is one of the most powerful CXO sources (Giacconi et al., 2002) in the entire ACS field (Soft X-ray flux=4.00e-14 4.69e-16 and Hard X-ray flux 8.06e-14 1.65e-15), it is a TypeI AGN (Schreier et al., 2001). The other two objects are extended and have total X-ray (0.2-8keV) fluxes 1.77E-16 and 2.66E-16 erg/s/cm2 which are three orders of magnitude lower than the TypeI AGN (1.15E-13). The object with the lowest X-ray flux has a spectral type typical of starbursts and peculiar late-type morphology. The third object has a spectral type similar to intermediate-late spirals.
6 Morphology
Galaxy morphology was evaluated by measuring the light concentration (C), asymmetry (A) and clumpiness (S) of the ACS images in the rest-frame B band using the method by Conselice (2003), hereafter CAS. Early-type galaxies are expected to have a high concentration index and low asymmetries whereas late-type (disks) galaxies have low light concentration and high asymmetries. As suggested by Conselice et al. (2000), a correlation between asymmetry and color can be seen for most of Hubble types and outliers which are too asymmetric for their colors are probably dynamically disturbed. This is true for the near-UV sample, as evident in Fig.4. The non-starburst galaxy (spectral type 1.67) with the highest concentration index is also the reddest and the least asymmetric. The non-starburst galaxy (spectral type 3.33) with the highest asymmetry value is a spiral galaxy showing tidal effects. The two starburst galaxies with the highest asymmetry values are also peculiar, but are in a more advanced stage of interaction than the previous one. In Fig.4 we plot the typical values of U–B for templates of E (diagonal cross), Sab (star), and Scd (pentagon) (Liu and Green, 1998) and CAS parameters for the same types (Conselice, 2003). The CAS values of the templates should be taken with caution since Conselice uses R-band to estimate them and we are using rest-frame B band. However, the differences between the CAS values using R and B band are small (C=0.12 and A, S=0.03). As it is clear from these figures, the near-UV sample falls in a different area of the plot with the great majority being bluer, having lower concentration indexes and higher asymmetries than the templates. The asymmetry values are typical of starbursts galaxies and ULIRGS (0.530.22 and 0.320.19, Conselice (2003)). A third parameter obtained with CAS measures the patchiness of the light distribution (a.k.a. clumpiness) and is shown in Fig. 4 top diagram. Most of the galaxies have clumpiness similar to the templates. The three objects with S0.6 have distorted morphologies with A0.4.
The three parameters together are good evaluators of the morphologies and were used to investigate the three blue outliers mentioned in the previous Section. Two of them have C and S values typical of dwarf ellipticals (C=2.4, 2.6 and S=0.0) and are as faint as dwarf galaxies (MB=–12.4 and –13.9, IDs 1537 and 764 in the gallery). Visual inspection of these objects confirm these results. The third blue object has higher concentration, asymmetry and clumpiness (3.48, 0.61, 0.31, respectively, ID 2232 in the gallery) than the previous ones. Visually it looks like a merger in progress of two small nuclei in close contact and a third small knot separated by 6 pixels from the brightest nucleus. These examples show the diversity of objects that we are covering in this sample.
We investigated how the CAS parameters of the near-UV sample compares with the values for all galaxies identified in the ACS field (see Mobasher et al. in this issue). There are 1134 galaxies with RAB 24 within 0.24 z 1.3 of which 65% have SEDs typical of late-types (C=2.65 and A=0.27), 21% of early-types (C=3.25, A=0.23) and 14 % of starbursts (C=2.53, A=0.33). The average concentration index of CAS values of the near-UV sample are C=2.630.35 and A=0.35 0.13. The near-UV selected sample is more asymmetric than the average and even the non-starburst of the near-UV sample have higher asymmetry (A=0.30 0.17), although their concentration indexes are more typical of earlier types.
7 Conclusions
We presented a near-UV selected sample of 34 objects which were identified in 8 WFPC2 (F300W) images covering part of the GOODS CDF-S field. Counterparts of all objects were found in the ACS multi-waveband mosaics which were used to classify them according to their spectral energy distributions. A total of 17 were classified as starbursts (1 X-ray source), 9 as late-types (2 X-ray sources) and 2 as early-types. Six stars were removed from the sample. The colors of the starbursts which were reproduced by the stellar evolutionary synthesis code Starburst99 are typical of a mixed population of bursts with ages 1 Gyr. Light concentration, asymmetry and clumpiness were used to analyze the morphology of the UV selected sample. The majority of the galaxies have lower values of light concentration and higher asymmetries than typical early and late-type galaxies. Based on the morphologies we conclude that near-UV sources at intermediate-z originate in a variety of objects: dwarf ellipticals, early- and late-spirals and peculiar objects which resemble mergers in progress. Intermediate redshifts are an important epoch when the rise in the volume-averaged star formation rate occurs. The population of objects that contributes to this rise is not homogeneous, but made of galaxies of different types experiencing strong star-formation.
References
- Benitez (2000) Benitez, N. 2000, ApJ, 536, 571
- Bertin et al. (1996) Bertin, E., & Arnouts, S. 1996, A&AS, 117, 393
- Calzetti et al. (2000) Calzetti, D., Armus, L., Bohlin, R.C., Kinney, A.L, Koornneef, J., Storchi-Bergmannn, T. 2000, ApJ, 533, 682
- Coleman et al. (1980) Coleman, G.D., Wu, C-C., & Wedman, D.W. 1980, ApJS, 43, 393
- Conselice (2003) Conselice, C. 2003, ApJS, (astro-ph/0303065)
- Conselice et al. (2000) Conselice, C., Bershady, M.A., & Gallagher, J.S.III. 2000, A&A, 354, L21
- de Mello et al. (2000) de Mello, D.F., Leitherer, C., & Heckman, T. 2000, ApJ, 530, 251
- Giacconi et al. (2002) Giacconi, R. et al. 2002, ApJS, 139, 369
- Johnson (1966) Johnson, H.L. 1966, ARA&A, 4,193
- Johnson et al. (1999) Johnson, K.E., Vacca, W.D., Leitherer, C., Conti, P.S., & Lipscy, S.J. 1999, AJ, 117, 1708
- Kinney et al. (1996) Kinney, A. et al. 1996, ApJ, 467, 38
- Larson and Tinsley (1978) Larson, R.B, & Tinsley, B.M. 1978, ApJ, 219, 46
- Leitherer et al. (1999) Leitherer, C., et al. 1999, ApJS, 123, 3 (Starburst99)
- Lilly et al. (1998) Lilly, S., et al. 1998, ApJ, 500,75
- Liu and Green (1998) Liu, C.T.,& Green, R.F. 1998, ApJ, 116, 1074
- Madau et al. (1996) Madau, P., Ferguson, H., Dickinson, M., Giavalisco, M.,Steidel, C., Fruchter, A. 1996, MNRAS, 283, 1388
- Metcalfe et al. (2001) Metcalfe, N., Shanks, T., Campos, A., McCracken, H.J.,& Fong, R. 2001, MNRAS, 323, 795
- Roche et al. (1998) Roche, N., Ranatunga, K., Griffiths, R.E., Im, M., & Naim, A. 1998, MNRAS, 293, 157
- Schreier et al. (2001) Schreier, E. et al., 2001, ApJ, 560, 127
- Williams et al. (1996) Williams, R., et al., 1996, AJ, 112, 1335
- Williams et al. (2000) Williams, R., et al., 2000, AJ, 120, 2735
- Windhorst et al. (2002) Windhorst, R. et al. 2002, ApJS, 143, 113