The frequency-dependence of drifting subpulse patterns
Drifting subpulse patterns in pulsar signals are frequently interpreted in terms of a model in which a rotating ring of sparks on the polar cap gives rise to emission from regions of the magnetsophere connected to the sparks by dipolar magnetic field lines. The spacing of drift-bands in time depends on the circulation rate of the polar cap pattern, but to first order the longitudinal phase dependence of the subpulse modulation should obey a frequency-independent relation determined by the geometrical configuration in a similar manner to the polarization position angle. We present here observations at 272–1380 MHz of PSR B0320+39 and PSR B0809+74, both of which show nearly linear drift in two longitude regions, separated by a region of reduced modulation and accompanied by a large step in the phase of the subpulse pattern. We show that the observation of Bartel et al. (1981) that the subpulse spacing for PSR B0809+74 was 1.8 times greater at 102.5 MHz than at 1720 MHz is most likely an artifact of the phase step, which is only present at high frequencies. The phase steps can be understood as a consequence of observing overlapping offset images of the polar cap spark pattern. We also detected more complicated, frequency-dependent behaviour that would require that the images do not simply differ by rotation about their centers. Detailed modelling of non-axisymmetric refraction or distorted magnetic fields is suggested as a means of pursuing an explanation for this phenomenon.
Key Words.:
pulsars:individual:PSR B0320+39, PSR B0809+741 Introduction
It is generally accepted that the radio emission from pulsars is beamed from its points of origin along local tangents to the dipolar magnetic field lines, and that the general broadening of pulsar average profiles with decreasing observing frequency can be understood as a consequence of the divergence of the field lines and the scaling of emission frequency with radial distance from the polar cap (e.g. Komesaroff 1970; Cordes 1978). So fundamental is this so-called radius-to-frequency mapping (RFM) to the usual ways of thinking about pulsar emission, that many authors appear to assume that it will apply to longitudinal subpulse spacing () in the same way that it applies to component separations and average profile width (e.g. Ruderman & Sutherland 1975; Wolszczan et al. 1981; Bartel et al. 1981; Bartel 1981; Izvekova et al. 1993). As noted by Gil & Krawczyk (1996), this is only the case when the line of sight passes directly over the magnetic pole, and the weaker dependence on frequency seen in versus the average profile width reported by Izvekova et al. (1993) and Gil et al. (2002) is just as expected under the usual model of drifting subpulse patterns as manifestations of a grazing pass along the edge of a beam consisting of a ring (“carousel”) of beamlets circulating about the magnetic axis (e.g. Ruderman & Sutherland 1975).
Edwards & Stappers (2002) (ES) showed that if one considers the subpulse pattern as a periodic modulation within any given longitude interval, the phase of the modulation as a function of longitude should be independent of frequency, given a circular pattern of simply shaped sparks (i.e. extended in either magnetic azimuth or latitude but not in both), and neglecting the effects of rotation. This is a consequence of the fact that the transformation between the polar cap pattern and the beam pattern as radiated from a certain height is a simple scaling of the polar opening angle (see Fig. LABEL:fig:cap, top left). The sampling of the polar cap effected at a particular longitude value at different radio frequencies therefore differs in magnetic latitude but not in magnetic azimuth, and for a simple circular carousel this means that the amplitude of the subpulses may differ but their phase does not. Figure LABEL:fig:cap (bottom right) shows the difference between points of zero subpulse phase and points of peak subpulse intensity (between which is measured) for a pair of sight-lines on a sample polar cap configuration. It shows that the variation with frequency of is entirely a consequence of the different amplitude windowing caused by the expansion or contraction of the beam. In contrast, the subpulse phase envelope is unaffected by the different amplitude windowing and its longitude dependence should be describable by a simple geometric formula, independent of frequency (ES). The possibility therefore exists for a strong test of the carousel model by examining the longitude- and frequency-dependence of subpulse phase in much the same way as the now well-accepted geometric polarization model of Radhakrishnan & Cooke (1969) was tested.
![[Uncaptioned image]](/html/astro-ph/0308505/assets/x1.png)
Application of phase-based analysis to PSR B0320+39 has shown that at 328 MHz, subpulse drifting occurs in two distinct longitude intervals, between which there is a phase offset of nearly 180° (Edwards et al. 2003; ESvL). The transition between the regions occurs too suddenly to be fit by the geometric model, and ESvL suggested the phase step reflected a shift in dominance between two superposed, phase-offset images of an underlying rotating subbeam system. If this is the case, in the absence of further complicating factors, the underlying phase envelopes of the two images should exhibit the predicted frequency independence, and any variations in the measured envelope must be due to frequency dependence of the relative amplitudes of the images at any given longitude. If the offset is close to 180°at all longitudes, the phase must always be close to that of the dominant component (at that longitude) and after accounting for phase steps, the prediction of frequency independence can be tested.
Similar behaviour, involving a subpulse phase jump accompanied by reduced modulation in the vicinity of the jump, has been reported at 1720 and 1420 MHz for PSR B0809+74 (Wolszczan et al. 1981; Prószyński & Wolszczan 1986), although the quality of these results is insufficient to strongly constrain the sharpness of the jump, or to probe for other non-linearities and their variation with frequency. Without this information it is difficult to distinguish between the multiple imaging scenario and other possibilites (e.g. Bartel 1981; Davies et al. 1984). To investigate this phenomenon further we have studied PSR B0320+39 and PSR B0809+74 at frequencies between 270 and 1380 MHz.
2 Observations and Analysis
We observed PSRs B0320+39 and B0809+74 using the Westerbork Synthesis Radio Telescope and its pulsar back end, PuMa. The signals from linearly polarized receptors from 14 25-m dishes were decimated into bands of 10 MHz width, added (per-band, per-polarization) according to previously determined phase and amplitude factors, and fed in to PuMa operating in Mode 1, which acts as a digital filterbank; for details see Voûte et al. (2002). In all cases we used a configuration such that both the dispersion smearing within each frequency channel and the output sampling interval were less than or equal to s. In offline processing total intensity samples from all frequency channels were combined according to the appropriate compensation for interstellar dispersion, and where necessary adjacent samples were added to improve the signal-to-noise ratio. Based on the topocentric period predicted using the TEMPO111http://pulsar.princeton.edu/tempo/ software package and published ephemerides, the resultant time-series was re-arranged into a two-dimensional array of pulse longitude and pulse number for further analysis. We made observations with bands centered at 272–302, 328, 382 and 1345–1415 MHz, however for both pulsars, the results were consistent within their respective uncertainties for all frequencies between 272 and 382 MHz, so in addition to the 1380 MHz data, we will present results only from the most sensitive band, which was 328 MHz in both cases.
For pulsar signals that are dominated by a regular drifting subpulse pattern, the method of ES offers the best possible signal-to-noise ratio for the inference of the time- and longitude-dependence of subpulse phase. However, we find that for both pulsars, at 1380 MHz the regular drifting subpulses comprise a relatively minor portion of the total emission, and the time/longitude decomposition fails for this reason. To overcome this, in this work we used an alternative algorithm to ascertain the longitude-dependence of subpulse amplitude and phase (hereafter, the complex “envelope”). Specifically, we divided the pulse series in to -pulse blocks and computed Discrete Fourier Transforms along constant-longitude columns of each block to form a series of complex Longitude-Resolved Fluctuation Spectra (LRFS). If the subpulse pattern is at least strong and coherent enough to dominate over other emission in its peak spectral frequency bin, that row of any given spectrum should differ from that of any other spectrum by a simple complex factor. The phases of these factors were determined by cross-correlation with a template envelope, a new template was formed by adding the peak rows using the measured phases, and the process repeated until convergence. This is essentially a coarse-grained version of the algorithm of ES, and has been shown to produce consistent results in practice (ESvL) for the phase envelope.
The subpulse amplitude envelope derived with this method is typically underestimated since the single Fourier coefficient is not matched to the true response of the signal. To overcome this, we measured the LRF power spectrum as the difference between on-pulse power spectra and off-pulse (noise) spectra, and estimated the variance of the subpulse-modulated part of the signal as the sum of power spectral values in a narrow range of frequencies around the peak response (Parseval’s Theorem). Assuming the subpulse signal has a similar amplitude distribution to that of a sinusoid, we then took the value where is the variance as an estimate of the typical height of subpulse peaks above the mean in the given longitude bin. As expected, for low-frequency observations (where the subpulse signal dominates) the full time/longitude decomposition method (ES) gave a result consistent with this method.
3 Results and Discussion
3.1 PSR B0320+39
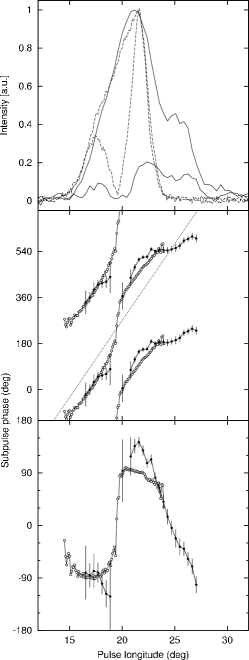
The average profiles and subpulse amplitude and phase envelopes for PSR B0320+39 at 328 MHz and 1380 MHz are shown in Fig. 2. We used the same observation as ESvL at 328 MHz, and the results are consistent within the noise (despite using different techniques). A sharp jump in subpulse phase is accompanied by an almost complete attenuation of subpulse amplitude, consistent with destructive interference between two offset drift patterns with differing longitudinal amplitude dependences. The presence of an additional component was the motivating factor for examining the subpulse properties at high frequency, with the prediction that it should be preceded by another jump to align it with the extrapolation of the subpulse phase envelope in the leading part of the profile. The extra component is clearly detected here, as is its subpulse modulation (Fig 2 left, longitude °). However, the phase envelope differs from the prediction, and tends towards almost stationary modulation in the trailing component. Moreover, the sharp jump seen at 328 MHz (longitude °) is apparently reduced to a smoother transition of the opposite sense (seen most clearly in the middle panel). The envelope resumes approximately the same phase evolution as the 328 MHz profile after the jump, until it is disturbed by the extra component (longitude °). Clearly, the situation is not as simple as the superposition of two rotating subbeam systems offset purely in magnetic azimuth, as earlier suggested.
3.2 PSR B0809+74
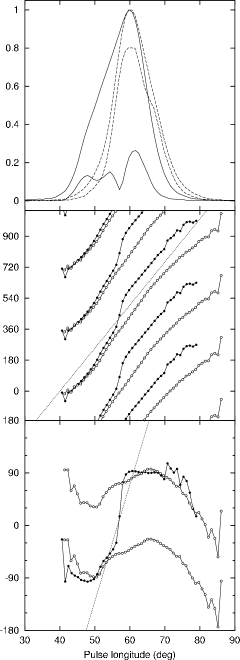
The average profiles and subpulse amplitude and phase envelopes for PSR B0809+74 at 328 MHz and 1380 MHz are shown in Fig. 2. Beginning with the 328 MHz result, we see that the subpulse phase envelope is not as steep at the edges compared to other longitudes, consistent with the expectations of the carousel model. However, the high sensitivity of the data reveals that the phase behaviour is more complicated than the smooth cubic-like forms allowed on basic geometric grounds (ES). The 1380 MHz phase envelope shows similar variations in subpulse phase in the leading part of the profile, but exhibits a striking jump in subpulse phase in the middle of the profile, confirming earlier results of lower longitude resolution (Wolszczan et al. 1981; Prószyński & Wolszczan 1986). The shape of phase envelope in the trailing part of the profile also approximately matches that seen at low frequencies, with an offset of in relative phase compared to the leading part. Both the large phase jump, and the smaller jump or steepening around 52° longitude correspond to local minima in the subpulse amplitude envelope, suggesting in our view a similar interpretation to the phase offset in PSR B0320+39: the presence of superposed, out-of-phase drift patterns with differing longitudinal amplitude dependences. The cumulative effect of both phase jumps is seen to be approximately °, and could be explained as the consequence of receiving rays from opposite sides of the magnetic axis, as invoked for PSR B0329+39 (ESvL). However, in this case the but the presence an additional “image” of the carousel pattern, offset by some amount other than 180°, is required to explain the peak in subpulse amplitude around 55 longitude, and intermediate phase seen in the region. We confirmed numerically that the major features of the complex subpulse envelope can reproduced using three overlapping Gaussian components with relative phases of 0, 35 and 180°. However, we note that this should only be taken as an indication of the general suitability of this picture, and not a solution for this specific set of relative phase values, for there is considerable room for different relative phases given different component shapes and/or a non-linear underlying phase function under various potential viewing geometries.
These results are consistent with those of previous studies, although for reasons outlined in the Introduction, we reach somewhat different conclusions. A major result of Bartel et al. (1981) was that the overall drift rate differed by a factor between 102 and 1720 MHz, a fact which they used to argue that the entire profile should be scaled in longitude by this factor to correct for RFM. Performing this scaling results in a significantly wider profile for 1720 MHz than 102 MHz, on which basis it was argued that some emission was “missing” at 102 MHz. For reasons noted by Gil & Krawczyk (1996) and reiterated in the Introduction to this work, RFM under the carousel model is not expected to alter the observed value the by same factor as the profile width, so the scaling performed by Bartel et al. (1981) is not valid. Indeed, the value of is expected to vary relatively little, making the observed factor of 1.8 somewhat unexpected. However, the phase jump in the middle of the profile at 1720 MHz provides the obvious explanation for this fact. Specifically, most pairs of subpulses in a given pulse will lie on opposite sides of the phase jump and will thus appear closer together than expected without the phase jump. Any method of measurement relying on the longitudinal separation of subpulse peaks, including the autocorrelation method of Bartel et al. (1981), will be subject to this distortion. The dotted line in the bottom panel of 2 depicts the drift rate inferred by Bartel et al. (1981), which can clearly be seen to represent a kind of interpolation between the phases at the peaks of the offset components we find at 1380 MHz. The drift rate measured at 102 MHz would correspond to a horizontal line in this plot, confirming that there is no major evolution in the drift rate between 102 and 328 MHz. We therefore argue that the factor of 1.8 reported in subpulse spacing between 102 and 1720 MHz is almost entirely due to the effect of the phase offset and amplitude windowing.
|
|
Some apparently anomalous results of Davies et al. (1984) also receive explanation from factors discussed in this work. Davies et al. (1984) state that their observation that the drift rate at 408 MHz is 1.5 times faster near the profile edge edge is unexpected, and may be caused by a non-dipole magnetic field. In fact, under the carousel model faster drifting is expected at the profile edges (ES; see also Fig. 1 this work). We suspect that the confusion arose due to the reciprocal relationship between “drift rate” (i.e. longitude displacement per time interval) and the longitudinal rate of change of subpulse phase (i.e. phase or time displacement per longitude interval). We also note that the drift speed measured by Davies et al. (1984) at 408 MHz actually increases monotonically with longitude, the asymmetry of which is not consistent with the model, with or without the noted misconception. In any case, we have shown here that the phase envelope is considerably more complicated than this, and yet the reduced slopes at the profile edges indicate potential consistency with the carousel model if offset multiple imaging is allowed. The monotonic trend seen by Davies et al. (1984) probably has more to do with the perturbations between subpulse peaks and true points of zero phase imposed by the overall amplitude windowing than with the underlying phase variations.
Another result of Davies et al. (1984) is that the subpulses at 1412 MHz apparently arrive 10–18 ms earlier than those at lower frequencies (after compensating for interstellar dispersion). Comparison of their Figures 2 and 4 with Fig. 2 confirms that the offset subpulses they recorded appeared where our proposed alignment indicates a 120 phase offset. This corresponds to a vertical shift of periods in Fig. 4 of Davies et al. (1984), consistent with their measurement between and MHz, made with absolute time alignment. We may therefore conclude that our phase alignment is correct and that high-frequency subpulses in the leading part of the profile are not offset from those at low frequencies.
3.3 Implications for Models
The subpulse phase envelopes measured for PSR B0320+39 and PSR B0809+74 are clearly not consistent with the smooth, symmetrical curves predicted by simple rotating subbeam models. Moreover, they are seen to evolve strongly with frequency, and to exhibit sharp “jumps” in subpulse phase.
Further evidence for departure from the predictions of a simple carousel model also exists in the literature. Hankins & Wolszczan (1987) found support for the carousel model in their detection of systematic subpulse drift in three pulsars with “triple” profile morphologies. However, the subpulse phase envelopes presented for PSR B1918+19 clearly show a reversal in the sense of subpulse drift in the trailing component. Under the carousel model, points of sense reversal correspond to pulse longitudes where the line of sight is at its furthest excursions in the magnetic azimuth coordinate. For this to occur within the emission beam requires the angle between the spin axis and the observer to be comparable to the opening angle of the beam, which would result in a very broad pulse profile ( 180°). This is not the case for PSR B1918+19. Indeed, given the narrow width of pulsar beams, unless there is a trend toward alignment of spin axes and magnetic axes, such configurations should be very rare in the observable population, and sense reversals in general can be taken as evidence against the presence of a simple rotating subbeam system.
The clear cases of step-like features accompanied by reduced modulation amplitude, seen in PSR B0320+39 and in PSR B0809+74 at high frequencies, are suggestive of the presence of superposed subbeam patterns that rotate together (e.g. as “images” of the same spark system) but are offset in the azimuthal coordinate (ESvL). We believe that a similar effect can explain the less ordered drift behaviour seen at other frequencies in these pulsars, and most likely that of PSR B1918+19 also. For this to be the case, the phase envelopes of the component images cannot be related by a constant phase offset, requiring the corresponding subbeam patterns to have offset centroids, or different (non-circular) shapes. To the extent that the subbeam motions deviate from concentric circular motion in this way, the use of subpulse patterns to determine geometric parameters (Deshpande & Rankin 1999; ES) or to “map” the polar cap excitation pattern (Deshpande & Rankin 1999) is not possible until the transformations effected in the images are determined, or the phase envelope is shown to be consistent with a single rotating pattern.
An obvious mechanism to which to appeal is the transformation to the observer’s frame, which includes aberration and retardation. The approximate effect of these is to differentially shift the beam patterns in the pulse longitude coordinate. However, as noted by ESvL, this requires that the two images be emitted at points separated by km, in conflict with the current consensus concerning emission altitudes. Likewise, an altitude difference of km is needed to explain the 120° phase offset seen in here PSR B0809+74 using the combined effects of retardation and aberration.
Another possible explanation of the deviations observed is that the magnetic field is not dipolar. Davies et al. (1984) proposed such a condition to explain the frequency evolution of the pulse profile of PSR B0809+74, and the offset nature of subpulses at high frequencies. Clearly this simple picture cannot now suffice, since a combination of offset and not offset subpulses appears to be present. Perhaps, by attributing the multiple images to multiple discrete emission heights, some progress might be made with this model.
Allowing for refraction eases the problems by opening the possibility of a secondary beam due to rays that cross the magnetic axis (ESvL). However, to produce offsets other than 180, symmetry-breaking effects are needed. In this sense, three-dimensional refraction calculations with full treatment of the effects of rotation on the plasma density and flux distribution, and retardation and aberration, should be seen as an essential next step in the understanding of pulsar magnetospheres.
Acknowledgements.
We thank the staff of WSRT for their efforts in obtaining measurements at 272 MHz. The WSRT is operated by ASTRON with financial support from the Netherlands Organisation for Scientific Research (NWO). RTE is supported by a NOVA fellowship.References
- Bartel (1981) Bartel, N. 1981, A&A, 97, 384
- Bartel et al. (1981) Bartel, N., Kardashev, N. S., Kuzmin, A. D. Nikolaev, N. Y., et al. 1981, A&A, 93, 85
- Cordes (1978) Cordes, J. M. 1978, ApJ, 222, 1006
- Davies et al. (1984) Davies, J. G., Lyne, A. G., Smith, F. G., et al. 1984, MNRAS, 211, 57
- Deshpande & Rankin (1999) Deshpande, A. A. & Rankin, J. M. 1999, ApJ, 524, 1008
- Edwards & Stappers (2002) Edwards, R. T. & Stappers, B. W. 2002, A&A, 393, 733
- Edwards et al. (2003) Edwards, R. T., Stappers, B. W., & van Leeuwen, A. G. J. 2003, A&A, 402, 321
- Gil et al. (2002) Gil, J., Gupta, Y., Gothoskar, P. B., & Kijak, J. 2002, ApJ, 565, 500
- Gil & Krawczyk (1996) Gil, J. & Krawczyk, A. 1996, MNRAS, 280, 143
- Hankins & Wolszczan (1987) Hankins, T. H. & Wolszczan, A. 1987, ApJ, 318, 410
- Izvekova et al. (1993) Izvekova, V. A., Kuz’min, A. D., Lyne, A. G., Shitov, Y. P., & Graham Smith, F. 1993, MNRAS, 261, 865
- Komesaroff (1970) Komesaroff, M. M. 1970, Nature, 225, 612
- Prószyński & Wolszczan (1986) Prószyński, M. & Wolszczan, A. 1986, ApJ, 307, 540
- Radhakrishnan & Cooke (1969) Radhakrishnan, V. & Cooke, D. J. 1969, Astrophys. Lett., 3, 225
- Ruderman & Sutherland (1975) Ruderman, M. A. & Sutherland, P. G. 1975, ApJ, 196, 51
- Voûte et al. (2002) Voûte, J. L. L., Kouwenhoven, M. L. A., van Haren, P. C., et al. 2002, A&A, 385, 733
- Wolszczan et al. (1981) Wolszczan, A., Bartel, N., & Sieber, W. 1981, A&A, 100, 91