11email: skinner@cesr.fr 22institutetext: University of Birmingham, Edgbaston, Birmingham, B15 2TT, England
The Spiros imaging software for the Integral SPI spectrometer
A key tool in the package of software available for the analysis of data from the SPI spectrometer of Integral is the SPIROS system developed at the University of Birmingham. Although intended primarily for the analysis of point sources and for the extraction of spectral information, SPIROS has many additional capabilities. The software is described with particular emphasis on the most widely used modes of operation and on the relationship to other imaging and data reduction techniques.
Key Words.:
Coded masks – Imaging – Software1 Introduction
Astronomical images are often of fields consisting of (or at least dominated by) a number of sources which are essentially points. Their angular size is much smaller than the resolution of current instrumentation - frequently by a factor more than . At gamma-ray energies the number of such sources is usually small. In these circumstances the model with a minimum number of parameters that is consistent with the data will consist of a list of the positions of those sources with their intensities. For an instrument with spectroscopic capabilities like INTEGRAL/SPI, a description of the variation of those intensities with photon energy, and perhaps with time, must be added. In general it is when a minimum number of parameters is sought that each of these may be obtained with the highest precision111We note that in a certain sense, this is a ‘minimum information/maximum entropy’ interpretation of the data - it can be stored or transmitted with a small number of bits and hence very high informational entropy as defined by Shannon Shannon (1966), so in these circumstances point source searching and fitting is the preferred data analysis technique.
2 Context and environment
The technique of ‘Iterative Removal of Sources’ (IROS, Hammersley et al. hammersly (1984)) has been widely used for coded mask instruments. A simple image of the field of view is made using a mapping technique which is optimised for finding a source assuming that the data can be explained by only that source, plus background. The mapping gives the approximately location and intensity of the source, which are then improved by maximising a measure of the goodness of fit. The residuals of the fit are used as the input for a further image reconstruction and source search. The parameters of the two source model are refitted and if the fit represents a significant improvement on the original one the process is continued with more and more sources.
SPIROS is a programme which implements this algorithm for the SPI spectrometer of INTEGRAL, a coded mask imaging instrument with a detector array comprising 19 high-purity Germanium detectors giving an angular resolution of about 2.5∘ over a field of view of 16∘ (Vedrenne, et al. instrument_paper (2003)). SPIROS operates within the ISDC software environment (Courvoisier et al. isdc (2003)).
3 Optimisation criteria and background modelling
The SPI instrument differs from most coded mask instrument for which IROS has been used because
-
1.
The number of detector elements is very limited – 19 in the basic mode, though the concept of ‘pseudo-detectors’ can increases this by up to 104, with double and triple events and pulse shape discrimination (Vedrenne et al. instrument_paper (2003)).
-
2.
In consequence multiple telescope pointings are analysed simultaneously in order to obtain enough information for a unique solution.
The most widely used coded mask image reconstruction techniques, based on correlations of the detector plane with a representation of the form of the mask shadow, usually by FFT, are not appropriate in such circumstances. The limited number of measurements means that effects which average out in the many-pixel limit cannot be ignored. Edge effects and differences between detectors, in their response for different directions, and in their noise levels take on a dominant role. However because of the limited number of measurements, one can use matrix techniques that would be impracticable in other cases.
SPIROS operates on data which have been already binned by (pseudo-) detector, by pointing, and by energy (strictly ‘pulse height’) bin. In most modes it treats data from one energy bin at a time, although a group of input energy bins can be combined to form one. It also reads files containing attitude information, integration times, etc, and a file containing one or more background models.
Considering, then, a particular energy, for a given set of assumed source positions, the expected count in detector (or pseudo-detector) during pointing is
| (1) |
Here is the effective area of the detector to a source in the direction of the th source, which is assumed to have flux within the energy bin considered. The values are obtained by interpolation of data which are stored in so-called IRF (Instrument Response Function) files generated by Monte Carlo simulations. The effective exposure time, corrected for dead-time and all other effects, is and the roll together all the effects of the mask coding and the detector efficiency. For simplicity, only the photopeak response and a single energy are considered here.
The possibility that the background is a combination of components which vary in different ways between pointings and from detector to detector can be included in this formalism by treating those components much like sources:
| (2) |
Here provision is made for the possibility that the form of the background variation with time may be known but that it needs to be multiplied by an unknown factor , analogous to a source intensity (see Section 4).
The objective is then to find the model (the combination of and, if required, ) which, best explains the observed data (the count rates ) in the “Maximum Likelihood” (ML) sense.
In the general case where the number of counts per bin may be small, as can be the case when short exposures or narrow energy bins are being considered, then the relevant statistic is (Cash cash79 (1979)) :
| (3) |
Even in the case of fixed source positions, finding the and which optimises this statistic is a non-linear problem and has to be solved iteratively.
If the counts are large, Gaussian statistics can be assumed and one can minimise the statistic
| (4) |
If the source positions are known (or supposed) and if in addition one makes the approximation that , instead of then the problem of finding the becomes a linear one.
SPIROS can be run either using the general approach or using and the assumption that . The latter is faster and more efficient in those cases where it can validly be used. Note that the user must beware of the dangers of adopting the statistic where it is not valid because for low counts per bin there is a significant probability that . The infinite weights that would result are avoided by ignoring such data, but this introduces a bias, as does the incorrect weight given to other bins with low, but non-zero counts.
4 Background handling
Usually the background has to be treated as an unknown, but some constraining assumptions are necessary - with pointings and detectors, it is obviously not possible at the same time to obtain information about sources in the field of view and make independent estimates of the background in each of the combinations of detector and pointing .
SPIROS reads in one or more (, in general) background models which are sets of values222strictly is stored, generated for a specific data set by an independent programme (called ‘spiback’). Sometimes the model components may be absolute (when they are based on data preceding or following an observation, or from energy bands just above and below the region of interest, for example). Sometimes they are simply tracers of a time variation with arbitrary scaling. The simplest case would be background which is uniform and constant, corresponding to a single component in which all the have the same value. Other possibilities are components which depend on time or from detector to detector in a specific way, or which follow tracers of expected background contributions (for example the veto shield count rate is a measure of the particle flux, the rate of out of range events in the germanium detectors is a measure of high energy particles…).
In its existing form SPIROS has provides for the following possibilities :
-
1.
The backround estimates may be taken to be absolute estimates, not requiring the fitting of a factor
-
2.
They may be taken to reflect the time (pointing to pointing) variation of the background but with a potentially different scaling factor per detector, to be found by fitting within SPIROS.
-
3.
It may be assumed that relative, detector-detector, backgrounds have been provided, as well as the correct time () dependence, so that SPIROS need only fit a single normalising .
-
4.
In a slight generalisation of (3), one factor may be fitted for all single detectors but a different factor for pseudo-detectors corresponding to double events in particular pairs of detectors (or triples, etc.)
The most general case (2) is usually adopted. Further options may be added in the future, such as assuming that the relative backgrounds in different detectors are known but with a different unknown scaling factor to be fitted per pointing or on some other timescale.
5 Mapping; finding and positioning sources
A basic mapping operation consists of considering each pixel in the image successively, placing a test source at that position and establishing the intensity that it would have in order to best match the observed data, along with the uncertainty in that intensity. Sources found in previous iterations, or read in from a catalogue, are either subtracted out from the data () or taken into account in the analysis (). For source searching the intensities and uncertainties evaluated on a comparatively coarse grid (e.g. 0.5∘) can be used. A smoothed linear interpolation is then used to fill in estimates on a finer pitch.
The source selected for potential addition to the list of sources is that which has the highest value of intensity/uncertainty.
Before accepting a new source as real, a simultaneous optimisation of its position and reoptimisation of all the other sources that do not have good catalogued positions is performed (section 6 below). The procedure used is an iterative one with a descent along the line of maximum slope.
6 Relationship of IROS to other methods
Numerous deconvolution techniques have been proposed and used for image reconstruction in astronomy. Examples are Maximum Entropy, and Richardson-Lucy; see Starck & Pantin (decon-review (2002)) for a recent review. Images obtained by such methods can be considered as vectors in an N-dimensional space, where the component of the vector along each of the axes represents the intensity in one of the N pixels. In the presence of noise, there will always be a certain volume in this space, inside which the points correspond to images that are consistent with the data. Different methods apply constraints which are not the same and so do not lead to the same choice of a point in hyperspace among all of the possible ones.
The IROS algorithm searches the space for a solution consistent with the data according to the following rules:
- Mapping :
-
Starting from point in this space which corresponds to the current solution, test each axis (pixel number) to find the point along that axis with the lowest .
- Source finding :
-
Identify which pixel gave the maximum descent in the sense corresponding to a positive source flux. Step along the axis corresponding to that pixel to the lowest point; all other components of the vector are left at their original values.
- Fitting :
-
Intensity fitting corresponds to optimising in a subspace which has just those dimensions corresponding to the sources already found. The position fitting is more complex. An optimisation is made in a separate space with dimensions, corresponding to the position coordinate and the intensity of each of sources. The directions corresponding to the optimised positions of the sources are then added to the original space to make an dimensional one.
Formally, there is no guarantee that this algorithm leads to a minimal description of the data in terms of point sources. Pragmatically, in simulations and in observations of involving known sources, it is found to be effective.
The procedure is very similar to the CLEAN method used in radio astronomy (Högbom, hogbom (1974); Schwarz, schwarz (1978)), except that in CLEAN (i) position optimisation is not normally performed, (ii) the point in the map with the highest absolute value is chosen, so iterations can add negative components to the image, (iii) only a fraction of the intensity of a source is subtracted. The resulting image will usually have a relatively large number of non-zero pixels, whereas with IROS, there is just one per source. CLEAN can be considered as an exploration of the multi-dimensional space considered above, with no positivity constraint and without the fitting stage.
The IROS algorithm differs from many image reconstruction techniques in that the possible source positions are not restricted to a fixed grid of pixel positions.
7 Spectral extraction
In a different mode, SPIROS is used for the extraction of spectral information. This requires an input catalogue, which may simply be a list of known sources or which may be the result of a previous run of SPIROS in imaging mode. In each energy bin in turn, the combination of source intensities (and, if required, of background parameters) which best matches the data is found. The method is as described in section 3.
In this way one obtains for each source a spectrum analogous to a ‘Pulse Height’ spectrum in that off-diagonal terms in the energy response matrix are not taken into account. However other aspects of the instrument response (detector photopeak efficiency variation with energy, for example) have been corrected for. For sources with conventional continuum spectra, this measure is already a very good estimate of the input spectrum. However for definitive results, a programme such as XSPEC (Arnaud xspecref (1996)) needs to be used to take into account the off-diagonal terms in the response of the combination, SPI+SPIROS. XSPEC-compatible response matrices for this step have been derived using Monte Carlo simulations of observations of monoenergetic sources at 100 different energies.
8 Other modes
Optionally, the sources may be treated as having a finite extent. For example it is possible to treat each source as a Gaussian function and find the width which best matches the data.
Extracting a light curve (intensity as a function of time) for each of the sources in an input catalogue is directly analogous to the extraction of pulse height spectra.
Although SPIROS is intended for fitting of point sources, it does have a mode in which one solves simultaneously for the intensities of the fluxes in each pixel of an image, allowing map of diffuse emission to be generated. Such inverse problems are notoriously unstable if the number of pixels is high and the coding is not ideal. Thus instead of a simply multiplying by the inverse of the coding matrix, it is modified by the addition of a diagonal Wiener term or some other smoothing constraint matrix, giving a stabilising effect by allowing the diagonal terms to dominate.
9 Examples of results obtained with SPIROS and Conclusions
Results obtained with Spiros can be seen in other articles in this issue and elsewhere - see, for example, Bouchet et al. (bouchet (2003)).
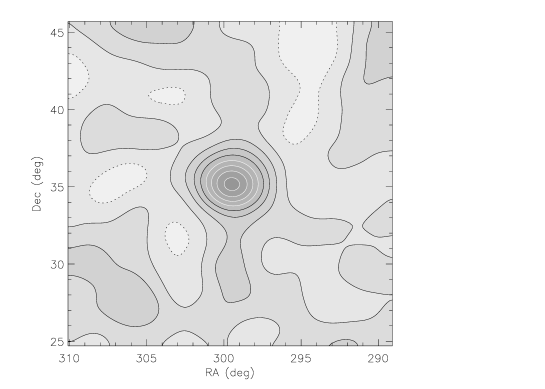
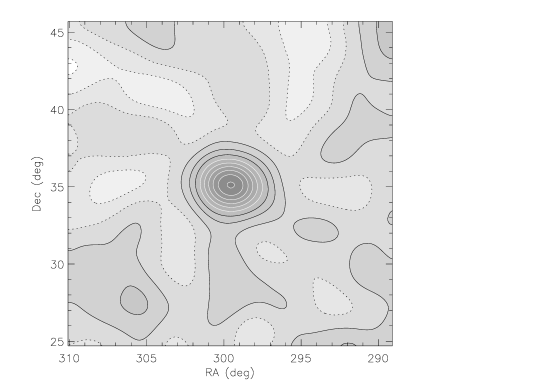
As an example of a slightly non-standard use of Spiros, Figure 1 shows an image obtained using only events interacting in 2 or 3 detectors. For such events there is no information about which of the 2 or 3 detectors corresponds to the first interaction. The source is well identified and located, though with significance lower than in the corresponding single event image (Figure 2).
The form in which the IROS algorithm is implemented within SPIROS handles for the first time the situation where no simplifying assumptions can made about position independence of the recorded mask shadow. By using the instrument response characterised by a generalised matrix and an object-oriented programme structure, additional sophistication can be introduced as necessary and as the knowledge of the instrument improves.
Acknowledgements.
The development of SPIROS was supported by a grant from PPARC. The work has benefited from inputs from many members of the Integral SPI Data Analysis Group (ISDAG) and the Integral Science Data Centre (ISDC).References
- (1) Arnaud, K. A. 1996, ASP Conf. Series, 101, 17
- (2) Bouchet, L. , Jourdain, E., Roques, J.-P., et al., 2003, This volume
- (3) Cash, W. 1979, Ap.J, 228, 939
- (4) Couvouisier, T., Walter, R., Beckmann, V., et al., 2003, This volume.
- (5) Hammersly, A. , Ponman, T., & Skinner, G. 1992, NIMS, A311, 585
- (6) Högbom, J. A. 1974, A&AS, 15, 417
- (7) Schwarz, U. J. 1978, A&A, 65, 345
- (8) Shannon, H. 1948, Bell Syst. Tech. J. 27, 379
- (9) Starck, J. L., Pantin, E., & Murtagh, F. 2002, PASP, 114, 1051
- (10) Strong, A. W. 2003, This volume.
- (11) Sturner, S., Shrader, C., Weidenspointner, G., et al., 2003, This volume.
- (12) Vedrenne, G., Roques, J.-P., Schönfelder, V., et al., 2003, This volume.