The Sloan Digital Sky Survey Quasar Catalog II. First Data Release
Abstract
We present the second edition of the Sloan Digital Sky Survey (SDSS) Quasar Catalog. The catalog consists of the 16,713 objects in the SDSS First Data Release that have luminosities larger than (in a cosmology with = 70 km s-1 Mpc-1, = 0.3, and = 0.7), have at least one emission line with FWHM larger than 1000 km s-1, and have highly reliable redshifts. The area covered by the catalog is 1360 deg2. The quasar redshifts range from 0.08 to 5.41, with a median value of 1.43. For each object the catalog presents positions accurate to better than 0.2′′ rms per coordinate, five-band () CCD-based photometry with typical accuracy of 0.03 mag, and information on the morphology and selection method. The catalog also contains some radio, near-infrared, and X-ray emission properties of the quasars, when available, from other large area surveys. Calibrated digital spectra of all objects in the catalog, covering the wavelength region 3800–9200 Å at a spectral resolution of 1800–2100, are available. This publication supersedes the first SDSS Quasar Catalog, which was based on material from the SDSS Early Data Release. A summary of corrections to current quasar databases is also provided.
The majority of the objects were found in SDSS commissioning data using a multicolor selection technique. Since the quasar selection algorithm was undergoing testing during the entire observational period covered by this catalog, care must be taken when assembling samples from the catalog for use in statistical studies. A total of 15,786 objects (94%) in the catalog were discovered by the SDSS; 12,173 of the SDSS discoveries are reported here for the first time. Included in the new discoveries are five quasars brighter than and 17 quasars with redshifts larger than 4.5.
1 Introduction
Over the past two decades the number of quasars produced by an individual survey has increased by about two orders of magnitude. One of the most intensively studied quasar data sets, the Bright Quasar Survey of Schmidt & Green (1983), contains approximately 100 quasars. In the 1990s the Large Bright Quasar Survey (LBQS; Hewett, Foltz, & Chaffee 1995, 2001) presented more than 1,000 quasars, and recent results from the 2dF Quasar Survey (Croom et al. 2001) have pushed quasar survey sample sizes past the 10,000 object milestone.
This paper describes the second edition of the Sloan Digital Sky Survey (SDSS) Quasar Catalog. The goal of the SDSS quasar survey is to obtain spectra of 100,000 quasars from 10,000 deg2 of high Galactic latitude sky. The survey will provide CCD-based photometry in five broad bands covering the entire optical window, morphological information, and spectra from 3800–9200 Å at a spectral resolution of 1800–2100. A review of the SDSS is given by York et al. (2000); Richards et al. (2002) present an overview of the quasar target selection algorithm, and the first edition of the SDSS Quasar Catalog, based on the SDSS Early Data Release (EDR; Stoughton et al. 2002), is given by Schneider et al. (2002, hereafter Paper I).
The catalog in the present paper consists of the 16,713 objects in the SDSS First Data Release (DR1; Abazajian et al. 2003) that have a luminosity larger than (calculated assuming an = 70 km s-1 Mpc-1, = 0.3, = 0.7 cosmology, which will be used throughout this paper), and whose SDSS spectra contain at least one broad emission line (velocity FWHM larger than 1000 km s-1). The quasars range in redshift from 0.08 to 5.41, and 15,786 (94%) were discovered by the SDSS. An object is classified as previously known if the NASA/IPAC Extragalactic Database (NED) Quasar Catalog contains a quasar within 5′′ of the SDSS position. Occasionally NED lists the SDSS designation for an object that was discovered via another investigation. In the DR1 catalog we have not attempted to correct these misattributions.
The DR1 catalog does not include classes of Active Galactic Nuclei (AGN) such as Type II quasars and BL Lacertae objects; studies of these sources in the SDSS can be found in Zakamska et al. (2003) and Anderson et al. (2003), respectively.
The objects are denoted in the catalog by their DR1 J2000 coordinates; the format is SDSS Jhhmmss.ss+ddmmss.s. Since continual improvements are being made to the SDSS data processing software, the astrometric solutions to a given set of observations can result in modifications to the coordinates of an object at the 0.1′′ to 0.2′′ level, hence the designation of a given source can change between data releases. Except on rare occasions (see §5.1), this change in position is much less than 1′′. When merging SDSS Quasar Catalogs with previous databases one should always use the coordinates, not object names, to identify unique entries. This paper provides a list of corrections to current public quasar databases (§5.13).
The catalog also contains the information required to retrieve the digital spectra of all the quasars (see §4).
The observations used to produce the catalog are presented in §2; the construction of the catalog and the catalog format are discussed in §§3 and 4, respectively. Section 5 contains an overview of the catalog, and a brief discussion of future work is given in §6. The catalog can be found at a public web site.111http://www.sdss.org/dr1/products/valueadded/qsocatdr1.html
2 Observations
2.1 Sloan Digital Sky Survey
The Sloan Digital Sky Survey uses a CCD camera (Gunn et al. 1998) on a dedicated 2.5-m telescope at Apache Point Observatory, New Mexico, to obtain images in five broad optical bands over 10,000 deg2 of the high Galactic latitude sky, most of which is a contiguous area centered approximately on the North Galactic Pole. The five filters (designated , , , , and ) cover the entire wavelength range of the CCD response (Fukugita et al. 1996); updated filter response curves are given by Stoughton et al. (2002).
The survey data processing software measures the properties of each detected object in the imaging data in all five bands, and determines and applies both astrometric and photometric calibrations (Pier et al., 2003; Lupton et al. 2001). Version 5.3 of the photometric pipeline software was used to process the imaging data used for the quasar catalog. The DR1 images have a median seeing of about 1.5′′; only 10% of the data have seeing larger than 1.7′′ (the precise values of these numbers are filter-dependent). The 50% completeness limits for point sources in DR1 are typically 22.5, 23.2, 22.6, 21.9, and 20.8 in , , , and , respectively (Abazajian et al. 2003). The image of an unresolved source brighter than will be saturated. All magnitudes in the quasar catalog refer to the point spread function measurements of the SDSS photometric pipeline (see Stoughton et al. 2002 and Abazajian et al. 2003 for details).
Photometric calibration is provided by simultaneous observations with a 20-inch telescope at the same site (see Hogg et al. 2001, Smith et al. 2002, and Stoughton et al. 2002). The SDSS photometric system is based on the AB magnitude scale (Oke & Gunn 1983); the SDSS system was designed so that the colors of an object with a constant spectral energy distribution are zero. We estimate, from several lines of argument, that the , , and colors are AB to within 3%. The color appears to be too red by about 5% (in the sense that ). The photometric measurements are placed on the natural system of the 2.5-m telescope, and the asterisks affixed to the filter names of the photometric measurements in the previous catalog (e.g., ), which indicated the preliminary status of the calibration of the SDSS system, have been removed for the DR1 measurements. The accuracy of the absolute calibration of the magnitudes (i.e., in Janskys) is now expected to be better than 10% (Abazajian et al. 2003).
The catalog contains photometry from 52 different SDSS imaging runs taken between 1998 September 19 (Run 94) and 2002 September 5 (Run 3325) and spectra from 291 spectroscopic plates taken between 2000 March 5 and 2001 October 21.
2.2 Target Selection
The SDSS filter system was designed to identify quasars at redshifts between zero and six (see Paper I and Richards et al. 2002 for an overview of SDSS quasar selection). Most quasar candidates are selected based on their location in multidimensional SDSS color-space. Objects with colors that place them outside of the stellar locus and do not inhabit some specific “exclusion” regions (e.g., places dominated by white dwarfs, A stars, and M star-white dwarf pairs) are identified as primary quasar candidates. An magnitude limit of 19.1 is imposed for candidates whose colors indicate a probable redshift of less than 3 (the objects identified in the color cube, most are “UV excess” objects at redshifts of two or less); high-redshift candidates (found in the color cube) are accepted if . The vast majority (over 90%) of SDSS-selected quasars follow a remarkably tight color-redshift relation in the SDSS color-system (Richards et al. 2001). In addition to the multicolor selection, unresolved objects brighter than that lie within 1.5′′ of a FIRST radio source (Becker, White, & Helfand 1995) are also identified as primary quasar candidates.
The Point Spread Function (PSF) magnitudes are used for the quasar target selection, and the selection is based on magnitudes and colors that have been corrected for Galactic absorption (using the maps of Schlegel, Finkbeiner, & Davis 1998). For candidates whose likely redshifts are less than three, both extended and point sources are included as quasar candidates for the spectroscopic program; however, extended sources are excluded if they lie in a region of color space that is densely occupied by normal galaxies (see Richards et al. 2002). At larger likely redshifts, an object must be unresolved in the SDSS images to become a multicolor spectroscopic target (in order to reduce contamination from faint red galaxies).
The PSF magnitudes will suffer a bias for resolved objects; if the luminosity of resolved component (the host galaxy) is comparable to that of the point source (the AGN), the PSF magnitude will overestimate the AGN brightness. To estimate the size of this effect, we have examined the difference between the PSF and “model” (i.e., total) magnitudes for a set of normal galaxies with magnitudes between 18 and 21.5. The PSF magnitude in these cases represent the light from the galaxy that would be subsumed in the AGN profile; as one expects, as the brightness of the galaxy decreases, the difference between the galaxy PSF and model magnitudes decline (fainter galaxies tend to be smaller). An extreme case is an AGN component at the flux limit and the luminosity limit residing in a galaxy whose brightness is equal to the AGN, the reported PSF magnitude will be 0.40 mag brighter than that due to the AGN; if the galaxy’s total brightness is two magnitudes below that of the AGN component, the PSF magnitude for an AGN will be brightened by 0.09 mag. This exercise shows that the presence of a significant host galaxies can cause an overestimate in the AGN numbers in a flux-limited sample, but host galaxy effects can also remove legitimate AGNs from the sample; contamination from the galaxy may cause the object to shift out of the quasar selection region in the color-color diagram. The calibration of how host galaxies impact the interpretation of the SDSS quasar sample is clearly a complex task and beyond the scope of this paper. (The SDSS quasar survey is not unique in suffering from this selection effect.)
Supplementing the primary quasar sample described above are quasars that were targeted by the following SDSS software selection packages: Galaxy (part of the SDSS galaxy sample; Strauss et al. 2002 and Eisenstein et al. 2001), X-ray (object near the position of a ROSAT All-Sky Survey (RASS) source; Anderson et al. 2003), Star (point source with unusual color), or Serendipity (unusual color or FIRST matches). No attempt at completeness was made for the last three categories; objects selected by these algorithms are observed if a given spectroscopic plate has fibers remaining after all of the high-priority classes (galaxies, quasars, and sky and spectrophotometric calibrations) in the field have been assigned fibers (see Blanton et al. 2003). Most of the DR1 quasars that fall below the magnitude limits of the quasar survey were selected by the serendipity algorithm (see §5).
Target selection also imposes a maximum brightness limit on the objects. Accurate photometric measurements of point sources brighter than are impossible as their images are saturated; objects that have saturated pixels are dropped from further consideration. An additional constraint is introduced to prevent saturation and fiber cross-talk problems in the SDSS spectroscopic observations; an object cannot be included in the quasar spectroscopic program if it has an magnitude brighter than 15.0. Objects may also be dropped from consideration if the photometric measurements are considered suspect (approximately 5% of the area); for example, objects close to very bright stars, data badly affected by bad CCD columns and CCD saturation trails, etc.
One of the most important tasks during the SDSS commissioning period was to refine the quasar target selection algorithm (see Paper I); all of the DR1 data were taken during this period. The quasars in the catalog were selected using eleven different versions of selection software; none of the DR1 quasars were selected for spectroscopy using the final version of the code described by Richards et al. (2002). Once the final target selection software was installed, the algorithm was applied to the entire DR1 photometric database. The DR1 quasar catalog contains two sets of spectroscopic targeting information for each object: that used for the spectroscopic observation, and the values produced by the final algorithm (see §4). It is important to note that extreme care must be exercised when constructing statistical samples from this catalog; not only must one drop objects that were not identified by the final selection software, one must also account for quasar candidates produced by the final version that were not slated for spectroscopic observation by earlier versions of the software. This caveat aside, the selection for the UV-excess quasars, which comprise the vast majority ( 80%) of the objects in the DR1 Catalog, has remained reasonably uniform; the changes to the selection algorithm were primarily aimed at improving the effectiveness of the identification of quasars. A more extensive discussion of this issue can be found in §5.2.
The efficiency (the ratio of true quasars to quasar candidates) and completeness of the final selection algorithm have not yet been precisely calibrated; both quantities have strong brightness and redshift dependences. Preliminary estimates indicate that the design goals (65% efficiency and 90% completeness) should be achieved, although the use of different selection algorithms causes these values to vary in the DR1 database.
2.3 Spectroscopy
Spectroscopic targets chosen by the various SDSS selection algorithms (i.e., quasars, galaxies, stars, serendipity) are arranged onto a series of 3∘ diameter circular fields (Blanton et al. 2003). A typical spectroscopic field contains about 75 quasar candidate spectra (the number of confirmed quasars per field in the DR1 catalog ranges from 17 to 162; commissioning tests are responsible for this large range). Details of the spectroscopic observations can be found in York et al. (2000), Castander et al. (2001), Stoughton et al. (2002), and Paper I. The two double-spectrographs produce data covering 3800–9200 Å and have a spectral resolution ranging from 1800 to 2100.
There are 291 DR1 spectroscopic fields. The majority of the coverage lies near the Celestial Equator; the locations of the plate centers can be found from the information given by Abazajian et al. (2003). The total area enclosed by the spectroscopic fields is 1565 deg2 (there is considerable overlap between many of the fields). Not all of the plates, however, were fully covered by spectroscopic targets, as in some cases SDSS imaging did not cover the entire plate area at the time of plate drilling; the actual area with DR1 spectra is 1360 deg2.
The data, along with the associated calibration frames, are processed by the SDSS spectroscopic pipeline, which removes instrumental effects, extracts the spectra, determines the wavelength calibration, subtracts the sky spectrum, removes the atmospheric absorption bands, merges the blue and red spectra, and performs the flux calibration. The calibrated spectra are classified into various groups (e.g., star, galaxy, quasar) and redshifts determined by two independent software packages (see Stoughton et al. 2002 for a description of the spectroscopic processing code). Objects whose spectra cannot be classified by the software are flagged for visual inspection. The quasar classification is based solely on the presence of broad emission lines in the spectra; the classification software does not employ information about the selection of the object (e.g., was the spectrum obtained because the target selection process identified the object as a quasar candidate?), nor is luminosity used by the SDSS pipeline as a criterion for designating an object as a quasar. The quasar spectra presented herein (and the sample from which they were drawn) were visually inspected by several of the authors (DPS, PBH, GTR, MAS, DVB, and SFA) to ascertain the accuracy of the redshifts (see §3.2).
Figure 1 shows the calibrated SDSS spectra of six of the catalog quasars representing a wide range of properties; all were previously unknown. These spectra have been rebinned for display purposes. A composite quasar spectrum formed from SDSS data is discussed by Vanden Berk et al. (2001).
3 Construction of the SDSS Quasar Catalog
The quasar catalog was constructed in three stages: 1) Creation of a quasar candidate database, 2) Visual examination of the candidates’ spectra, and 3) Application of luminosity and emission-line velocity width criteria.
The continuous evolution of the photometric pipeline during the time period when the DR1 data were being acquired creates a situation where the most accurate photometric measurements may not be the values used for the actual target selection, i.e., the measured properties of an object (astrometry, photometry) can change between the time the spectroscopic plates are drilled and the latest processing of the data. There are two sets of measurements that are relevant: 1) TARGET refers to the values used at the times that spectroscopic targets were selected for the drilling of plates (the TARGET selection flags are those produced by the selection algorithm at the time of plate drilling), and 2) BEST are the results of the latest processing of the photometric pipeline (i.e., the BEST selection flag is that produced by the Richards et al. 2002 algorithm). Unless the type of measurement is explicitly given, the BEST values are reported.
Occasionally the actual image data changes between TARGET and BEST; this occurs when a previously scanned (and targeted) region is reobserved under better conditions. In such a situation the TARGET parameters do not change, but the BEST values refer to the quantities derived from the highest quality images. In this case quasar variability can produce significant changes between the TARGET and BEST photometry, and introduce changes between the Paper I and DR1 photometry.
3.1 Creation of Quasar Candidate Database
A quasar candidate database was constructed by requesting the image and spectroscopic information on all objects with DR1 spectra that were either targeted (using the TARGET flags) as a quasar candidate or whose spectra were classified as quasars by the SDSS software. The query to the SDSS database returned a total of 35,535 objects. This quasar database was constructed prior to the final development of the project’s Catalog Archive Server (CAS), therefore it is not possible to recreate this database with straightforward queries to the CAS. The differences are not expected to be significant, but future work will use the CAS protocol.
At this stage two additional cuts were made: 1) objects whose spectra were classified with high confidence as “stars” and had redshifts less than 0.002 were rejected, and 2) multiple observations of the same object (coordinates agreed to 1′′) were resolved; the spectrum with the highest S/N ratio was retained. These culls resulted in the removal of 8345 entries.
This database was supplemented by a visual examination of all “unclassifiable” DR1 spectra and by investigating objects that appeared to be quasars but whose SDSS archive entries were for various reasons incomplete. These efforts identified twelve quasars that were added to the quasar database.
3.2 Visual Examination of the Spectra
The SDSS spectrum of each of the 27,202 remaining quasar candidates was manually inspected by several of the authors. This effort confirmed that spectroscopic pipeline redshifts of the vast majority of the objects were accurate. Several thousand objects were dropped from the list because they were obviously not quasars (these objects tended to be galaxies that had been targeted as a possible quasar by the selection software). Spectra for which redshifts could not be determined (low signal-to-noise ratio or subject to data processing difficulties) were also removed from the sample, as were a handful of objects with unreliable photometry (i.e., the photometric flags indicated severe problems with the measurements). The visual inspection also resulted in the revisions of the redshifts of approximately 100 quasars; usually this adjustment was quite substantial (pipeline misidentification of emission line).
3.3 Luminosity and Line Width Criteria
Quasars have historically been defined as the high-luminosity branch of Active Galactic Nuclei (AGN); the (somewhat arbitrary) luminosity division between quasars and Seyfert galaxies has a consensus value of for an = 50 km s-1 Mpc-1, = 1, cosmology (e.g., Schmidt and Green 1983).
The luminosity calculations in Paper I employed this standard cosmology. Paper I selected the band as the luminosity indicator (i.e., required that ) as this choice offered a number of advantages over the filter (or the similar photometry of the SDSS): 1) Galactic absorption is less important in than , 2) the ability to detect “red” or “reddened” quasars is enhanced in the band, and 3) sensitivity to high-redshift quasars (at redshifts above about 2.5 the Lyman forest enters the bandpass, whereas this does not occur in the filter until redshifts near five). For these reasons the flux limit for the SDSS Quasar Survey is set by the photometry. The only significant disadvantage of this approach is that, relative to photometry, the band measurements contain a larger contribution of host galaxy starlight; this can be important at low redshift. This effect is partially mitigated, however, by the use of point spread function photometry in the quasar selection, even for extended sources. The luminosity division of Paper I, , corresponds to for a “typical” quasar spectral energy distribution.
The DR1 catalog adopts a cosmology consistent with the recent results from the Wilkinson Microwave Anisotropy Probe (WMAP; Bennett et al. 2003): = 70 km s-1 Mpc-1, , and (Spergel et al. 2003). Figure 2 displays the luminosity differences introduced by this change of cosmological parameters (using the formulae presented by Hogg 1999). The change in produces a lowering of the calculated luminosity by 0.73 mag at zero redshift. The luminosities of the WMAP and standard cosmologies become equal at a redshift of approximately 1.7; at larger redshifts the WMAP cosmology luminosities become steadily (albeit slowly) larger with increasing redshift. The luminosities of high-redshift quasars calculated by the“standard” and WMAP cosmologies are similar because at the effect of the different values of and is almost cancelled by the change of from 50 to 70 km s-1 Mpc-1 (see Figure 2).
The absolute magnitudes were calculated by correcting the measurement for Galactic extinction (using the maps of Schlegel, Finkbeiner, & Davis 1998) and assuming that the quasar spectral energy distribution in the ultraviolet-optical can be represented by a power law (), where = (Vanden Berk et al. 2001). This calculation ignores the contributions of emission lines, and will break down for quasars with redshifts larger than 5.0 as the strong Lyman emission line (typical observed equivalent width of 400 Å at ; Fan et al. 2001) and the Lyman forest enter the bandpass.
We have adopted a luminosity cutoff for the DR1 catalog of ; this corresponds to a Paper I (“standard” quasar cosmology) absolute magnitude of for an object at zero redshift with a typical AGN spectrum. An object of will reach the “low-redshift” ( selected) SDSS quasar selection limit at a redshift of 0.4.
For each emission line, the spectroscopic pipeline returns values for line widths (the FWHM of a single Gaussian). Quasar emission line profiles are frequently poor matches to a Gaussian, and the line fitting process fails in several percent of the cases; when this occurs zero is entered for the line width. We have examined the line profiles of all objects satisfying our luminosity criterion that had quoted maximum line FWHMs of less than 1000 km s-1, and included in the catalog objects that had at least one line (or significant component of a line) whose “manual” Gaussian-fit FWHM exceeded 1000 km s-1. The line fitting software is currently being modified, and it is hoped that future editions of the SDSS Quasar Catalog will include reliable, automated measurements of the maximum emission line FWHM for each object.
4 Catalog Format
The DR1 SDSS Quasar Catalog is available in three types of files at the public web site: 1) a standard ASCII file with fixed-sized columns, 2) a gzipped compressed version of the ASCII file (reduces the size by a factor of nearly five), and 3) a binary FITS table format. The following description applies to the standard ASCII file. All files contain the same number of columns, but the storage of the numbers differs slightly in the ASCII and FITS formats; the FITS header contains all of the required documentation.
The standard ASCII catalog (Table 2 of this paper) contains information on 16,713 quasars in a 5.4 megabyte file. The DR1 format is similar to that of the EDR Quasar Catalog (Paper I), but the DR1 Catalog is considerably larger because of the increase of a factor of over four in number of objects and the expanded information given for each object (52 columns in DR1 compared to 32 columns in EDR).
The first 58 lines consist of catalog documentation; this is followed by 16,713 lines containing information on the quasars. There are 52 columns in each line; a summary of the information is given in Table 1 (the documentation in the catalog is an expansion of Table 1). At least one space separates all the column entries, and, except for the first and last columns (SDSS and NED object names), all entries are reported in either floating point or integer format.
Notes on the catalog columns:
1) The DR1 object designation, given by the format SDSS Jhhmmss.ss+ddmmss.s; only the final 18 characters (i.e., the “SDSS J” for each entry is dropped) are given in the catalog.
2-3) These columns contain the J2000 coordinates (Right Ascension and Declination) in decimal degrees. The positions for the vast majority of the objects are accurate to 0.1′′ rms in each coordinate; the largest expected errors are 0.2′′ (see Pier et al 2003).
4) The quasar redshifts are listed in column 4 of the catalog; see Paper I and Stoughton et al. (2002) for a discussion of the redshift measurements.
5) The database search technique used to find the quasar is coded in this column. If the object was found by the database search for objects targeted by the quasar selection algorithm or the spectrum of the object was classified as a quasar by the SDSS software, this column contains a “0”; a “1” indicates the supplemental sample of twelve objects (see section 3.1).
6-15) These columns contain the BEST DR1 PSF magnitudes and errors for each object in the five SDSS filters. The effective wavelengths of the , , , , and bandpasses are 3551, 4684, 6166, 7480, and 8932 Å, respectively (Stoughton et al. 2002). The magnitudes are reported in the natural system of the SDSS camera. The SDSS photometric system is normalized so that the magnitudes are approximately on the AB system (Oke & Gunn 1983); the accuracy of this transformation is approximately 10% (see discussion in Abazajian et al. 2003). The values refer to magnitudes measured by fitting the point spread function to the data (see Stoughton et al. 2002). The magnitudes have not been corrected for Galactic reddening. The quantities are asinh magnitudes (Lupton, Gunn, & Szalay 1999), which are defined by
where is the flux density from a zero AB magnitude object (3631 Jy) and the quantity is a softening parameter. The SDSS has set , which is dimensionless, such that zero flux corresponds to magnitudes 24.63, 25.11, 24.80, 24.36, and 22.83 in the , , , , and bands, respectively (Stoughton et al. 2002). For measurements that are more than 2.5 magnitudes brighter than the zero flux values, the difference between asinh magnitudes and standard magnitudes (Pogson 1856) is less than 1%; for the vast majority of the entries in the catalog the differences between asinh and standard magnitudes are negligible (the primary exceptions being the and magnitudes of high-redshift quasars).
16) The Galactic absorption in the band is based on the maps of Schlegel, Finkbeiner, & Davis (1998). For an absorbing medium, the absorptions in the SDSS bands are
There are some differences in the SDSS filter response curves as originally designed (Fukugita et al. 1996, Gunn et al. 1998) and those in operation at the telescope (Stoughton et al. 2002). These changes, particularly the 100 Å redward shift of the response, cause small but systematic changes in the estimated Galactic absorption, but these changes are not large for the objects in the catalog.
17) If there is a source in the FIRST catalog within 1.5′′ of the quasar position, this column contains the FIRST peak flux density (in mJy) at 20 cm encoded as an AB magnitude
An entry of “0.0” indicates no match to a FIRST source; an entry of “” indicates that the object does not lie in the region covered by the FIRST survey.
18) The S/N of the FIRST measurement.
19) Separation between the SDSS and FIRST coordinates (in arc seconds).
20) The logarithm of the vignetting-corrected count rate (photons s-1) in the broad energy band (0.1–2.4 keV) in the ROSAT All-Sky Survey Faint Source Catalog (Voges et al. 2000) and the ROSAT All-Sky Survey Bright Source Catalog (Voges et al. 1999). The matching radius was set to 30′′; an entry of “0.0” in this column indicates no X-ray detection.
21) The S/N of the ROSAT measurement.
22) Separation between the SDSS and ROSAT All-Sky Survey coordinates (in arc seconds).
23-28) These columns contain the JHK magnitudes and errors from the 2MASS All-Sky Data Release Point Source Catalog (Cutri et al. 2003) using a matching radius of 3.0′′. A non-detection by 2MASS is indicated by a “0.0” in these columns. Note that the 2MASS measurements are Vega-based, not AB, magnitudes.
29) Separation between the SDSS and 2MASS coordinates (in arc seconds).
30) The absolute magnitude in the band calculated assuming = 70 km s-1 Mpc-1, = 0.3, and = 0.7, a power law (frequency) continuum index of , and correcting the measurement for Galactic extinction.
31) If the SDSS photometric pipeline classified the image of the quasar as a point source, the catalog entry is 0; if the quasar is extended, the catalog entry is 1.
32) The version of the quasar target selection algorithm used to select the object is coded in this column (see the documentation in the catalog and Stoughton et al. 2002 for details).
33-39) These six columns indicate the spectroscopic target selection status for each object. This is the information used at the time of the drilling of the spectroscopic plate. An entry of “1” indicates that the object satisfied the given criterion (see Stoughton et al. 2002 for details). Note that an object can be targeted by more than one selection algorithm. (These entries are the TARGET selection flags.)
40-46) Similar to columns 33-38, but containing the information for the version of the Quasar Target Selection Algorithm presented in Richards et al. 2002 (the BEST selection flags).
47-48) The SDSS Imaging Run number and the Modified Julian Date of the photometric observation used in the catalog. The Modified Julian Date (MJD) is given as an integer; the catalog entry is the truncated MJD, and all observations on a given night have the same integer MJD (and, because of the observatory’s location, the same UT date). For example, imaging run 94 has an MJD of 51075; this observation was taken on the night of 1998 September 19 (UT).
49-51) Information about the spectroscopic observation (modified Julian date, spectroscopic plate number, and spectroscopic fiber number) used to determine the redshift are contained in these columns. These three numbers are unique for each spectrum, and can be used to retrieve the digital spectra from the public SDSS database.
52) If there is a source in the NED quasar database within 5.0′′ of the quasar position, the NED object name is given in this column. The matching was done using the 30,477 objects in the NED quasar database as of January 2003.
5 Catalog Summary
Of the 16,713 objects in the catalog, 15,786 were discovered by the SDSS and 12,173 are presented here for the first time. The catalog quasars span a wide range of properties: redshifts from 0.08 to 5.41, (84 objects have ; only three have ), and . The catalog contains 1193, 824, and 2260 matches to the FIRST, RASS, and 2MASS catalogs, respectively, The RASS and 2MASS catalogs cover essentially all of the DR1 area, but 17% of the entries in the DR1 catalog lie outside of the FIRST region.
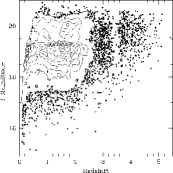
Figure 3 displays the distribution of the DR1 quasars in the -redshift plane (the three objects with are not plotted). Objects which NED indicates were previously discovered by investigations other than the SDSS are indicated with open circles. The curved cutoff on the left hand side of the graph is due to the minimum luminosity criterion (). The ridge in the contours at for redshifts below three reflects the flux limit of the low-redshift sample; low-redshift points fainter than primarily represent objects selected via criteria other than the primary multicolor sample (e.g., serendipity). Above a redshift of 3, the vast majority of the catalog quasars were discovered by the SDSS.
A histogram of the catalog redshifts is shown in Figure 4. Most of the quasars have redshifts below two (the median redshift is 1.43), but there is a significant tail of objects out to a redshift of five ( = 5.41). The dips in the curve at redshifts of 2.7 and 3.5 arise because the SDSS colors of quasars at these redshifts are similar to the colors of stars, so we must accept significant incompleteness at these redshifts to avoid being flooded by stars masquerading as quasars. We expect the final target selection algorithm (Richards et al. 2002) will reduce the dip seen at .
The distribution of the observed magnitude (not corrected for Galactic extinction) of the quasars is given in Figure 5. The sharp drops in the histogram at and are due to the magnitude limits in the low and high redshift samples, respectively.
5.1 Differences with the SDSS EDR Catalog
The EDR Catalog (Paper I) contained 3814 objects. All of the EDR survey area is included in the new catalog. There are two entries in the EDR catalog that require special comment:
SDSS J004705.83004819.5: The DR1 processing of this spectrum revealed that the strong emission line at 4300 Å in the EDR spectrum was a defect in the data; the continuum is essentially featureless, and this object is not in the DR1 catalog. This source should be dropped from all quasar databases.
SDSS J172543.02+582110.8: An error was introduced by the EDR software when matching this spectrum to an object in the image database. There is an object at this position, but the fiber was drilled using the information from SDSS J172542.16+582110.5 (the designation of the quasar in the DR1 catalog). It is not understood how the 7′′ offset was introduced in the EDR matching for this object (all the other EDR quasars match the DR1 positions within 1′′). SDSS J172543.02+582110.8 should be dropped from all quasar databases and be replaced with the DR1 information of SDSS J172542.16+582110.5.
The DR1 redshifts of four quasars (SDSS J014905.28011405.0, SDSS J023044.81004658.0, SDSS J151307.26000559.3, and SDSS J171930.24584804.7) differ by more than 0.1 from the EDR values; the DR1 measurements are more reliable.
Thirty of the DR1 measurements differ by more than 0.5 mag from the corresponding Paper I entries. The source of this discrepancy is almost certainly quasar variability, as in all 30 cases the photometry presented in the catalog is based on image data that was taken at a different time than the photometric observations used in Paper I. For most of the Paper I quasars, the EDR and DR1 photometry is based on the same imaging data. The difference between the EDR and DR1 photometry for these objects is roughly Gaussian with a dispersion of a percent or two; this difference arises from upgrades in the photometric pipeline.
5.2 Analysis of Quasar Selection
The Quasar Selection Algorithm was being tested throughout the period of DR1 data acquisition; this is reflected in the large number of versions of the algorithm listed in the catalog. Although all of the versions strongly resembled the final selection software (Richards et al. 2002), the subtle differences in selection demand that caution be exercised (especially at redshifts above three) when using the DR1 catalog for statistical studies.
The catalog contains two sets of target selection flags: 1) the flag employed to drill the spectroscopic plates (i.e., the information used to select the object for spectroscopic observation), and 2) the target flag produced for each object using the final version of the selection software. To create a uniform sample would require taking into account those objects selected by the final target software that were missed by the code in use at the time of plate drilling.
Therefore the quasars presented in this paper do not represent a uniform and homogeneous sample, and significant effort will be required to quantify this to allow it to be used for statistical analysis. Future papers will discuss (and resolve) these problems in full; here we simply describe the issues involved.
In particular, the color inclusion cuts described in Richards et al. (2002) are not implemented for any of the DR1 spectroscopic data. This means that the quasar target list from the TARGET imaging data and that from the BEST imaging data can differ significantly. In addition, for some regions of sky different imaging runs are used to produce TARGET and BEST measurements. For example, the EDR data in the “Southern stripe”, the images taken on the Celestial Equator in the Southern Galactic Cap, were among the earliest observations taken by the SDSS, and they have subsequently been replaced by data of superior quality. Photometric quasar variability between the runs (Vanden Berk et al. 2003) can cause individual objects to move in and out of the sample. Many of the quasars included in this paper (especially at the faint end) were not selected by the quasar target selection algorithm at all, but by the Serendipity and RASS match algorithms (Stoughton et al. 2002; Anderson et al. 2003) and more rarely by the galaxy target selection algorithms (Strauss et al. 2002; Eisenstein et al. 2001).
We have examined the nature of those objects targeted as quasar candidates in the BEST database which do not have spectra. The majority of these are missing simply because the DR1 spectroscopic plates do not fully cover the DR1 imaging area. The tiling algorithm that assigns targets to spectroscopic plates (Blanton et al. 2003) is not fully efficient, causing an additional (small) incompleteness. Of the remaining objects, we find the DR1 sample is complete for bright UV excess sources (), but the completeness of redder objects is complex and remains to be properly quantified.
The 18 AGN of Schmidt and Green (1983) that lie within the DR1 imaging data provide a simple test of the UV excess detection code. Three of these objects are brighter than the spectroscopic survey limit, but the remaining 15 were all identified by the BEST selection algorithm as multicolor quasar candidates in the primary survey. The DR1 Quasar catalog does not contain all 15 of these objects as the area covered by spectroscopic survey considerably lags (as it must) that of the imaging survey, and several of the objects fall below our (and that of Schmidt and Green) quasar luminosity limit.
Because of time-critical demands for spectroscopic plates, some regions of sky with poor seeing were targeted, with predictably poor results in quasar target selection. In addition, we have a posteriori culled from the quasar target list regions of sky in which the numbers of quasar candidates appeared unphysically large for similar reasons of substandard seeing; these objects were never tiled and therefore never observed spectroscopically. We have not yet completed the book-keeping required to document these various problems.
In short, a full statistical analysis of the quasar sample will require analysis of the completeness at the depth described for the galaxy sample in Appendix A of Tegmark et al. (2003). Our future work will concentrate on defining the selection function for the DR1 quasar sample, performing an analysis of those objects selected by the new algorithm but for which we do not currently have spectroscopy, and producing a new sample that is suitable for statistical analysis.
A summary of the spectroscopic selection, for both the TARGET and BEST algorithms, is given in Table 3. We report six selection classes, which are columns 33 to 38 (TARGET) and 39 to 44 (BEST) in the catalog. The second and fourth columns in Table 3 give the number of objects that satisfied a given selection criterion; the third and fifth columns contain the number of objects that were identified only by that selection class. As expected, the solid majority (77%) were selected based on the SDSS quasar selection criteria; one-third of the catalog objects were selected on that basis only. Approximately 60% of the quasars were identified by the serendipity code, which is also primarily an “unusual color” algorithm. About one-fifth of the catalog was selected by the serendipity criteria alone; these objects tend to be quasars that fall below the magnitude limit of the quasar survey algorithm.
Of the 10,996 DR1 quasars that have Galactic-absorption corrected magnitudes brighter than 19.1, 10,719 were found from the quasar multicolor selection; if one includes multicolor and FIRST selection, all but 172 of the 10,996 objects are selected. (If one examines the BEST instead of the TARGET target flag, 10,310 of the DR1 quasars with Galactic-absorption corrected magnitudes brighter than 19.1 were selected by the multicolor selection.)
5.3 Bright Quasars
The catalog contains 19 quasars that have ; five are reported here for the first time, one is incorrectly listed by NED as an SDSS discovery (HS1700+6416), and 13 are non-SDSS discoveries. The relatively large number of bright quasars is not produced by the change in the luminosity cutoff from Paper I; only one of the 19 objects falls below the luminosity limit of the Paper I cosmology. SDSS J073733.01+392037.4 (, ) and SDSS J210001.24071136.3 (, ) are two particularly interesting cases; the spectrum of the first object is displayed in Figure 1. Of the 193 catalog quasars with , 109 are SDSS discoveries.
Recall that objects that have are not observed with the SDSS spectrographs; thus 3C 273, which lies in the DR1 area, is not an entry in the DR1 Quasar Catalog. Accurate photometric information for known quasars fainter than the saturation limit () in the DR1 area can be obtained from the imaging observations.
5.4 Luminous Quasars
There are 23 catalog quasars with (3C 273 has in our adopted cosmology); nine were previously unknown, including SDSS J073733.01+392037.4, which was mentioned in §5.3. The most luminous quasar in the catalog, HS 1700+6416 (= SDSS J170100.62+641209.0) at and , was included in Paper I. The most luminous of the previously unknown quasars have .
5.5 Broad Absorption Line Quasars
The SDSS Quasar Selection Algorithm has proven to be effective at finding Broad Absorption Line (BAL) Quasars. The spectrum of SDSS J092819.28+534024.2, a quasar with deep, broad, complex absorption troughs, is displayed in Figure 1. The EDR BAL catalog, based on the material in Paper I, is presented by Reichard et al. (2003a); approximately 6% of the EDR quasars are BALs. At redshifts where BALs can be selected from the SDSS, the raw BAL fraction is 15% (Tolea et al. 2002) and the fraction after accounting for color-dependent selection effects is 13.41.2% (Reichard et al. 2003b). After including incompleteness corrections, the true fraction of BALs in the quasar population has been measured as 224% in the LBQS (Hewett & Foltz 2003) and estimated as 15.91.4% in the SDSS (Reichard et al. 2003b). An investigation of the properties of the Paper I BALs is also given in Reichard et al. (2003b). Finally, the SDSS has also demonstrated that it can identify an appreciable number of “extreme BALs”; 18 of the 23 ususual BALs presented in Hall et al. (2002a) are in the DR1 catalog.
5.6 Quasars with Redshifts Below 0.2
The catalog contains 101 quasars with redshifts below 0.2; 75 are SDSS discoveries, and 64 are presented here for the first time. Approximately half of these objects have luminosities below the Paper I limit. Figure 1 displays the spectrum of SDSS J091955.33+552137.0, a , quasar. The object with the lowest redshift among the new discoveries is SDSS J142748.28+050222.0 at .
5.7 High-Redshift () Quasars
There are 186 quasars in the DR1 Quasar Catalog that have ; 73 are reported here for the first time. The SDSS has identified quasars to (e.g., Fan et al. 2003 and references therein), but objects with cannot be found by the standard SDSS software. At these redshifts, the observed wavelength of the Lyman emission line is redward of the band, and quasars become single-filter () detections. At the typical -band flux levels for redshift six quasars, there are simply too many “false-positives” to undertake automated targeting. The largest redshift in the DR1 catalog is SDSS J023137.65072854.5 at , which was described by Anderson et al. (2001); that paper also describes the properties of many of the high-redshift objects in the DR1 catalog. Although only a small fraction of the objects (about 1%) in the catalog have redshifts larger than 4.0, the SDSS is clearly very effective at discovering such quasars; most of the 186 DR1 catalog entries with are listed by NED as SDSS discoveries.
The spectra of three interesting new discoveries are displayed in Figure 1: 1) SDSS J001714.67100055.4 is the only new quasar reported in this paper; 2) SDSS J004054.65091526.8, at = 4.98, is an example of a weak-lined high-redshift quasar (see e.g., Fan et al. 1999); the redshift is primarily based on the location of the Lyman forest; and 3) SDSS J092819.28+534024.2 is a = 4.39 quasar with strong, complex, broad absorption features.
Although none of the quasars is detected in the RASS, three, including the previously mentioned weak-lined quasar SDSS J004054.65091526.8, serendipitously lie in publicly available fields observed with the XMM-Newton European Photon Imaging Camera (EPIC). These three objects are discussed in the Notes on Individual Objects (§5.14).
5.8 Close Pairs
The SDSS spectroscopic survey is not particularly effective at identifying close pairs of quasars because of the mechanical constraint that spectroscopic fibers must be separated by 55′′ on a given plate. In areas that are covered by more than one plate, however, it is possible to obtain spectra of both components of a close pair, and there are 41 pairs of quasars in the catalog with angular separation less than (six pairs with separations less than 20′′). Two pairs appear to be physically associated systems (): SDSS J025959.68+004813.6 and SDSS J030000.57+004828.0, separated by 20′′ at ; SDSS J085625.63+511137.0 and SDSS J085626.71+511117.8, separated by 22′′ at . Both of these pairs were included in Paper I.
5.9 Morphology
The SDSS photometric pipeline classifies the images of 821 catalog quasars as resolved. As one would expect, the vast majority (94%) of the extended objects have redshifts below one, but there are a number of resolved quasars at higher redshifts (the highest redshift of an extended object is 3.58). A larger fraction of the DR1 quasars are resolved (4.9%) than in the EDR sample (3.2%); this is due to the inclusion of lower luminosity AGN in the DR1 list (73% of the quasars with are resolved). The majority of the large redshift “resolved” quasars are probably measurement errors, but this sample may contains a few chance superpositions of quasars and foreground objects or possibly some small angle separation gravitational lenses.
Two unresolved (in SDSS imaging) quasars have been shown to be likely gravitational lenses: SDSS J165043.44+425149.3 (Morgan et al. 2003) and SDSS J013435.66-093102.9 (PMN J01340931; Gregg et al. 2002, Winn et al. 2002, Hall et al. 2002b). SDSS J091301.03+525928.9, a DR1 “resolved” quasar at a redshift of 1.38, is the gravitational lens SBS 0909+532 (Kochanek et al. 1997). Detailed studies of three additional DR1 resolved quasars, SDSS J090334.94+502819.3 (Johnston et al. 2003), SDSS J092455.79+021924.9 (Inada et al. 2003a), and SDSS J122608.02000602.2 (Inada et al. 2003b) suggest that they are excellent candidates for gravitational lenses.
5.10 Radio Matches
A radius of 1.5′′ was used to match DR1 quasars and FIRST (Becker, White, & Helfand 1995) sources (this is the same matching radius used in the SDSS code that selects FIRST sources for spectroscopy; see Ivezić et al. 2002 for a detailed discussion). A histogram of the SDSS/FIRST positional offsets of the 1193 matches is displayed in Figure 6. The distribution peaks at a matching radius of 0.2′′ (similar to the expected accuracy of the SDSS astrometry), and virtually all of the matches coincide to better than 1′′. Each FIRST identification can be assigned with extremely high confidence; shifting the declinations of the DR1 quasar positions by produces zero matches within a 1.5′′ radius. Ivezić et al. (2002) present an analysis of the radio properties of SDSS-selected quasars. The radio-brightest DR1 quasars that were not previously known have 20 cm peak flux densities of 700 mJy.
The number of FIRST matches considerably exceeds (by nearly a factor of two) the number of quasars selected for spectroscopy by their radio properties (the FIRST target selection flag). This occurs for two reasons: 1) the FIRST flag is set only for unresolved sources and objects brighter than , and 2) the SDSS spectroscopic targets for some plates were selected before FIRST information was available for the region.
5.11 X-Ray Matches
Matches with the ROSAT All-Sky Survey Bright (Voges et al. 1999) and Faint (Voges et al. 2000) Source Catalogs were made with a maximum allowed positional offset of 30′′. The DR1 catalog lists a total of 824 RASS matches; the positional offsets are displayed in Figure 7. The distribution, which peaks around 10′′, clearly indicates that the vast majority of identifications are correct. Changing the DR1 quasar declinations by yielded 8 and 14 matches, suggesting that spurious X-ray identifications comprise at most a few percent of catalog entries. Vignali et al. (2003a) and Anderson et al. (2003) discuss the X-ray properties of SDSS-selected quasars.
5.12 Infrared Matches
The distribution of the angular offsets for the 2260 matches to the 2MASS All-Sky Data Release Point Source Catalog is shown in Figure 8. The relatively small fraction (14%) of matches is because of the large difference in survey limits (a typical quasar at the SDSS low-redshift quasar magnitude limit will be 1–2 magnitudes fainter than the 2MASS detection level). Virtually all of the identifications are correct; the matching radius was 3′′, and 90% of the SDSS/2MASS coordinates agree to better than 1′′ (compare the 2MASS offsets with Figure 6, the angular offset distribution for the FIRST identifications, where the matches are essentially 100% accurate).
5.13 Redshift Disagreements with Previous Measurements
The redshifts of 26 quasars in this catalog disagree by more than 0.10 from the values given in the NED database; the information for each of these objects is given in Table 4. The discrepant redshifts of two of the objects in Table 4 (SDSS J002411.65004348.0 and (SDSS J120548.48+005343.8) were also noted in Paper I. In addition, Table 4 also contains the two EDR problems (the non-quasar and the 7′′ discrepancy) mentioned in §5.1. We believe that the DR1 values represent the most accurate measurements of the redshift.
5.14 Notes on Individual Objects
A quick examination of the catalog reveals a few objects that merit special comment but don’t warrant a separate publication.
SDSS J004054.65091526.8 ( = 4.98): The redshift of this weak-lined quasar is primarily based on the location of onset of the Lyman forest; the SDSS spectrum is displayed in Figure 1. Due to its proximity on the sky to the bright cluster of galaxies Abell 85 (), this object was included in the EPIC observation of the cluster (see Durret et al. 2003 for analysis of the Abell 85 EPIC data). We have analyzed these data and find a 0.5–2 keV source positionally coincident with SDSS J004054.65091526.8; the probability of a false match is only . Using the EPIC pn data and a -radius circular aperture, we measure net counts. The average effective exposure time in the aperture, accounting for vignetting, is 3580 s.
Adopting a power-law model with a photon index of and the Galactic column density, we calculate a Galactic absorption-corrected flux of erg cm-2 s-1 in the observed-frame 0.5–2 keV band. The corresponding value of the (rest-frame) 2500 Å to 2 keV power-law slope, , is (calculated following the methods of Vignali et al. 2003b). Comparison with Figure 6 of Vignali et al. (2003b) shows that this value of is consistent with those found for other SDSS radio-quiet quasars. There is no evidence that the X-ray emission from this weak-line quasar is unusual or heavily absorbed (see Fan et al. 1999); if anything, SDSS J004054.65091526.8 appears to be mildly X-ray bright given its optical flux. The angular offset between SDSS J004054.65091526.8 and the core of Abell 85 is ; given this offset, we do not expect strong lensing of SDSS J004054.65091526.8 since it lies significantly outside the cluster’s Einstein radius.
SDSS J083103.01+523533.5 (=4.44): This object was first noted by Anderson et al. (2001), and it is located only 11.4′ from the luminous BAL quasar APM 08279+5255 (Irwin et al. 1998). SDSS J083103.01+523533.5 is detected in an EPIC observation of APM 08279+5255 (see Hasinger, Schartel, & Komossa 2002 for analysis of the APM 08279+5255 EPIC data). Performing a 0.5–2 keV analysis similar to that for SDSS J004054.65091526.8, we measure net counts, a Galactic absorption-corrected flux of erg cm-2 s-1, and . The observed value is consistent with those in Figure 6 of Vignali et al. (2003b).
The SDSS Photometric Pipeline identified APM 08279+5255 (SDSS J083141.71+524517.4), but the object’s magnitude of 14.96 exceeds the maximum brightness allowed for SDSS spectroscopic observations. The DR1 quasar catalog contains two additional nearby objects: SDSS J083212.37+530327.4 and SDSS J083324.58+523954.9, located 18.7′ and 16.5′, respectively, from APM 08279+5255. The areal density of luminous, high-redshift quasars near APM 08279+5255, 10 degree-2, is quite remarkable.
SDSS J110213.69+671045.2 (): This radio-quiet quasar possesses relatively narrow (1200 km s-1) C III] emission, very strong narrow He II 1640 and O III] 1664 emission, and relatively narrow, self-absorbed C IV emission. The quasar’s spectrum is similar to those of Type II quasars (e.g., Stern et al. 2002, Zakamska et al. 2003), but with a considerably stronger continuum. An X-ray observation is probably required to determine whether this object is a partially obscured Type II quasar, or merely a normal quasar with unusually narrow lines.
SDSS J140146.53+024434.7 (=4.38): This high-redshift quasar is detected in an EPIC observation of Abell 1835 (see Peterson et al. 2001 for analysis of the Abell 1835 EPIC data). Performing a 0.5–2 keV analysis similar to that for SDSS J004054.65091526.8, we measure net counts, a Galactic absorption-corrected flux of erg cm-2 s-1, and . The observed value is consistent with those in Figure 6 of Vignali et al. (2003b), so there is no evidence that the intrinsic UV absorber apparent in the spectrum causes strong X-ray absorption. We do not expect strong lensing of SDSS J140146.53+024434.7 by Abell 1835.
6 Future Work
The 16,713 quasars were identified from 15% of the proposed SDSS survey area. The progress of the SDSS Quasar Survey can be seen in Figure 9, which displays the cumulative number of SDSS quasars as a function of observing date (for the DR1 catalog); since the closing date for DR1 observations, the SDSS has identified an additional 15,000 quasars. The publication of the next edition of the SDSS quasar catalog will coincide with SDSS Second Data Release, currently expected to occur in 2004.
References
- Abazajian et al. (2003) Abazajian, K., Adelman-McCarthy, J., Agüeros, M.A., et al. 2003, AJ, in press (astro-ph/0305492)
- Anderson et al. (2001) Anderson, S.F., Fan, X., Richards, G.T., et al. 2001, AJ, 122, 503
- Anderson et al. (2003) Anderson, S.F., Voges, W., Margon, B., et al. 2003, AJ, in press (astro-ph/0305202)
- Becker et al (1995) Becker, R.H., White, R.L., & Helfand, D.J. 1995, ApJ, 450, 559
- Bennett et al. (2003) Bennett, C.L., Bay, M., Halpern, M., et al. 2003, ApJ, 583, 1
- Blanton et al. (2003) Blanton, M.R., Lupton, R.H., Maley, F.M., Young, N., Zehavi, I., & Loveday, J. 2003, AJ, 125, 2276
- Castander et al. (2001) Castander, F.J., Nichol, R.C., Merelli, A., Burles, S., Pope, A., et al. 2001, AJ, 121, 2331
- Croom et al. (2001) Croom, S.M., Smith, R.J., Boyle, B.J., Shanks, T., Loaring, N.S., Miller, L., & Lewis, I.J., 2001, MNRAS, 322, L29
- Cutri et al. (2003) Cutri, R.M., Skrutskie, M.F., van Dyk, S., Beichman, C.A., et al. 2003, VizieR On-line Data Catalog: II/246, University of Massachusetts and Infrared Processing and Analysis Center
- Durret et al. (2003) Durret, F., Lima Neto, G.B., Forman, W., & Churazov, E. 2003, A&A, in press (astro-ph/0303486)
- Eisenstein et al. (2002) Eisenstein, D.J., Annis, J., Gunn, J.E., Szalay, A.S., et al. 2001, AJ, 122, 2267
- Fan et al. (1999) Fan, X., Strauss, M.A., Gunn, J.E., et al. 1999, ApJ, 526, L57
- Fan et al. (2001) Fan, X., Strauss, M.A., Richards, G.T., Newman, J.A., et al. 2001, AJ, 121, 31
- Fan et al. (2003) Fan, X., Strauss, M.A., Schneider, D.P., et al. 2003, AJ, 125, 1649
- Fukugita et al. (1996) Fukugita, M., Ichikawa, T., Gunn, J.E., Doi, M., Shimasaku, K., & Schneider, D.P. 1996, AJ, 111, 1748
- Gregg et al. (2002) Gregg, M., Lacy, M., White, R. Gilkman, E., Helfand, D., Becker, R., & Brotherton, M., 2002, ApJ, 564, 133
- Gunn et al. (1998) Gunn, J.E., Carr, M.A., Rockosi, C.M., Sekiguchi, M., et al. 1998, AJ, 116, 3040
- (18) Hall, P.B., Anderson, S.F., Strauss, M.A., York, D.G., et al. 2002a, ApJS, 141, 267
- (19) Hall, P.B., Richards, G.T., York, D.G., Keeton, C.R, et al. 2002b, ApJL, 575, 51
- Hasinger et al. (2002) Hasinger, G., Schartel, N., & Komossa, S. 2002, ApJ, 573, L77
- Hewett et al. (2003) Hewett, P.C., & Foltz, C.B. 2003, AJ, 125, 1784
- Hewett et al. (1995) Hewett, P.C., Foltz, C.B., & Chaffee, F.H. 1995, AJ, 109, 1498
- Hewett et al. (2001) Hewett, P.C., Foltz, C.B., & Chaffee, F.H. 2001, AJ, 122, 518
- Hogg (1999) Hogg, D.W. 1999, astro-ph/9905116
- Hogg et al. (2001) Hogg, D.W., Schlegel, D.J., Finkbeiner, D.P., & Gunn, J.E. 2001, AJ, 122, 2129
- Irwin et al. (1998) Irwin, M.J., Ibata, R.A., Lewis, G.F., Totten, E.J. 1998, ApJ, 505, 529
- Inada et al. (2003) Inada, N., Becker, R.H., Burles, S., et al. 2003a, AJ, in press (astro-ph/0304377)
- Inada et al. (2003) Inada, N., Sekiguchi, M., Anderson, S.F., Burles, S., et al. 2003b, AJ, submitted
- Ivezic et al. (2002) Ivezić, Ž., Menou, K., Knapp, G.R., et al. 2002, AJ, 124, 2364
- Johnston et al. (2003) Johnston, D.E., Richards, G.T., Frieman, J.A., et al. 2003, AJ, in press
- Kochanek et al (1997) Kochanek, C.S., Falco, E.E., Schild, R., Dobrzycki, A., Engles, D., and Hugen, H.-J. 1997, ApJ, 479, 678
- Lupton et al. (2001) Lupton, R.H., Gunn, J.E., Ivezić, Ž., Knapp, G.R., Kent, S., & Yasuda, N. 2001, in ASP Conf. Ser. 238, Astronomical Data Analysis Software and Systems, ed. F.R. Harnden, F.A. Primini, & H.E. Payne (San Francisco:ASP), 269
- Lupton, Gunn, & Szalay (1999) Lupton, R.H., Gunn, J.E., & Szalay, A. 1999, AJ, 118, 1406
- Morgan et al (2003) Morgan, N.D., Snyder, J.A., & Reens, L.H. 2003, AJ, submitted, astro-ph/0305036
- Oke & Gunn (1983) Oke, J.B., & Gunn, J.E., 1983, ApJ., 266, 713
- Peterson et al. (2001) Peterson, J.R., et al. 2001, A&A, 365, L104
- Pier, J.R. et al. (2003) Pier, J.R., Munn, J.A., Hindsley, R.B., Hennessy, G.S., Kent, S.M., Lupton, R.H., & Ivezić, Ž., 2003, AJ, 125, 1559
- Pogson (1856) Pogson, N.R., 1856, MNRAS, 17, 12
- (39) Reichard, T.A., Richards, G.T., Hall, P.B., et al. 2003b, AJ, submitted
- (40) Reichard, T.A., Richards, G.T., Schneider, D.P., et al. 2003a, AJ, 125, 1711
- Richards et al (2002) Richards, G.T., Fan, X., Newberg, H.J., et al. 2002, AJ, 123, 2945
- (42) Richards, G.T., Fan, X., Schneider, D.P., et al. 2001, AJ, 121, 2308
- Schlegel et al. (1998) Schlegel, D.J., Finkbeiner, D.P., & Davis, M. 1998, ApJ, 500, 525
- Schmidt and Green (1983) Schmidt, M., & Green, R.F. 1983, ApJ, 269, 352
- Schneider et al. (2002) Schneider, D.P., Richards, G.T., Fan, X., Hall, P.B., Strauss, M.A., Vanden Berk, D.E., Gunn, J.E., et al. 2002, AJ, 123, 567 (Paper I)
- Smith et al. (2002) Smith, J.A., et al. 2002, AJ, 123, 2121
- Spergel et al. (2003) Spergel, D.N., Verde, L., Peiris, H.V., et al. 2003, ApJ, in press (astro-ph/0302209)
- Stern et al. (2002) Stern, D., et al. 2002, ApJ, 568, 71
- Stoughton et al. (2002) Stoughton, C., Lupton, R.H., Bernardi, M., Blanton, M.R., et al. 2002, AJ, 123, 485
- Strauss et al. (2002) Strauss, M.A., et al. 2002, AJ, 124, 1810
- Tegmark et al. (2003) Tegmark, M., Blanton, M.R., Strauss, M.A., Hoyle, F.S., et al. 2003, ApJ, submitted
- Tolea et al. (2002) Tolea, A., Krolik, J.H., & Tsvetanov, Z. 2002, ApJ, 578, 31
- Vanden Berk et al. (2001) Vanden Berk, D.E., Richards, G.T., Bauer, A., Strauss, M.A., et al. 2001, AJ, 122, 549
- Vanden Berk et al. (2003) Vanden Berk, D.E., Wilhite, B.C., Kron, R.G., et al. 2003, ApJ, submitted
- (55) Vignali, C., Brandt, W.N., & Schneider, D.P. 2003a, AJ, 125, 433
- (56) Vignali, C., Brandt, W.N., Schneider, D.P., Anderson, S.F., Fan, X., Gunn, J.E., Kaspi, S., Richards, G.T., & Strauss, M.A. 2003b, AJ, 125, 2876
- Voges et al. (1999) Voges, W., et al. 1999, A & A, 349, 389
- Voges et al. (2000) Voges, W., et al. 2000, IAUC, 7432
- Winn et al. (2002) Winn, J., Lovell, J., Chen, H., Fletcher, A., Hewitt, J., Patnaik, A., & Schechter, P. 2002, ApJ, 564, 143
- York et al. (2000) York, D.G., Adelman, J., Anderson, J.E., Anderson, S.F., et al. 2000, AJ, 120, 1579
- Zakamska et al. (2003) Zakamska, N.L., Strauss, M.A., Krolik, J.H., Collinge, M.J., et al. 2003, AJ, in press


| TABLE 1 | ||
| SDSS DR1 Quasar Catalog Format | ||
| Column | Format | Description |
| 1 | A18 | SDSS DR1 Designation hhmmss.ss+ddmmss.s (J2000) |
| 2 | F11.6 | Right Ascension in decimal degrees (J2000) |
| 3 | F11.6 | Declination in decimal degrees (J2000) |
| 4 | F7.4 | Redshift |
| 5 | I2 | 0 = Pipeline Quasar 1 = Unusual Object Search |
| 6 | F7.3 | PSF magnitude (not corrected for Galactic absorption) |
| 7 | F6.3 | Error in PSF magnitude |
| 8 | F7.3 | PSF magnitude (not corrected for Galactic absorption) |
| 9 | F6.3 | Error in PSF magnitude |
| 10 | F7.3 | PSF magnitude (not corrected for Galactic absorption) |
| 11 | F6.3 | Error in PSF magnitude |
| 12 | F7.3 | PSF magnitude (not corrected for Galactic absorption) |
| 13 | F6.3 | Error in PSF magnitude |
| 14 | F7.3 | PSF magnitude (not corrected for Galactic absorption) |
| 15 | F6.3 | Error in PSF magnitude |
| 16 | F7.3 | Galactic absorption in band |
| 17 | F7.3 | FIRST peak flux density at 20 cm expressed as AB magnitude; |
| 0.0 is no detection, source is not in FIRST area | ||
| 18 | F8.3 | S/N of FIRST flux density |
| 19 | F7.3 | SDSS-FIRST separation in arc seconds |
| 20 | F8.3 | log RASS full band count rate; 0.0 is no detection |
| 21 | F7.3 | S/N of RASS count rate |
| 22 | F7.3 | SDSS-RASS separation in arc seconds |
| 23 | F7.3 | magnitude (2MASS); 0.0 indicates no 2MASS detection |
| 24 | F6.3 | Error in magnitude (2MASS) |
| 25 | F7.3 | magnitude (2MASS); 0.0 indicates no 2MASS detection |
| 26 | F6.3 | Error in magnitude (2MASS) |
| 27 | F7.3 | magnitude (2MASS); 0.0 indicates no 2MASS detection |
| 28 | F6.3 | Error in magnitude (2MASS) |
| 29 | F7.3 | SDSS-2MASS separation in arc seconds |
| TABLE 1 | ||
| SDSS DR1 Quasar Catalog Format (Continued) | ||
| Column | Format | Description |
| 30 | F8.3 | ( = 70 km s-1 Mpc-1, , , |
| 31 | I3 | Morphology flag 0 = point source 1 = extended |
| 32 | I3 | Quasar Target Selection Algorithm used for spectroscopy |
| 33 | I3 | TARGET Spectroscopic Target flag: Low- Quasar (0 or 1) |
| 34 | I3 | TARGET Spectroscopic Target flag: High- Quasar (0 or 1) |
| 35 | I3 | TARGET Spectroscopic Target flag: FIRST (0 or 1) |
| 36 | I3 | TARGET Spectroscopic Target flag: ROSAT (0 or 1) |
| 37 | I3 | TARGET Spectroscopic Target flag: Serendipity (0 or 1) |
| 38 | I3 | TARGET Spectroscopic Target flag: Star (0 or 1) |
| 39 | I3 | TARGET Spectroscopic Target flag: Galaxy (0 or 1) |
| 40 | I3 | BEST Spectroscopic Target flag: Low- Quasar (0 or 1) |
| 41 | I3 | BEST Spectroscopic Target flag: High- Quasar (0 or 1) |
| 42 | I3 | BEST Spectroscopic Target flag: FIRST (0 or 1) |
| 43 | I3 | BEST Spectroscopic Target flag: ROSAT (0 or 1) |
| 44 | I3 | BEST Spectroscopic Target flag: Serendipity (0 or 1) |
| 45 | I3 | BEST Spectroscopic Target flag: Star (0 or 1) |
| 46 | I3 | BEST Spectroscopic Target flag: Galaxy (0 or 1) |
| 47 | I6 | SDSS Imaging Run Number of photometric measurements |
| 48 | I6 | Modified Julian Date of imaging observation |
| 49 | I6 | Modified Julian Date of spectroscopic observation |
| 50 | I5 | Spectroscopic Plate Number |
| 51 | I5 | Spectroscopic Fiber Number |
| 52 | 1X, A25 | Object Name for previously known quasars |
| “SDSS” designates previously published SDSS object | ||
| TABLE 2 |
| The SDSS Quasar Catalog II222 The complete version of this table is in the electronic edition of the Astronomical Journal and at http://www.sdss.org/dr1/products/valueadded/qsocatdr1.html. The catalog contains 52 columns of information on 16,713 quasars. |
| TABLE 3 | ||||
| Spectroscopic Target Selection | ||||
| TARGET | TARGET | BEST | BEST | |
| Sole | Sole | |||
| Class | Selected | Selection | Selected | Selection |
| Low- | 11707 | 4322 | 10174 | 3263 |
| High- | 2062 | 990 | 2717 | 428 |
| FIRST | 720 | 48 | 659 | 40 |
| ROSAT | 878 | 58 | 979 | 114 |
| Serendipity | 10066 | 3399 | 9238 | 3637 |
| Star | 932 | 42 | 150 | 37 |
| Galaxy | 114 | 25 | 142 | 16 |
| TABLE 4 | |||
| Discrepant Redshifts | |||
| Quasar (SDSS) | NED Object Name/Notes | ||
| J002411.65004348.0 | 1.79 | LBQS 0021-0100 | |
| J004705.83004819.5 | … | From EDR; not a quasar | |
| J012428.10001118.4 | 1.73 | SDSS | |
| J014905.28011405.0 | 2.10 | SDSS | |
| J015032.88+143425.5 | 4.27 | SDSS | |
| J023044.81004658.0 | 0.92 | SDSS | |
| J033305.32053708.9 | 4.22 | SDSS | |
| J083223.22+491320.9 | 1.26 | [HB89] 0828+493 | |
| J084957.98+510829.0 | 0.58 | SBS 0846+513 | |
| J092004.31+591732.6 | 1.29 | SBS 0916+595 | |
| J093052.25+003458.8 | 1.77 | [HB89] 0928+008 | |
| J094031.07+551001.7 | 1.33 | SBS 0936+553B | |
| J094443.08+580953.2 | 0.56 | SBS 0941+583 | |
| J095723.69+011458.7 | 2.48 | 2QZ J095723.6+011458 | |
| J101139.85+004039.4 | 1.71 | 2QZ J101139.8+004039 | |
| J101211.62+003719.3 | 1.63 | 2QZ J101211.6+003719 | |
| J114534.12+010308.0 | 1.07 | SDSS | |
| J115024.80+015620.3 | 0.71 | PMN J1150+0156 | |
| J120015.35+000553.1 | 1.65 | SDSS | |
| J120548.48+005343.8 | 0.93 | [HB89] 1203+011 | |
| J123113.95021703.0 | 0.76 | [HB89] 1228-020 | |
| J133121.81+000248.4 | 3.22 | 2QZ J133121.8+000249 | |
| J140848.81+650528.0 | 1.94 | 87GB 140735.5+651947 | |
| J151307.26000559.3 | 2.03 | SDSS | |
| J171528.24+550038.8 | 0.74 | SDSS | |
| J171930.24+584804.7 | 2.08 | SDSS | |
| J172542.16+582110.5 | … | Replaces EDR 172543.02+582110.8 | |
| J231324.45+003444.5 | 2.08 | H 2310+0018 | |