email: [kraiberg,pvdwerf,jaffe]@strw.leidenuniv.nl
A Submillimetre Selected Quasar in the Field of Abell478 ††thanks: Based on observations made with ESO Telescopes at the Paranal Observatory under programme IDs 63.O-0087 and 68.A-0111. Also based on observations with ISO, an ESA project with instruments funded by ESA member states (especially the PI countries: the Netherlands, the United Kingdom, Germany, and France) with the participation of ISAS and NASA.
We present the discovery of a dusty quasar, SMM J04135+10277, located behind the galaxy cluster Abell 478. The quasar was discovered as the brightest source in a submillimetre survey of high redshift galaxies lensed by foreground rich clusters of galaxies in a project aimed at studying the cosmic star formation history of dusty galaxies. With submillimetre fluxes of and this object is one of the brightest submillimetre sources known. Optical imaging revealed a point source with (corrected for galactic extinction). Follow-up optical spectroscopy showed this object to be a quasar at redshift . The quasar was also detected at shorter infrared wavelengths with the Infrared Space Observatory. This object is the first quasar discovered by its submillimetre emission. Given the general lack of overlap between deep submillimetre and X-ray samples, usually interpreted as a low incidence of active nuclei in submillimetre samples, this is an unusual object. Analysis of number counts of quasars and of submillimetre galaxies bears out this suggestion. We compare the properties of SMM J04135+10277 to those of optically selected quasars with submillimetre emission, and argue that the optical faintness results from a large viewing angle with the direction of relativistic beaming, and not from abnormally high extinction. We also find indications that the bulk of the submillimetre flux density is not powered by the quasar nucleus. This conclusion is supported by analysis of the infrared spectral energy distribution. These results are consistent with previous observations that quasars at higher redshift tend to have a more prominent cold dust component, most likely powered by extended star formation in the host galaxy. The temperature for the cold dust component is found be when assuming for a modified blackbody. The quasar is found to have a total infrared luminosity of , dominated by the emission from cool dust.
Key Words.:
Quasars: individual: SMM J04135+10277 – Infrared: galaxies – Submillimetre1 Introduction
Major advances in submillimetre (submm) continuum observations came with the Submillimetre Common-User Bolometer Array (SCUBA, Holland et al. Holland (1999)), which is mounted at the 15 m James Clerk Maxwell Telescope (JCMT) at Mauna Kea, Hawaii. This dual-channel instrument for the first time allowed sensitive mapping, making it possible to survey larger areas of the sky to greater depths than previously possible at submm wavelengths. This development led to the discovery of a new class of objects of high infrared (IR) luminosity, located at cosmological distances (e.g., Smail et al. Smail (1997)). Even though these objects are less common than Lyman-break galaxies at similar redshifts, they would dominate the cosmic star formation rate density at these redshifts, if star formation is indeed the source of their high luminosity (e.g., Blain et al. Blainetal99 (1999)). Since the importance of these objects was realized, a number of submm surveys have been performed or are in progress (e.g. Smail et al. SIBK (2002) ; Eales et al. Eales (1999); Scott et al. scott (2002); Chapman et al. chapman_lens (2002); Knudsen et al. in prep.). One of the biggest challenges for those surveys has turned out to be the follow-up observations and the identification of the counterparts causing the submm emission. As a result, the determination of the nature and redshift of these objects has been significantly hampered. While currently more than a hundred submm sources have been detected, less than 20 of these have reliably been identified with sources at other wavelengths, in spite of painstaking attempts. The number of published spectroscopic redshifts is even significantly smaller. The majority of the reliably identified counterparts are very or extremely red objects (e.g., Frayer et al. smmj00266 (2000); Smail et al. smail_smmero (1999)); several are also exhibiting active galactic nuclei (AGN) features in their spectra (Ivison et al. smmj02399 (1999)). Because of the small number of secure identifications, any new identification adds important information to our understanding of the submm population. A survey with different selection criteria, radio-preselected and submm-detected, has produced 10 spectroscopic redshifts in a sample of 34 sources (Chapman et al. chapman_nat (2003)).
We are carrying out an extensive SCUBA survey of a number of galaxy clusters fields, aimed at detecting gravitationally amplified background galaxies: the Leiden-SCUBA Lensed Survey (Knudsen et al. in prep.). In the course of doing the optical identifications and follow-up of this survey we discovered one of our submm sources to be a previously unknown type-1 quasar (previously reported in Knudsen et al. knudsen00 (2001)). While submm surveys of optically selected quasars have been quite succesful (Isaak et al. Isaak (2002)), this object is the first type-1 quasar first discovered by its submm emission. In contrast, type-2 quasars have been detected in small numbers in other submillimetre surveys (e.g. SMM J02399-0136, Vernet & Cimatti vernet (2002)), and IRAS-radio-optical quasars have been selected before at a wide range of redshifts (e.g. APM 08279+5255 in Irwin et al. irwin (1998)). In this paper we present the observations of the quasar. We discuss unusual properties of the object, its optical spectrum, and its IR spectral energy distribution, and compare the results to optically selected quasars. We adopt an and cosmology with .
2 Observations and results
2.1 Submillimetre data
The SCUBA data of the galaxy cluster Abell 478 have been obtained during five nights in September and December 1997, March 1998 and December 1999. The first data were obtained in a program to study the cooling flow in the cluster itself. In these data a bright point source was detected. Consequently, extra data was obtained to study this object better. The total integration time was 6.6 hours (excluding overheads), recording data at both 850 and 450 simultaneously in jiggle-map mode. The data were obtained mostly under good conditions with 850 zenith atmospheric opacity typically around 0.2. The pointing was checked regularly and was found to be stable. Calibration maps of CRL618 were also obtained. The data were reduced using the SURF (SCUBA User Reduction Facility) and KAPPA software packages (Jenness & Lightfoot surf (1998)). The resulting images have an angular resolution of at m and at m.
Source extraction and estimation of the uncertainties were carried out using a method based on Mexican Hat wavelets (Cayón et al. mexhat (2000); Barnard et al. in prep; Knudsen et al. in prep), which was adopted for the entire Leiden-SCUBA Lensed Survey, and which will be described in a forthcoming publication (Knudsen et al. in prep.), where the full survey will be presented. This method was adopted because it is mathematically rigorous and its performance on SCUBA jiggle maps can be fully characterized. Monte Carlo simulations have been performed to determine the noise and uncertainties of the derived parameters. The area-weighted noiselevels of the maps are 2 mJy at and 14 mJy at .
In the map four sources were detected of which the brightest has a flux of . This is the only source in the map with detected emission, . It was detected with a signal-to-noise of 15, for which the formal positional uncertainty including the pointing uncertainty of the JCMT is . This is the object SMM J04135+10277 for which we are here presenting the follow-up observations. Fluxes and positions are presented in Table 1.
2.2 Optical identification
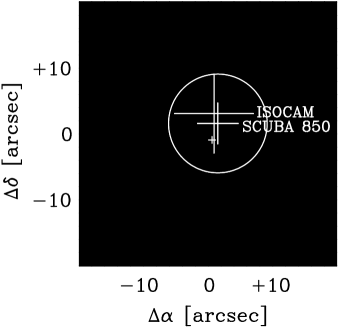
For identification and redshift determination of the SCUBA source(s) optical imaging and spectroscopy was obtained with FORS1 at VLT-UT1 (Antu) in Chile, in September 1999. Four 15 min exposures in band were aquired in photometric conditions. The frames were bias-subtracted, flatfielded and stacked. The resulting image is shown in Fig. 1 with the SCUBA contours overlayed. The seeing measured in the final image is . The standard star field PG0231+051 (Landolt landolt (1992)) was used for the calibration. The source detection and photometry was performed using SExtractor (Bertin & Arnouts SEx (1996)). The center of SMM J04135+10277 is coincident with an point source at , (J2000). There are no other apparent candidate counterparts. The optical position is within the error circle of the submm observation. One of the other SCUBA sources (SMM J04134+10270) coincides with a galaxy, which, given its size and magnitude, is a probable cluster member. There are no obvious candidate counterparts for the two other SCUBA sources. Using the DIRBE/FIRAS maps (Schlegel et al. dustmaps (1998)), a Galactic reddening is derived — a substantial reddening. The corrected magnitude of the optical counterpart for SMM J04135+10277 is thus .

2.3 Optical spectroscopy
FORS1 spectroscopy of SCUBA sources in the A478 field was also obtained in September 1999. We used FORS1 in Multi-Object Spectroscopy (MOS) mode to obtain spectra of a number of targets, using grism 150I+17, without order sorting filter. This setup gives a spectral resolution of 260 at 720 nm with the slit which we employed. Overlap of the second spectral order may affect the wavelength region longwards of 650 nm, but was in the present case found not to affect the spectra. Two exposures of 1800 sec were obtained in a seeing of . The spectra were bias-subtracted and flatfielded. Wavelength calibration was achieved using exposures of He and Ar lamps. Correction for telluric absorption and flux calibration was carried out using observations of the white dwarf EG274 (), which we corrected for photospheric absorption features. The multislit mask included both the bright SCUBA source SMM J04135+10277 and the fainter SCUBA source SMM J04134+10270. The extracted spectra were corrected for galactic foreground absorption using the DIRBE/FIRAS maps.
The optical spectrum of SMM J04135+10277 (Fig. 2) shows broad emission lines, of which the four most prominent can be identified with Ly+N v, Si iv+O iv], C iv and C iii. In addition the spectrum shows a power-law continuum. All of these features are characteristic of quasars. Bluewards of the Ly emission line, Ly forest absorption is seen. We use the C iii, C iv and the Si iv+O iv] lines, with the largest weight on the symmetric C iii line, to determine the redshift. We find the value , consistently for the peak value of all three profiles.
The spectrum of SMM J04134+10270 confirms its membership of the A478 cluster. It shows the characteristic spectrum of a quiescent elliptical galaxy with no evidence for nuclear activity. This source will be discussed together with the rest of the survey in Knudsen et al. (in prep.).
2.4 Near-infrared spectroscopy
Since restframe ultraviolet emission lines of quasars can be significantly blueshifted with respect to the systemic velocity (e.g., Carswell et al. Carswell (1991)), we also attempted to obtain additional redshift information using restframe optical lines. Unfortunately, at , the brightest lines (H, H, [O iii] 5007 Å) are all in wavelength regions where the earth atmosphere is opaque. We therefore concentrated on the [O ii] 3727 Å line which is redshifted to the blue edge of the H-band window, a region strongly affected by atmospheric absorption lines.
We used ISAAC on VLT-UT1 (Antu) in February 2002, to take H-band spectra of SMM J04135+10277. We used the medium resolution grating with a slit to obtain an spectrum between 1.41 and m, which should contain the [O ii] line for redshifts between 2.78 and 3.00. In addition, we obtained a low-resolution spectrum () of the entire H-band, in an attempt to detect H, which although intrinsically faint, should at least lie in a clear part of the spectrum. Both spectra were obtained in photometric conditions and in an optical seeing of , by nodding the object along the slit. Total integration time was 44 minutes in both spectra. The individual frames were pairwise subtracted in order to remove the bright OH nightsky lines, flatfielded and coadded. Wavelength calibration was derived from the OH nightsky lines. Correction for telluric absorption and flux calibration were achieved using the B5V star Hip25499 (H=5.62) and the B2V star Hip28142 (H=7.497), corrected for photospheric absorption. Unfortunately, while the continuum of the quasar is clearly detected in both spectra, no emission features are seen. Undoubtedly, this is due to atmospheric absorptions in the region of the redshifted [O ii] line, and the faintness of the relevant features in the rest of the H-band spectrum.
| passband | RA(J2000) | Dec(J2000) | |
|---|---|---|---|
| 04:13:27.2 | +10:27:43 | ||
| 04:13:27.2 | +10:27:42 | ||
| 04:13:27.24 | +10:27:44.5 | ||
| 04:13:27.88 | +10:27:43 | ||
| 04:13:27.28 | +10:27:41.4 | ||
| 04:13:27.26 | +10:27:40.5 | ||
2.5 ISO data
We also inspected the archive of the Infrared Space Observatory (ISO, Kessler et al. ISO (1996)) and extracted observations of A478 using both the mid-infrared camera (CAM, Cesarsky et al. CAM (1996)) and the mid/far-infrared photometer (PHOT, Lemke et al. PHOT (1996)).
The PHOT data were obtained using the P22 raster mode at m, with pixels, on February 21, 1998. The data were reduced using the PHOT Interactive Analysis (Gabriel et al. PIA (1997)). Initial data reduction steps included discarding of corrupted data, non-linearity correction, and deglitching of individual ramps. After fitting all integration ramps with a first order polynomial, further deglitching and data editing, and dark current subtraction, the data were corrected for detector drifts and for vignetting, and calibrated using the internal Fine Calibration Sources. The resulting image shows a Jy source, the centroid of which is however displaced by from SMM J04135+10277. This displacement is less than the ISO angular resolution at m, but much more than the nominal ISO pointing uncertainty of . While the centroid of a faint source can be displaced somewhat when placed on top of a highly structured background, in the present case the offset is so large that the m detection cannot reliably be associated with the quasar. Hence in the following we label this as an upper limit.
The CAM data were obtained using the LW3 filter (effective wavelength m) on February 21, 1998, and using the LW2 filter (effective wavelength m) on March 21, 1998 using the CAM01 raster observing mode with pixels. The data were reduced using the CAM Interactive Analysis package (Ott et al. CIA (1997)). Processing steps consisted of dark current subtraction, deglitching and correction of transients using the PRETI method (Aussel et al. Aussel (1999)), which is particularly suited for the detection of faint sources, flatfielding using a flatfield derived from the stacked dataframes, and mosaic contruction taking into account the image distortion. This resulted in clear detections of SMM J04135+10277 at m with a flux density of Jy, and at m with a flux density of Jy. Positions of these sources are listed in Table 1.
2.6 CO emission
In a recent commisioning project of the new COBRA spectrometer on the Owens Vally Radio Observatory, the CO emission line has been detected from the quasar. This detection confirms the nature of SMM J04135+10277 as a hyperluminous IR quasar. The redshift implied by the CO line is , which is indeed somewhat higher than the optically determined redshift. This result will be discussed in detail in Hainline et al. (in prep).
3 Discussion
3.1 SMM J04135+10277 and the optical quasar population
Only little is known about the importance of AGNs in the submm population. Most studies comparing X-ray and submm observations conclude that the submm population is powered by star formation rather than AGNs and especially quasars (e.g., Almaini et al. almaini (2003)), based on the lack of overlap of X-ray and submm sources in deep studies. This has been confirmed in a study combining very deep Chandra observations with SCUBA observations of the HDF-N, where Alexander et al. (alexander (2002)) found that a significant fraction of bright submm sources () harbour an AGN, however, the AGN is not powerful enough to power the submm emission. This makes SMM J04135+10277 a particularly interesting object, since here we have a bright submm source that is unequivocally identified with a type-1 quasar. Given what is known about the abundance of type-1 quasars, is this an ordinary object that we should have expected to find in our survey, or are we dealing with an exceptional case? We here estimate the probability of finding a high redshift submm emitting quasar in our survey. The total area of our survey is (Knudsen et al., in prep.). Using the optical spectrum we estimate that the quasar has a magnitude . Based on the counts of Kennefick et al. (Kennefick (1997)), we find that there is only a 20% probability of finding a quasar with and in our survey. Furthermore, the probability that such a quasar is a bright submm source is also less than unity, as shown by Priddey et al. (Priddey (2002)), who did a submm study of optically selected quasars at . For the sub-sample of quasars with , only 30% of these had detectable submm emission down to 6.8 mJy and all of those are fainter than SMM J04135+10277. Combining the numbers we estimate only a 6% chance of detecting a submm bright quasar at in our survey, if that quasar was drawn from the population of optically selected quasars.
We also estimate the expected number of bright submm sources in the surveyed area, regardless of their physical nature. According to the number counts from Smail et al. (SIBK (2002)) we should expect to find two sources with m fluxes between 20 and 25 mJy. Our observations (Knudsen et al., in prep.) are in agreement with that number. Comparing this to the small chance of finding a high redshift submm emitting quasar in our survey, this result suggests that the bright part of the submm population does not originate from dusty quasars, and that SMM J04135+10277 is an unusual object.
3.2 Optical spectrum
Since SMM J04135+10277 is the first quasar selected based on its submm emission, it is of interest to compare its properties to those of optically selected quasars. Turning first to the optical spectrum, the shapes of the C iii, C iv and the Si iv+O iv] lines appear as expected. However, the Ly +N v emission line has a more unexpected shape. The peak and blue wing appear to be absorbed. Furthermore, the strength of the line relative to the other emission lines is unusually low for a quasar. Since dust is present in this quasar, it is natural to assume that atomic hydrogen will also be present, so that associated absorption may play a role in suppressing the Ly emission. However, for a more detailed assessment of this effect, a higher resolution spectrum is needed. Comparing the optical spectrum of SMM J04135+10277 to that of quasars selected at other wavelengths (see e.g. Francis et al. (Fran92 (1992)) for a composite spectrum), there are no significant differences except for the suppressed Ly emission.
We note that SMM J04135+10277 belongs to the optically fainter part of the quasar population. Can this be the effect of strong absorption by dust, which would then simultaneously account for the luminous dust emission from SMM J04135+10277? We obtain a measure of the isotropic luminosity of the quasar nucleus using the C iv emission line; obviously, the Ly line cannot be used since it appears to be absorbed, and the continuum cannot be used because of the effects of relativistic beaming, which cannot reliably be quantified. The observed flux of the C iv line is erg s-1 cm-2. A comparison sample can be constructed from the optically selected submm emitting quasars studied by Priddey et al. (Priddey (2002)), using the spectra from Hagen et al. (Hagen (1999)). This comparison sample covers redshifts from 2.60 to 2.79 and can therefore be compared directly to SMM J04135+10277. The comparison sample has C iv fluxes from 1.7 to erg s-1 cm-2, roughly a factor of 3 higher than SMM J04135+10277. The rest-frame equivalent width of C iv on the other hand shows the opposite trend: while SMM J04135+10277 has a C iv restframe equivalent width of Å, values in the comparison sample are approximately a factor of 10 lower, ranging from 13 to Å. In other words, the quasar continuum is fainter by about a factor of 30 than would be expected for its C iv flux. It is highly unlikely that extinction could account for this, since the quasar continuum and the broad line region should be viewed through approximately the same obscuring column. Furthermore, as Fig. 2 shows, the quasar continuum is characterized by a blue power law. The slope of this continuum does not indicate the presence of abnormally large absorption. Therefore a more likely explanation of the optical faintness of this quasar is a large viewing angle away from the direction of relativistic beaming. The beamed flux density is proportional to with , where the Doppler factor , where is the bulk velocity in units of the speed of light, and is the corresponding Lorentz factor, and is the angle away from the beam (Urry & Padovani UrryPadovani (1995)). Therefore a decrease in of a factor 2.3 would be sufficient to produce a factor 30 decrease in the beamed continuum with respect to the lines. The required angle away from the beam cannot be calculated since is not known. However, as shown by Urry & Padovani (UrryPadovani (1995)), variations in of this magnitude are entirely reasonable for angles , provided . This estimate confirms the viability of our suggestion that the optical faintness of the quasar is due to a large viewing angle away from the direction of relativistic beaming, and not to abnormally large extinction. If in fact the optical spectrum is still dominated by the doppler boosted jet then our detection of this one object suggests that a much larger number of yet unidentified sources are similar AGNs viewed from a larger angle to the jet axis. We finally note that it would be interesting to make the same comparison with low- far-IR detected quasars, addressing also the properties of the dust emssion spectrum. This comparison would require spectrophotometry of quasars in the vacuum ultraviolet.
Going further, we can investigate whether the observed submm emission from SMM J04135+10277 is likely powered by the AGN or whether the presence of an additional power source is indicated. In the comparison sample, the observed m fluxes range from 6.8 to 10.0 mJy, increasing monotonically with C iv flux. The three times fainter C iv flux of SMM 04135+10277 thus would suggest an AGN-powered m flux of approximately 3 mJy. The observed flux is almost a factor of 10 higher. This result suggests that the bulk of the submm emission from SMM 04135+10277 is not powered by the AGN but by an additional source of energy, most likely vigorous star formation in the host galaxy. If this interpretation is correct, high resolution imaging of CO lines and dust emission with ALMA should reveal an extended source.

3.3 Gravitational magnification
The low redshift () of A478 is far from the optimal lensing redshift (), and no arcs are detected in the vicinity of the quasar. This suggests that the gravitational magnification is small and that the quasar is not subject to differential lensing, which otherwise would influence the shape of the spectral energy distribution (SED). We calculate the magnification of the quasar using LENSTOOL (Kneib et al. lenstool (1993)). The cluster is modelled using two components: the overall cluster potential with a core radius and a velocity dispersion and the potential of the cD galaxy with and (Allen et al. A478numbers1 (1993); Zabludoff et al. A478numbers2 (1990)). We find that the quasar is magnified by a factor of 1.3. Hence, all fluxes should be corrected for this value. In all calculations in the following sections of this paper the fluxes have been corrected for the gravitational lensing.
3.4 Spectral energy distribution
From archival data from the NRAO Very Large Array a radio source near the position of the SMM J04135+10277 was found. The fluxes measured are and () (M. Yun, private comm.). Based on this low radio flux, it is concluded that the quasar is radio-quiet (according to the radio-power criterion given by Stocke et al. stocke (1992) to divide quasars into radio-loud and radio-quiet types). Hence, the non-thermal contribution to the submm flux is expected to be small and is here neglected.
Combined, we have then six points on the SED and two upper limits, ranging from the radio to the optical regime (see Table 1). The SCUBA points and the two ISO points at and are in the rest frame all at wavelengths typical for thermal emission by dust. The ISO point in rest frame is , which together with the optical point is expected to originate from stellar light, possibly contaminated with non-thermal emission from the AGN. The radio emission is attributed to non-thermal synchrotron emission.
In the following we will focus on the thermal dust emission. Of the thermal emission, the two SCUBA points are most likely due to the cool dust typically described by a modified blackbody, whereas the point arises from a hot component. The shape of the SED between the cold and hot component seems to be different for different quasars (see e.g. Haas et al. haas_pg (2000)). We have no measurements between and , which makes an analysis of the IR SED difficult. We do, however, attempt to make a tentative analysis in which we compare with known objects and also estimate parameters like temperature and luminosity.
We first compare the quasar with other known quasars. Comparing to high- quasars is not trivial, since the high- quasars which have well-sampled IR SEDs, are often strongly lensed and their observed SEDs may have suffered differential lensing. We therefore first focus on low- quasars. Haas et al. (haas_pg (2000)) have made a detailed study of the IR SED of Palomar-Green (PG) quasars. The majority of these quasars are at fairly low redshift. We compare to three low- PG quasars with well-sampled SEDs, PG 0050+124, PG 1206+439 and PG1613+638 (all shown in Fig. 3). All three SEDs are redshifted to . If the SEDs are scaled to the quasar point, the comparison gives the impression of a deficit in the mid/near-IR emission of SMM J04135+10277. Alternatively, inspired by the findings of Archibald et al. (2001) and Page et al. (2001), that the star formation rate observed in AGNs is higher at higher redshift, leading to enhanced long-wavelength emission at higher redshift, we may choose instead to scale the low- SEDs to the observed point, i.e., the hot dust emission associated with the AGN. This, not unexpectedly, then suggests an excess in the far-IR-submm emission from SMM J04135+10277. This result corroborates our earlier conclusion that a significant portion of the observed m emission of SMM J04135+10277 results from extended star formation, and is not powered directly by the AGN. The SED of the strongly lensed quasar APM 08279+5255 (Lewis et al. lewis (1998) and references therein) is also shown in Fig. 3. It has also been appropriately shifted and scaled to the point. In this case the submm/FIR deficit relative to the SMM J04135+10277 is even more pronounced, corroborating the discussion above.
Given this result, it is also of interest to compare the SED of SMM J04135+10277 to the SEDs of well-studied starburst galaxies. We use the SEDs of the starburst galaxy NGC 253 and the ultraluminous infrared galaxy (ULIRG) NGC 6240 (extracted from the NASA Extragalactic Database), redshifted to , for comparison. Scaled to the point, the far-IR/submm range matches quite well, whereas the mid/near-IR emission is much brighter for SMM J04135+10277. This result is expected, as starbursts are known not to have the hot dust component that is characteristic of AGNs, especially quasars (Sanders et al. Sanders (1989); Barvainis Barvainis (1987)). Considering that the SED of the quasar is not well-sampled, and that we are looking at only one quasar, no definite conclusions can be drawn about the precise shape of the IR SED and the power source of the dust emission of SMM 04135+10277 in particular, or of the submm-selected quasar population in general. Tentatively, though, these observations support the suggestion that quasars at higher redshift have a high submm and far-IR flux, suggesting a higher star formation rate. To study this in detail, however, observations filling the big gaps in the IR SED are needed. Such data can possibly be obtained with SIRTF.


Finally, we calculate the dust temperature, dust mass, and total luminosity in dust emission of SMM J04135+10277. For the dust emission, we use blackbody emission, modified by the frequency-dependent mass absorption coefficient
| (1) |
using the average value from the literature at m (see Hughes et al. 1997 for a discussion of the assumptions and uncertainties in this parameter) and assume . Since the IR SED cannot be fit by a single modified blackbody, we first fit the cold dust component sampled by the SCUBA points. Using only the SCUBA points, we find a temperature and a dust mass of for the cold dust component. The total luminosity of a modified blackbody spectrum can be calculated using the following analytical expression:
| (2) |
where and are Planck’s respectively Boltzmann’s constants, is the luminosity distance, and the two last factors are the Gamma function and Riemann’s zeta function. is the flux density at the observing frequency, and is the corresponding rest frequency. The total luminosity of the cold component is found to be . To estimate the total IR luminosity, we assume a powerlaw between the peak of the modified blackbody curve and the observed point. The powerlaw is integrated from (observed frame), where the modified blackbody and the powerlaw balance eachother, to with the result of . In total the IR luminosity (corrected for gravitational amplification) is then , dominated by the cold dust component. Using a different method based on the analysis in Blain et al. (blain03 (2003)), where the whole IR SED is fit with a single temperature modified blackbody with a powerlaw on the Wien side ranging all the way into the mid-IR, a temperature of 38 K is found and a total IR luminosity of . This gives a higher temperature, though a slightly lower luminosity, compared to the fit above where a cold component was fitted to the two SCUBA points.
The temperature as we find is lower than that found in other high- quasars such as APM 08279+5255, which has a temperature of K determined for a pure blackbody (Lewis et al. lewis (1998)), or BR 12020725, which has a dust temperature of K (Leech et al. leech (2001)). Both quasars have luminosities in order of , thus brighter than SMM J04135+10277, so that higher dust temperatures might be expected. On the other hand, these two quasars are strongly lensed and it is possible that differential lensing distorts the integrated SED and overemphasizes warm dust components.
We finally attempt to compare the radio-submm flux density ratio with the relevant simulations performed by Blain (blain (1999)), which are based on the IR-radio correlation observed at low redshift. As we do not have a 1.4 GHz flux density measurement, we estimate it by assuming that the radio SED is a power law, , with slope and scale it to the observed flux density at 4.86 GHz. We find (not corrected for the gravitational lensing). Still assuming , we use Fig. 4 in Blain (blain (1999)) by interpolating between his two models with respectively . For this gives a flux density ratio of between GHz and m of . Therefore, the observed m flux would imply if the quasar strictly followed the local IR-radio correlation. This number is however a factor lower than what we had just estimated based above. This indicates that SMM J04135+10277 has more radio emission (for its IR emission) than e.g., the ULIRG Arp220, which was used for the template SED in Blain (1999). This result is not surprising, as quasar radio emission is powered by both the synschrotron emission from stellar remnants and the synchrotron emission from the central black hole.
4 Conclusions
We have discovered a type-1 quasar behind the cluster of galaxies A478. The quasar, SMM J04135+10277, was discovered by it submm emission. The quasar has a redshift of and is radio quiet. The quasar is optically faint, but has a large submm flux. Using number counts of quasars and of submm sources, we argue that SMM 04135+10277 is an unusual object. It is in any case a remarkable object since there is little overlap between deep submm and X-ray samples, suggesting that the incidence of powerful AGNs among submm galaxies is low. The slope of the rest-frame UV continuum is similar to that of optically selected quasars (Francis et al. Fran92 (1992)) and does not exhibit any signs of extraordinary dust extinction. This leads us to suggest that the line of sight to the quasar nucleus is not abnormally obscured. Analysis of optical continuum, spectral lines and submm emission leads us to conclude that the optical faintness of the quasar results from a large viewing angle from the direction of relativistic beaming, and that a significant amount of the submm flux is not powered by the active nucleus. More likely the cold dust is heated by a high rate of star formation in the environment surrounding the quasar. Comparison of the sparsely sampled IR SED to that of other objects tentatively supports this conclusion. The total IR luminosity is found to be and is dominated by the emission from cool dust.
Acknowledgements.
We thank Remo Tilanus for taking most of the SCUBA data presented in this paper, Min Yun for providing us with the VLA archive data, and Jean-Paul Kneib for making his LENSTOOL program available for us. We also thank the referee, Andrew Blain, for useful comments. KKK is supported by the Netherlands Organization for Scientific Research (NWO). The JCMT is operated by the Joint Astronomy Centre on behalf of the United Kingdom Particle Physics and Astronomy Research Council (PPARC), the Netherlands Organization for Scientific Research, and the National Research Council of Canada. The National Radio Astronomy Observatory is a facility of the National Science Foundation, operated under cooperative agreement by Associated Universities, Inc. This research has made use of the NASA/IPAC Extragalactic Database (NED) which is operated by the Jet Propulsion Laboratory, California Institute of Technology, under contract with the National Aeronautics and Space Administration. The ISOCAM data presented in this paper was analysed using “CIA”, a joint development by the ESA Astrophysics Division and the ISOCAM Consortium. The ISOCAM Consortium is led by the ISOCAM PI, C. Cesarsky. The ISOPHOT data presented in this paper was reduced using PIA, which is a joint development by the ESA Astrophysics Division and the ISOPHOT consortium, with the collaboration of the Infrared Analysis and Processing Center (IPAC) and the Instituto de Astrof sica de Canarias (IAC).References
- (1) Alexander, D.M., Bauer, F.E., Brandt, W.N., et al., 2003, AJ, 125, 383
- (2) Allen, S.W., Fabian, A.C., Johnstone, R.M., et al., 1993, MNRAS, 262, 910
- (3) Almaini, O., Scott, S.E., Dunlop, J.S., et al., 2003, MNRAS, 338, 303
- (4) Archibald, E.N., Dunlop, J.S., Hughes, D.H., et al., 2001, MNRAS, 323, 417
- (5) Aussel, H., Cesarsky, C.J., Elbaz, D., & Starck, J.L., 1999, A&A, 342, 313
- (6) Barvainis, R., 1987, ApJ, 320, 537
- (7) Bertin, E. & Arnouts, S., 1996, A&A, 117, 193
- (8) Blain, A.W., 1999, MNRAS, 309, 955
- (9) Blain, A.W., Smail, I., Ivion, R.J., & Kneib, J.-P., 1999, MNRAS, 302, 632
- (10) Blain, A.W., Barnard, V.E. & Chapman, S.C., 2003, MNRAS, 338, 733
- (11) Carswell, R.F., Mountain, C.M., Robertson, D.J., et al., 1991, ApJ, 381, L5
- (12) Cayón, L.,Sanz, J.L., Barreiro, R.B., et al., 2000, MNRAS 315, 757
- (13) Cesarsky, C., Abergel, A., Agnese, P., et al., 1996, A&A, 315, L32
- (14) Chapman, S.C., Scott, D., Borys, C. & Fahlman, G.G., 2002, MNRAS, 330, 92
- (15) Chapman, S.C., Blain, A.W., Ivison, R.J. & Smail, I.R., 2003, Nature, 422, 695
- (16) Eales, S., Lilly, S., Gear, W., et al., 1999, ApJ 515, 518
- (17) Francis, P.J., Hewett, P.C., Foltz, C.B. & Chaffee, F.H., 1992, ApJ 398, 476
- (18) Frayer, D.T., Smail I., Ivison R.J. & Scoville N.Z., 2000, AJ, 120, 1668
- (19) Gabriel, C., Acosta-Pulido, J., Heinrichsen, I., Morris, H., & Tai, W.-M., 1997, Astronomical Data Analysis Software and Systems VI, A.S.P. Conference Series, Vol. 125, 1997, G. Hunt and H.E. Payne, eds., p.108
- (20) Hagen, H.-J., Engels, D. & Reimers, D., 1999, A&AS, 134, 483
- (21) Haas, M., Müller, S.A.H., Chini, R., et al., 2000, A&A, 354, 453
- (22) Holland, W.S., Robson, E.I., Gear, W.K., et al., 1999, MNRAS, 303, 659
- (23) Hughes, D.H., Dunlop, J.S. & Rawlings, S., 1997, MNRAS, 289, 766
- (24) Irwin, M.J., Ibata, R.A., Lewis, G.F. & Totten, E.J., 1998, ApJ, 505, 529
- (25) Isaak, K.G., Priddey, R.S., McMahon, R.G., et al., 2002, MNRAS, 329, 149
- (26) Ivison, R., Smail, I., Blain, A., Kneib, J.-P. & Frayer, D., 1999, ApSS, 266, 285
- (27) Jenness, T. & Lightfoot, J.F., 1998, Astronomical Data Analysis Software and Systems VII, A.S.P. Conference Series, Vol. 145, 1998, R. Albrecht, R.N. Hook and H.A. Bushouse, eds., p.216
- (28) Kennefick, J.D., Osmer, P.S., Hall, P.B. & Green, R.F., 1997, AJ, 114, 2269
- (29) Kessler, M.F., Steinz, J.A., Anderegg, M.E., et al., 1996, A&A, 315, L27
- (30) Kneib, J.-P., Mellier, Y., Fort, B. & Mathez, G., 1993, A&A, 273, 367
- (31) Knudsen, K.K., van der Werf, P.P. & Jaffe W., 2001, in “Deep Millimeter Surveys: Implications for Galaxy Formation and Evolution”, eds. J.D. Lowenthal and D.H. Hughes, p168 (astro-ph/0009024)
- (32) Landolt, A.U., 1992, AJ 104, 340
- (33) Leech, K.J., Metcalfe, L. & Altieri, B., 2001, MNRAS, 328, 1125
- (34) Lemke, D., Klaas, U., Abolins, J., et al., 1996, A&A, 315, L64.
- (35) Lewis, G.F., Chapman, S.C., Ibata, R,A., Irwin, M.J. & Totten, E.J., 1998, ApJL, 505, 1
- (36) Ott, S., Abergel, A., Altieri, B., et al., 1997, Astronomical Data Analysis Software and Systems VI, A.S.P. Conference Series, Vol. 125, 1997, G. Hunt and H.E. Payne, eds., p.34
- (37) Page, M.J., Stevens, J.A., Mittaz, J.P.D. & Carrera, F.J., 2001, Science, 294, 2516
- (38) Priddey, R.S., Isaak, K.G., McMahon, R.G. & Omont, A., 2002, astro-ph/0211646
- (39) Sanders, D.B., Phinney, E.S., Neugebauer, G., Soifer, B.T. & Matthews, K., 1989, ApJ, 347, 29
- (40) Schlegel, D.J., Finkbeiner, D.P. & Davis, M., 1998, ApJ 500, 525
- (41) Scott, S.E., Fox, M.J. & Dunlop, J. S., 2002, MNRAS, 331, 817
- (42) Smail, I., Ivison, R.J. & Blain, A.W., 1997, ApJ, 490, L5
- (43) Smail, I., Ivison, R.J., Kneib, J.-P., et al., 1999, MNRAS, 308, 1061
- (44) Smail, I., Ivison, R.H., Blain, A.W. & Kneib, J.-P., 2002, MNRAS, 331, 495
- (45) Stocke, J.T., Morris, S.L., Weymann R.J. & Foltz, C.B., 1992, ApJ, 396, 487
- (46) Urry, C.M., & Padovani, P., 1995, PASP, 107, 803
- (47) Vernet, J. & Cimatti, A., 2001, A&A, 380, 409
- (48) Zabludoff, A.I., Huchra, J.P. & Geller, M.J., 1990, ApJS, 74, 1