The Slow Decay of Some Radio Afterglows, a Puzzle for the Simplest GRB Fireball Model
Abstract
The decay of half of the GRB radio afterglows with long temporal monitoring is significantly slower than at optical frequencies, contrary to what is expected in the simplest fireball model. We investigate four ways to decouple the radio and optical decays: an evolving index of the power-law distribution of the shock-accelerated electrons, the presence of a spectral break between the two domains, a structured outflow, and a long-lived reverse shock contribution to the afterglow emission. For most afterglows, the first scenario cannot accommodate all properties of the afterglow emission. If the spectral break of the second scenario is the cooling frequency, then observations require that, as the fireball decelerates, the parameter for the minimal electron energy decreases and the magnetic field strength is constant or increases. The latter behavior seems implausible and is alleviated if the circumburst density increases outward. In the framework of the third scenario, the optical afterglow arises from a more energetic, narrow outflow core while the radio emission comes from a more extended envelope. This scenario is at best marginally consistent with the general properties of the radio and optical afterglow emissions and requires a total electron energy exceeding equipartition, thus it does not provide an acceptable solution. In the fourth scenario, it is assumed that the radio afterglow emission arises in the reverse shock propagating in a steady stream of ejecta, which catch up with the decelerating GRB remnant. This scenario can accommodate the properties of the afterglows with slow radio decays and requires that the injected energy is less than or comparable to the initial fireball energy, while other afterglow parameters have reasonable values. We find the reverse–forward shock scenario to be the most viable explanation for the shallow decay observed in some radio afterglows. For a jet, the transition to a semi-relativistic motion mitigates the radio decay, however this scenario would work only when the slower radio decay is observed well after the steeper optical fall-off. A structured outflow with a relativistic core, yielding a fast decaying optical emission, and a non-relativistic envelope, producing a slowly falling-off radio afterglow, is not a viable solution, as it fails to decouple the radio and optical decays.
keywords:
gamma-rays: bursts - ISM: jets and outflows - radiation mechanisms: non-thermal - shock waves1 Introduction
Since their first discovery, the optical afterglows of Gamma-Ray Bursts (GRBs) have displayed a time evolution which is consistent with the predictions of the fireball model (Mészáros & Rees 1997). The power-law decay expected for a spherical outflow has been first observed in GRB 970228 (Wijers, Rees & Mészáros 1997). A tight collimation of the GRB outflow (i.e. a narrow jet) was shown to yield a steepening (”break”) of the afterglow light-curve fall-off (Rhoads 1999), which subsequently was observed in GRB 990123 (Kulkarni et al. 1999). To date, there are about ten afterglows exhibiting an optical light-curve break and a smaller number of sufficiently well monitored afterglows whose light-curves are pure power-laws. In all cases where the optical spectral slope was determined, it was found to be consistent (within the fireball/jet model) with the optical light-curve decay rate.
Further tests of the basic afterglow model require observations at earlier times, within the first couple of hours after the burst, and at other wavelengths. The number of GRB afterglows with early observations will be greatly enhanced by the Swift satellite. On the latter avenue, the monitoring of about ten -ray afterglows has shown that their behavior is consistent with that observed in the optical, without major surprises for the fireball model. However, it should be noted that -ray observations rarely cover more than one decade in time. Wider time ranges have been reached for about ten radio afterglows, half of them exhibiting a decay which is much slower than in the optical, which is a rather puzzling feature for the fireball model. That radio light-curves fall-off after about 10 days, strongly indicate that peak of the synchrotron spectrum is redward of the radio domain after that time. Then, within the fireball model, one expects nearly equally fast decays in the radio and in the optical, contrary to some observations.
The purpose of this paper is to analyze in more detail whether the fireball/jet model in its simplest form can explain the discrepancy between the radio and optical decays observed in some afterglows (§2) and to explore departures from the usual assumptions that could accommodate such discrepancies (§3). The expression ”simplest fireball model” will be used to designate an outflow with a uniform angular distribution of the kinetic energy, without energy injection during the afterglow phase, interacting with a circumburst medium whose density changes monotonically with radius, with un-evolving and uniform parameters for the electron distribution and magnetic field behind the forward shock. For an easier understanding of the following equations, we list in Table 1 the definitions of the quantities which will be encountered more often.
2 Radio Light-Curves in the Simplest Fireball/Jet Model
For a spherical, uniform fireball, or a wide jet whose dynamics is not yet affected by its lateral spreading, the synchrotron characteristic frequency corresponding to the lowest energy electrons accelerated by the forward shock (hereafter called ”injection” frequency) is given by (e.g. Panaitescu & Kumar 2000)
| (1) |
where is the fireball kinetic energy per solid angle, is the observer frame time measured in days, the burst redshift, is the fractional post-shock energy stored in the magnetic field, and parameterizes the lowest energy of the power-law distribution of shock-accelerated electrons, representing the fraction of the energy in the downstream fluid residing in electrons if they all had the same random Lorentz factor , i.e. , where are the electron and proton number densities in the post-shock fluid.
The synchrotron characteristic frequency corresponding to an electron energy for which the radiative losses timescale equals the fireball age (called the ”cooling” frequency) is
| (2) |
for a homogeneous circumburst medium of particle density , and
| (3) |
for an wind-like density profile, being the ratio of the mass loss rate to speed of the wind, in units of . In the above equations, is the Compton parameter.
If the afterglow is optically thin at the peak of the spectrum, the synchrotron self-absorption frequency is
| (4) |
for a homogeneous external medium, and
| (5) |
for a wind. In the derivation of the above equations it was assumed that . For a high magnetic field parameter , the cooling frequency may be below the injection, in which case is given by
| (6) |
for a homogeneous external medium,
| (7) |
for a wind. At late times, the injection frequency falls below the absorption frequency. In this case, the latter evolves as (homogeneous medium) and (wind medium), where is the exponent of the power-law energy distribution of the electrons accelerated at the forward shock: , being the electron random Lorentz factor.
The flux at the peak frequency () of the synchrotron spectrum is
| (8) |
for a homogeneous external medium and
| (9) |
for a wind-type medium, where is the luminosity distance.
For a spreading jet, the time-dependence of the spectral breaks is given by
| (10) |
while the synchrotron peak flux evolution is . For , the self-absorption frequency evolution is .
To assess which radio afterglows exhibit a decay consistent with that seen at optical frequencies, we list in Table 2 the expected radio light-curves for spherical and collimated outflows, a homogeneous or wind-like medium, and for the only three likely orderings of the break frequencies a few days after the burst. These light-curve indices were derived from the shape of the synchrotron spectrum (Sari, Piran & Narayan 1998) and the evolution of the break frequencies and peak flux. Most of the cases shown in Table 2 for have been presented in other works (e.g. Mészáros , Rees & Wijers 1998; Sari, Piran & Narayan 1998; Rhoads 1999; Sari, Piran & Halpern 1999; Chevalier & Li 2000; Panaitescu & Kumar 2000).
2.1 Comparison with Observations
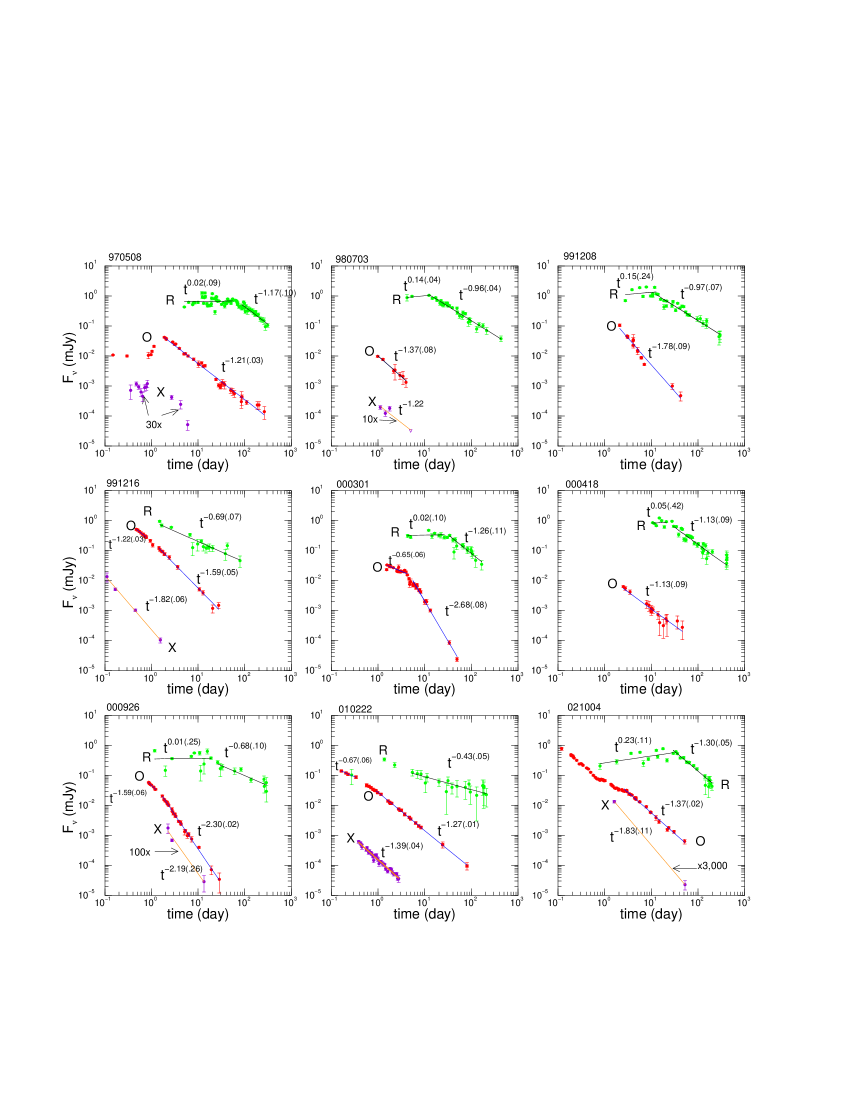
As shown in Table 2, the self-absorbed, low frequency emission rises in time in most cases, as the optical thickness of the swept-up medium decreases, while the afterglow light-curve at higher frequencies, above both and , falls-off. For observing frequencies higher than both and , the light-curve is for a fireball (either type of medium) and for a spreading jet. Such behaviors are observed in the radio, optical, and X-ray light-curves of GRB afterglows, as illustrated in Figure 1, displaying all afterglows with a good time coverage in the radio. A flat radio light-curve or a rise slower than can be noticed for most afterglows until 20–30 days (70 days for 970508), indicating that is never well above the radio domain, as in this case the radio emission should exhibit a sharper rise.
The late time radio emissions of afterglows 970508, 000418, and 021004 exhibit the same decay as in the optical, as expected when both domains lie above the injection frequency and the source is optically thin in the radio, thus these afterglows are readily consistent with the expectations for the simplest fireball model. However, for all other afterglows, the radio emission falls-off significantly slower than in the optical.
If the cooling frequency lies above radio () but below optical (), then the difference between the decay slopes of the optical () and radio () light-curves is for a homogeneous medium and for a wind, the former value being close to that observed in 980703. 111 If electron cooling is dominated by inverse Compton scatterings and electrons are in the slow cooling regime, then decreases slower for a homogeneous medium and increases faster for a wind than given in equations (2) and (3) (Panaitescu & Kumar 2000), which mitigates the fall-off of the optical light-curve and yields a smaller , thus this case does not accommodate the observations better . This possibility can be tested by noting that implies that the optical and X-ray decays have the same slopes. The upper limit at 5 days on the X-ray emission of 980703 indicates an X-ray slope larger than (Figure 1), thus it may be consistent with the optical slope .
Index differences larger than , such as those seen in the afterglows 991208, 991216, 000301, 000926, and 010222, require the presence of a stronger spectral break between radio and optical. However, to obtain a falling-off radio light-curve, the source must be optically thin at radio frequencies (Table 2), therefore that spectral break may only be . The cases that yield a decaying radio emission are: a spreading jet with and , a fireball interacting with a wind and , a spreading jet with . Below, we analyze each case in more detail.
2.2 Spreading jet, and
In this case the radio decay slope is , similar to that exhibited by the afterglow 991208 and 000301. Prior to the time when the jet edge becomes visible (the jet lateral spreading also becomes important at this time if the jet has sharp edges), is given by equation (1), while for , . Therefore
| (11) |
implying that, for day (as observed), the electron and magnetic field parameters must be close to equipartition, , to maintain GHz until the last radio measurement. Because is constant for a spreading jet, the condition is equivalent with . Using equations (2) and (3) with (implied by ), it leads to for a homogeneous medium or for a wind. Then, equations (6) and (7) give Hz. At , , therefore GHz, i.e. the source is optically thick at 8 GHz at all observing times. Thus the conditions and for days are incompatible.
Furthermore, the condition and equation (11) imply that GHz. First, assume that GHz. Then the radio flux at is the synchrotron peak flux given in equations (8) and (9). The above values of , , and yield Jy, decaying as at to mJy. For GHz, self-absorption reduces the 8 GHz flux to a few mJy, well above the 0.1 mJy radio flux observed at 100 days. The inconsistency between the expected and observed radio fluxes is not alleviated if GHz (as assumed above) because this requires a higher or a denser external medium ( is already maximal), which, due to that at , can only increase the radio flux.
Thus we reach the conclusion that a spreading jet with and cannot accommodate the radio and optical decays seen in 991208 and 000301. We note that, if the optical emission seen in 991208 after 10 days is not from the afterglow but to a supernova contribution (Castro-Tirado et al. 2001), then the radio and optical fall-offs are not measured simultaneously, leaving the possibility of a mildly relativistic jet during the radio decay, which yields at a decay slower than the expected for very relativistic jets. However, would be required in this case, which is clearly inconsistent with the steep optical decay of 991208 observed until 10 days.
2.3 Fireball in wind-like medium,
In this case , consistent with the radio decay seen for 991216 and 000926 until 100 days. Although the decrease of for a fireball () is slower than for a spreading jet (), electron and magnetic field parameters close to equipartition are still required in this case to ensure that until 100 days. The reason is that, for a fireball interacting with a wind, increases as , thus the ratio decreases equally fast for either a fireball in a wind or for a spreading jet. Consequently, this model requires the same dense winds, with , leading to GHz (eq.[7]), i.e. a source that is not optically thin at 8 GHz, and to Jy (eq.[9]), well above the observed radio fluxes. Thus the fireball model for the radio decay of 991216 and 000926 encounters the same problems as the jet model for 991208 and 000301.
2.4 Spreading jet,
The radio decay slope expected for this case, , is close to that observed in 010222 at 5–100 days. As for the first model above, the condition GHz for a spreading jet with day requires that and are close to equipartition (eq.[11]).
The other two conditions involved in this hypothesis – GHz and – set upper bounds on the external density and wind parameter . From equations (2)–(5) we find the former condition being more restrictive, leading to for a homogeneous medium and for a wind. Lower bounds on the same parameters are set by that the peak flux at 100 days should exceed that observed at 8 GHz for 010222 (i.e. 0.03 mJy). From equations (8), (9), and the expected for a spreading jet, we find that for a homogeneous medium or for a wind. Given that GHz, and should be close to these lower limits, implying thus a very tenuous external medium.
Substituting these lower limits in equations (2) and (3), it can be shown that Hz for either type of medium, i.e. the cooling frequency is between the optical and X-ray domains. As the cooling frequency is constant for a spreading jet, the optical and X-ray decay slopes are expected to be equal. This is consistent with the observations of 010222 at 0.4–3 days (Figure 1).
Thus the radio, optical, and X-ray decay slopes of 010222 may be accommodated by a spreading jet with . We note that numerical calculations of light-curves from spreading jets show that, when the dynamics is accurately calculated and the analytical approximation of constant jet radius (Sari, Piran & Halpern 1999) is relaxed, the jet light-curve at is flat instead of decaying as , thus it may be that, in fact, the radio fall-off of 010222 is not consistent with a spreading jet.
3 Beyond the Simplest Fireball Model
As argued in the previous section, the radio and optical decay observed for the afterglows 991208, 991216, 000301, 000926, and 010222 appear incompatible with the simplest fireball model. For these afterglows, at least one of the assumptions usually made in the calculation of analytical light-curves must be relaxed. In scenarios where the radio an optical emissions arise from the same population of electrons, the ratio of the afterglow emission at these frequencies depends on the slope of the afterglow spectrum and on the evolution of all spectral break frequencies located between the radio and optical domain. In scenarios where the radio and optical emissions arise in different regions of the GRB outflow, the segregation may be either angular or radial, i.e. in the directions perpendicular and parallel, respectively, to that of the outflow motion.
Thus, we consider four ways in which the difference between the radio and optical decay indices may depart from expectations:
-
1.
radio and optical arise from the same electron population.
-
(a)
there is no spectral break between the radio and the optical domains. Then the variation in time of the slope of the synchrotron spectrum, which is determined by that of the electron distribution ,
-
(b)
there is a break between radio and optical, whose evolution is different than that expected in the simplest afterglow model (§2),
-
(a)
-
2.
radio and optical arise from different electron populations.
-
(a)
the anisotropic distribution of the energy per solid angle across the outflow structure, so that the radio and optical emissions arise from different parts of the outflow, moving at different Lorentz factors (for the same photon-arrival time),
-
(b)
the existence of a long-lived flow of slower ejecta which are energized by the reverse shock and dominate the radio afterglow emission, while the optical afterglow arises in the forward shock propagating into the circumburst medium.
-
(a)
We analyze below these possibilities for the five afterglows (991208, 991216, 000301, 000926, and 010222) for which the radio and optical decay indices are incompatible with each other in the simplest fireball model. We also discuss the effect of non-relativistic motion on the decoupling of the radio and optical light-curve decays.
3.1 Electron Distribution with Time-Varying Slope
In a scenario employing an evolving , the steepening of the optical light-curve decay observed in the afterglows 991216, 000301, 000926, and 010222 could arise from a non-monotonic evolution of and not necessarily from a collimated outflow. We consider first a spherical outflow and discuss later the case of a jet.
If the onset of the radio fall-off at days is identified with the passage of (which is the most natural explanation) then, for a spherical outflow, , independent of the type of external medium. For a power-law density profile of the circumburst medium,
| (12) |
the evolutions of the peak flux and cooling frequency are and , respectively. Substituting in the afterglow flux at :
| (13) |
they lead to a light-curve decay index at frequency given by
| (14) |
where the additional last term in the applies only for .
Evidently, an evolving index can yield a pure power-law afterglow light-curve in only one observational domain. Given that optical measurements cover the widest time range and usually have the smallest uncertainties, we determine the evolution of by requiring that the optical light-curve is a power-law, as observed, i.e. that the optical decay index given in equation (14) does not vary in time. Equation (14) can be recast as
| (15) |
is the electron index that would be required by the observed if were constant. Integrating the above equation yields
| (16) |
where is the value of at some time when the optical slope was measured: if and if .
There are a few consequences stemming from equations (14), (15), and (16). For , the index increases in time, while for it decreases, in either case approaching asymptotically the value . The light-curve index at an arbitrary frequency satisfies
| (17) |
where the sign of the last term in the is ”+” for , and ”–” for , otherwise that term is absent. Substituting equations (15) and (16) in (17), we obtain
| (18) |
Therefore, a radio decay significantly shallower than in the optical () requires that , implying an increasing and an optical spectrum that softens in time (). Furthermore, for , equation (18) gives that the afterglow decay in the -ray should be steeper than in the optical (). Also for , the evolution of , , shows that the radio decay should steepen in time (), while the -ray decay should flatten ().
The above consequences of requiring that can be used to test the scenario of an evolving index . Using the light-curve characteristics given in Table 3, we find that a radio decay consistent with the observations is obtained only if and , for the GRB afterglows
-
1.
991208, for which equation (18) yields , and . The available measurements of the optical spectral slope, (Castro-Tirado et al. 2001), (Djorgovski et al. 1999), and (Bloom et al. 1998), indicate a hardening of the optical emission that rules out the current scenario, in which it is expected that
-
2.
991216. For the given in Table 3 for Galactic extinction of , the radio decay index is , , and . However, the expected -ray decay has an index and , which is too large compared too observations. Similar results are obtained for
-
3.
000301, for which and . The optical slopes (corrected only for Galactic extinction) determined by Rhoads & Fruchter (2001) – , , , , – indicate a general softening with from day 5 to day 13 (i.e. after the optical light-curve break). The expected softening, , is consistent with the observations.
The evolution of required to yield the power-law decay of the optical emission of the afterglows 000926 and 010222 leads to radio fall-offs that are too steep in comparison with the observations.
Therefore, the scenario considered here is consistent with the available data in only one case (000301). We note that, a collimated outflows leads to a smaller , as the effect of collimation is to yield steeper light-curve decays, and thus to larger radio decay indices (eq.[18]). Consequently, a jet (spreading laterally or not), is even less able than a spherical outflow in explaining the shallow decay observed for the five anomalous afterglows.
3.2 Time-Varying Electron and Magnetic Field Parameters
Below the absorption frequency , the afterglow light-curve should should rise or be flat, unless increased sufficiently fast. Such a behavior is not observed, thus the falling-off radio emission rules out that spectral break located between radio and optical domains and having a non-standard evolution is . If the break were the injection frequency then, to satisfy the condition until the last radio measurement requires large values for the parameter. As shown in §2.2 and §2.3, in those cases where the shallow radio decay also requires that , the resulting synchrotron peak flux is too large compared to the observed radio flux at about 100 days. As shown in Table 2, the steepest radio fall-off that can be obtained for , is for a spreading jet. Thus, in the simplest model, the case cannot explain the steep radio decays observed for the above five anomalous afterglows, ranging from to .
The remaining break to be considered is the cooling frequency . Its location below the optical domain implies that the optical and -ray light-curves must have the same decay, which is satisfied by the afterglow 000926, but is rather inconsistent with 991216 and 010222, for which and , respectively. It is possible that the -ray emission of these two afterglows has a significant contribution from inverse Compton scatterings, which could yield a steeper fall-off that at optical frequencies. For 991208 and 000301, there are no -ray observations to test that .
The non-standard evolution of can be determined from the difference between the observed radio and optical decay indices. Given that the slope of the synchrotron spectrum, , steepens by from to , it follows that , thus . The decay indices shown in Figure 1 lead to for 991208, for 991216, for 000301, for 000926, and for 010222. Such steep fall-offs of exceed by much that allowed in the simplest fireball model, where for a homogeneous medium and for a wind-like medium (eqs.[2] and [3]). For a power-law density profile (eq.[12]) and a spherical outflow, the cooling frequency evolution is . Thus, for increasing as a small power of the radius (), decreases roughly inversely proportional with . The fastest fall-off of with time is reached for , corresponding to a sharp increase in the external density, when , which is slightly slower than that required by the afterglows 991208, 991216, and 010222, and substantially slower than necessary for 000301 and 000926.
For this reason, we consider the case where there is a contribution to the evolution of arising from a time variation of the other afterglow parameters that determine it: and (eqs.[2] and [3]). The magnetic field parameter could vary in time if its value is determined by the Lorentz factor of the fireball, if the shocked external medium mixes with the GRB ejecta having a frozen-in magnetic field, or if the circumburst medium is magnetized. The fireball energy may decrease in time due to radiative losses or may increase if the shock is refreshed through a delayed energy injection caused by a spread in the initial Lorentz factor of the ejecta (Rees & Mészáros 1998). Given that we want to explain both the observed radio and optical decay indices, and , and that these indices depend on the electron parameter , we also allow this parameter to be variable. We note that radiative losses couple the variation of to those of and . However, to calculate this dependence, a knowledge of the entire electron distribution is necessary. For , it can be assumed that the distribution extends up to arbitrarily high energies, thus its slope and minimal electron energy (parameterized by ) suffice, however a high energy cut-off must exist for (as is the case for 991216, 000301 and 010222, if ). For this reason, we allow the evolution of to be independent of that of and .
The evolution of the afterglow parameters , , and can be constrained with the aid of the observed light-curve decay indices and . To do this, we chose power-law dependences of the afterglow parameters on the observer time
| (19) |
for ease of calculations and because, in this way, a minimal number of unknowns is introduced. We note that, in a scenario where the afterglow parameters are time-varying, a steepening of the afterglow light-curve decay may be due to a non-uniform variation of the parameters, thus the optical light-curve breaks observed in the afterglows 991216, 000301, 000926 and 010222 may not require a tight collimation of the ejecta (i.e. a jet). For this reason, we shall consider both spherical and collimated outflows.
3.2.1 Spherical, Uniform Outflow
In the assumption of a uniform temperature in the post-shock medium, equal to that set by the shock-jump conditions, the fireball dynamics is given by , where is the mass per solid angle of the energized external medium. Together with , it leads to
| (20) |
Starting from the basic expressions of the spectral characteristics , , and (e.g. Sari, Piran & Narayan 1998), equation (20) leads to
| (21) |
| (22) |
For afterglow parameters varying as given in equation (19), equations (13), (21), and (22) yield the following light-curve decay indices at radio () and optical () frequencies:
| (23) |
| (24) |
Our choice for is motivated by the uninterrupted power-law decay observed for the five anomalous radio afterglows until about 100 days, and the presence of a break in the radio light-curve of the afterglows 991208 (10 days), 000301 (30 days), and 000926 (20 days) that, most likely, is caused by the passage of through the radio domain.
Before using equations (23) and (24) and observations to constrain the evolution of and , let us determine the evolution of in the absence of energy injection, i.e. the range of allowed by radiative losses. The fastest decrease of thorough radiative losses occurs when the shock-accelerated electrons acquire an energy equal to that in protons and cool radiatively faster than adiabatically. In this fully radiative fireball, half of the energy is transferred to the circumburst medium during the time a mass equal to that already swept-up is shocked, and is radiated away, i.e. . Taking into account that the swept-up mass is , it yields . Using from equation (20), we obtain that, for a fully radiative fireball, (see also Mészáros , Rees & Wijers 1998). Therefore, radiative losses are characterized by
| (25) |
For a given value of , the exponents and can be determined from equations (23) and (24) and the electron index required by the slope of the afterglow optical continuum, . These slopes, corrected for Galactic extinction and possible Small Magellanic Cloud-like dust reddening in the host galaxy (inferred from the curvature of the optical spectrum under the assumption that the afterglow intrinsic continuum is a pure power-law), are given in Table 3. In the absence of energy injection (i.e. for given in eq.[25]), we reach the following conclusions for the five anomalous afterglows:
-
1.
for and (fully radiative fireball), and . Taking into account that the magnetic field is and that , it follows that
-
2.
for and (adiabatic fireball), and . From , it results that
-
3.
for and (fully radiative fireball), and . Then and (eq.[20]) lead to
-
4.
for and (adiabatic fireball), and . From and , it follows that .
Therefore, for and without energy injection, must decrease and must increase in time. The latter is sufficiently strong that leads to a magnetic field which is constant or increasing in time, which is too extreme for plausible mechanisms for generating a magnetic field (turbulence and mixing of magnetized ejecta with swept-up medium). For the afterglow 991208, the inferred behavior of and imply that, after 10 days, the peak flux evolves as and for a radiative and an adiabatic outflow, respectively, while the injection frequency evolutions are and . The resulting evolution of is rather inconsistent with the radio observations of 991208 at 3–13 days – (Galama et al. 2001), while that of is in agreement with the observed .
We note that, without energy injection, a slower increase of is obtained for an increasing external density. However, even in the limit of a sharp increase of the external density (), we obtain that increases in time. In this case, for an adiabatic fireball (), the index for the five afterglows satisfies , implying , while for a radiative outflow (), the resulting leads to , i.e. the magnetic field may decrease in time. For the afterglow 991208, the resulting evolution of the peak flux ( for a radiative outflow, for an adiabatic outflow) is not consistent with the observations, while that of the injection frequency ( and , respectively) favors a radiative fireball.
If there is energy injection (), a constant parameter can be obtained for . In addition, must decrease for , but it must increase for . If the external medium is homogeneous, the peak flux for the afterglow 991208 should increase faster than and the injection frequency should decrease faster than at days. This is in stark contrast with the radio observations of this afterglow (see above). For , the parameter increases in time even if there is an injection of energy.
3.2.2 Non-Spreading Jet
Before investigating a collimated outflow, we consider a structured outflow endowed with a core of a higher energy per solid angle than outside it. In this case, the tangential motions are slow and the lateral spreading of the core is negligible (Kumar & Granot 2003). Because the dynamics of the core remains unchanged, the spectral breaks continue to evolve as given in equation (22). However, when the boundary of the core becomes visible to the observer, the increase of the area radiating the afterglow emission changes from to , where is the angular opening of the outflow core. This leads to a faster decrease of the peak flux corresponding to a multiplicative factor . From equations (20) and (21), it follows that when the core boundary is seen, the peak flux is
| (26) |
and the index of the light-curve decay increases by
| (27) |
at any frequency. For an adiabatic fireball without energy injection (), for a homogeneous medium and for a wind (Panaitescu, Mészáros & Rees 1998). Energy injection (), decreases the steepening, while radiative losses ( increase it. For the latter, the effect is small even for a fully radiative afterglow: for and for . The optical afterglows 991216, 000301, 000926, and 010222 exhibited a break at around 1 day (Figure 1), the increase in the decay index being (Table 3), respectively. Therefore the breaks seen in the optical light-curves of the afterglows 991216, 000926, and 010222 are consistent with those expected for a structured outflow endowed with a more energetic core, while that of the afterglow 000301 is too large and incompatible with a structured outflow.
As can be seen from equations (23) and (24), an additive term in the of each equation leads to a different solution for but leaves unchanged the value of . Therefore, in the scenario of a structured outflow without energy injection (i.e. is constrained by eq.[25]), the magnetic field strength must still be constant or increase in time to accommodate the radio and optical decay indices of the five anomalous afterglows, for the usual types of external media (). However, in contrast to the uniform fireball case, a structured outflow without energy injection leads to evolutions of the peak flux and injection frequency that are consistent with the radio observations of the afterglow 991208 (Galama et al. 2001), for either a homogeneous or a wind-like circumburst medium. As for a uniform outflow, to obtain a constant for a non-spreading jet requires energy injection and leads to behaviors of and which are in conflict with the radio observations of 991208.
3.2.3 Spreading Jet
If the ejecta are confined to a jet with a sharp edge, its lateral spreading is not impeded and the jet dynamics changes from that of a spherical outflow when this spreading becomes important. Rhoads (1999) has shown that, for a homogeneous medium (), the radius of a spreading jet increases only logarithmically with time, most of the increase of the swept-up mass being due to the lateral spreading. For an external density increasing with radius (), the jet radius should increase even slower during the sideways expansion phase. However, the approximation of a constant jet radius should become inadequate for a decreasing external density (Kumar & Panaitescu 2001). For ease of calculations we make this approximation, which, for , has the effect of removing the dependence of the afterglow flux on the density profile of the external medium.
The dynamics of a spreading jet is given by (Rhoads 1999)
| (28) |
where is the jet energy and is the mass of swept-up external matter. From here, we obtain the following expressions for the spectral characteristics:
| (29) |
Substituting the parameter evolution given in equation (19 in the resulting afterglow light-curves, yields the following decay indices
| (30) |
The dynamics of a fully radiative jet can be derived from equation (28), taking into account that (half of energy is radiated away while the swept-up mass doubles). Then . Therefore, in the absence of energy injection, radiative losses yield . From equations (23) and (24), we obtain that the observed decay indices of the five anomalous afterglows require
-
1.
for (fully radiative jet). From and , it follows that
-
2.
for (adiabatic jet). Using , it yields
Therefore, for and without energy injection, must increase in time and, just as for a spherical outflow, this increase is sufficiently strong that it leads to a magnetic field that is constant or increases with time. In contrast, the electron parameter may either decrease or increase. The resulting behavior of the peak flux and injection frequency for the afterglow 991208 are in agreement with the observations if the jet is adiabatic. To obtain a constant , must be decrease faster than , which, for the afterglow 991208, leads to the same inconsistencies between the evolutions of and and observations that were mentioned for a spherical outflow (§3.2.1).
3.3 Structured Outflow
So far, we have considered two scenarios where the radio and optical afterglows arise from the same population of electrons. If there is no break in the synchrotron spectrum between the radio and optical domains and if the slope of the electron energy distribution does not change in time, then the discrepancy between the radio and optical decays of the afterglows 991208, 991216, 000301, and 000926 must be explained by that these emissions arise from different regions of the GRB outflow. The key quantity in the calculation of the afterglow emission is the outflow Lorentz factor, which is determined by the energy per solid angle and the degree of collimation of each region. Thus, one can imagine that, in a structured outflow, a part of it has a higher kinetic energy and a larger Lorentz factor than another part, so that the former radiates more in the optical and less in the radio than the latter.
Within the structured outflow scenario, an optical decay steeper than in the radio can be obtained if the outflow radiating in the optical is tightly collimated. Then, for an adiabatic fireball and without energy injection, the optical decay index increases by for and by for at the time when the boundary of the optically emitting outflow becomes visible (eq.[27]). As discussed in §3.2.2, the expected for a structured outflow is consistent with that observed for the afterglows 991216, 000926, and 010222, but not for 000301. Furthermore, the near-infrared–optical spectral slope determined for the afterglow 000301 by Jensen etal (2001), , even the steepest post-break decay index that can be obtained with a structured outflow, , is too shallow compared with that observed. For these reasons, this afterglow will not be considered in this section.
If the radio emitting outflow is quasi-spherical, then the differential decay is equal to if the cooling frequency of the jet emission is blueward of the optical and to () or () if it is below. For the afterglows 991208, 991216, and 010222, , , and , respectively, thus the differential decay seen between the radio and optical emission of the first three afterglows may be accommodated by an optical jet interacting with a homogeneous medium, particularly if the cooling frequency is redward of the optical domain. However, the of the afterglow 000926 exceeds that allowed in this scenario, thus allowance for a different electron index of the radio and optical outflows must be made. For generality, we will allow for different indices in the radio and optical outflows of all afterglows, thus the only remaining restriction is that of a homogeneous medium for the afterglow 000926, where the observed is inconsistent with a wind-like medium.
Having outlined the general set-up for a scenario that accounts for the observed radio and optical decays (for four of the five anomalous afterglows) – a structured outflow containing a core with a higher energy per solid angle, producing the optical afterglow, and yielding a light-curve break when its edge becomes visible, and an envelope of lower energy per solid angle, from where the radio afterglow arises – we proceed to constrain this scenario by requiring that the optical and radio outflows dominate the emission in their respective domain over the entire time interval when the afterglow decay is observed. These constraints are suggested by that, as it softens, the synchrotron emission from the optical core yields a radio contribution that falls-off shallower than that from the radio envelope, while the slower deceleration of the radio envelope yields an optical emission that decays slower than that from the optical core.
For simplicity, we consider that the angular distribution of the ejecta energy is uniform in both the core and the envelope of the relativistic outflow, i.e. the fireball angular structure is a top-hat function (co-axial uniform outflows). Such a ”dual fireball” scenario (Frail et al. 2000) yields the maximal decoupling of the radio and optical emissions.
That the optical light-curve decays from the earliest observation indicates that the line observer–fireball center is within the optical jet. In this case, the radio envelope, being less relativistic than the optical core, becomes visible to the observer before the edge of the core, thus the radio light-curve break seen in the afterglows 991208 and 000926 at days, well after the time of the optical break, cannot be due to the outflow structure and relativistic effects. Given that for plausible afterglow microphysical parameters the injection frequency is expected to cross the radio domain at around 10 days (eq.[1]), it is more natural to associate the radio light-curve breaks of 991208 and 000926 (and of all other radio afterglows in Figure 1) with the passage of through the radio band.
Assuming that the parameters and are the same everywhere, the larger energy per solid angle within the core implies that its injection frequency is higher than for the envelope, therefore crosses the radio domain at a time . For , the radio emission from the optical jet is that for a spherical outflow, for or for , corrected for the frequency-independent steepening (=3/4 for , =1/2 for ) produced by seeing the jet edge, therefore for and for . These fall-offs are shallower than those observed in all radio afterglows (with the exception of 010222 for ), which we attribute to the radio envelope. For , the decay index of the radio emission from the optical jet is equal to that of the optical light-curve or differs by 1/4, thus decays steeper than the observed radio light-curves. Therefore, the dominance of the radio emission from the radio envelope is ensured at all times if it is brighter than the radio flux from the optical jet at : . From , it follows that
| (31) |
where is the observed radio flux at the time days when the radio fall-off starts, though any subsequent time can be chosen if the onset of the radio decay has been missed. For , the radio emission from the optical jet falls-off as (see above), therefore
| (32) |
where is the peak synchrotron flux from the optical jet at . This quantity can be determined from the observed optical flux which, taking into account that , is
| (33) |
where is the electron index in the optical jet. From that at all times and for any , the crossing time defined by is . Substituting it in equations (31) and (32) and using equation (33), the above condition yields a lower limit on :
| (34) |
From equation (34) it can be shown that the least stringent constraint on is obtained if . Physically, this can be understood from that, for a given optical flux, the peak flux of the core emission must be larger for than for . A larger peak flux leads to brighter radio emission from the optical jet at . To compensate, a larger is required because decreases in time. Finally, a larger implies a higher . As we shall see, the higher is the lower limit on , the more it becomes a problem for the scenario considered here, thus we restrict now our attention to the less constraining case , for which . Because the observed slope of the optical afterglow is affected by an uncertain extinction in the host galaxy, we choose to determine the index from the optical decay index , which is better constrained by observations than that before the break. When the jet edge is seen, the optical light-curve at steepens from to for , and from to for . Thus for and for . Substituting in the above expression of leads to for either type of external medium.
Table 3 lists the values of the observables that appear in the of equation (34). Substituting them, we obtain for the following results:
-
1.
GRB 991208. For , , slope of intrinsic optical spectrum (requiring to be consistent with the slope determined by Castro-Tirado et al. 2001), GHz. For , , (requiring ), GHz.
-
2.
GRB 991216. For , , (consistent with the slope measured by Garnavich et al. 2000 for a Galactic extinction of ), GHz. For , , (requiring ), GHz.
-
3.
GRB 000926. For , , (consistent with the value inferred by Fynbo et al. 2001 after correction for host extinction of ), GHz.
-
4.
GRB 010222. For , , (requiring to be consistent with the slope determined by Jha et al. (2001) and Stanek et al. (2001), thus exceeding the host extinction inferred by Galama et al. 2003 and Lee et al. 2003, ), GHz. For , , (requiring ), GHz.
If the above values of are extrapolated back to the time of the first optical measurement, the resulting is redward of the optical domain, consistent with that the optical light-curves decay from the first observation. We note that, for a homogeneous medium, the electron index required by the observed radio decay, , are compatible with the above values of for all afterglows except 000926. However, for a wind-like medium, the index is always smaller than . Thus, the latter type of circumburst medium requires different electron indices in the outflow envelope and core, which makes this scenario somewhat contrived.
The above lower limit on can be converted into a lower limit on the injection frequency for the radio component at the onset of the radio decay. As argued before, we expect that GHz (or GHz, if the beginning of the radio decay occurred before the first observation), thus a self-consistency test for the structured outflow scenario is to require that the lower limit on is below the radio domain. From equation (1), we obtain
| (35) |
where and are the energy densities of the radio and optical outflows, respectively. This ratio can be determined from the observed radio and optical fluxes ( and ) and equations (1), (8), and (9). At an observing frequency above and below , the afterglow emission is (eq.[13]), therefore
| (36) |
where is the slope of the radio spectrum, being the electron index of the radio outflow, which can be determined from the observed decay index: for and . By substituting from equation (35) and from equation (21), we obtain
| (37) |
Extracting the ratio from here and substituting it in equation (35), yields
| (38) |
Note from the above equation that for and for . Because increases with increasing , it follows that the lower limit on given in equation (34) sets a lower limit on . For the afterglow characteristics given in Table 3, and with and determined from the decay indices and , respectively, equation (38) leads to the following results
-
1.
GRB 991208: GHz for and GHz for ,
-
2.
GRB 991216: GHz for and GHz for ,
-
3.
GRB 000926: GHz for ,
-
4.
GRB 010222: GHz for and GHz for .
Therefore, we find that the condition that the radio emission from the envelope outflow is brighter than that from the optical jet leads to that is above the radio domain instead of the expected from the decay of the radio afterglows after . Only for two GRB afterglows (991208 and 010222), the structured outflow scenario may be compatible with the observations, provided that , which, as discussed above, requires different electron indices in the outflow core and envelope.
In the case, an even higher lower limit on is suggested by that is now larger. However, for a self-consistent treatment, the result given in equation (38) should be re-derived after adjusting equation (36) for the case. The additional constraint on necessary to calculate the upper limit on is provided by requiring that the optical emission from the radio envelope does not overshine that from the optical jet at any time when the power-law fall-off of the optical afterglow is observed, otherwise a flattening of the optical light-curve is expected222 Castro-Tirado et al. (2001) note such a behavior in the afterglow 991208, at 20–30 days. Apart from a substantial contribution from the radio outflow, fluctuations in the circumburst medium density, an episode of energy injection, or the emergence of an associated supernova, are other plausible explanations for the late-time bump in the optical afterglow 991208 . This constraint is satisfied at all times if it is fulfilled at the time of the latest optical measurement. Similar to the above calculation of the radio emission from the optical core and the radio envelope, the condition leads to an upper limit on the cooling frequency for the radio envelope emission. From and for a homogeneous medium, it follows that, for this type of external medium, is also an upper limit on , the cooling frequency for the optical core emission, which can be easily converted into an upper limit on .
In the case, the analytical calculation of is cumbersome and it is best to convert all constraints on the afterglow spectral properties into constraints on the afterglow model parameters. The five parameters , , (or for ), , and for a structured outflow are constrained by three equations (for , , and ) and two inequalities (for and ). Solving for the allowed parameter ranges in all cases above where GHz, we find that ergs, , and (for 991208), (for 991216), (for 000926), and (for 010222). Such large external densities, characteristic for a red supergiant or a molecular cloud, lead to a semi-relativistic motion () and a self-absorbed radio emission at . More worrisome, the electron parameter , together with the electron distribution slope required by the observed radio decay index , imply total electron energies that exceed equipartition with protons. Thus, the marginally viable cases require implausible afterglow parameters.
3.4 Reverse Shock in Ejecta Outflow
In this section we consider the possibility that the slowly decaying radio emission observed in some GRB afterglows arises in a long-lived reverse shock crossing some incoming, delayed ejecta, while the optical emission is produced in the forward shock which energizes the circumburst medium. An injection of ejecta in the fireball, lasting for the entire duration of the radio observations (tens to hundreds of days), is unlikely to be due to a very long-lived central engine. Instead we consider that the delayed injection is caused by that the ejecta are expelled by the GRB progenitor with a broad range of initial Lorentz factors (Rees & Mészáros 1998), the slower ejecta lagging behind the faster part of the outflow and catching-up with it during the afterglow phase, as the leading edge of the fireball is decelerated by the circumburst medium.
Assuming constant parameters and , the steepening of the optical light-curve decay must be associated with a tight collimation of the ejecta because a sudden reduction of the injected power cannot explain the steepness of the decay after the break time . For a jet with sharp edges, the slower moving, leading edge of the outflow spreads laterally at faster than the incoming ejecta, which leads to angular non-uniformities in the Lorentz factor of the fireball. To avoid this complication, we assume that the jet does not have sharp edges, i.e. it is embedded in an envelope (as considered in §3.3) which prevents its lateral spreading, but yielding a negligible contribution to the afterglow emission.
The decay of the radio emission from the reverse shock is determined by the evolution of and of the peak flux , which depend on the distribution of energy with Lorentz factor in the ejecta and on the Lorentz factor of the ejecta which catch-up with the leading edge of the fireball at some observer time . For the dynamics of the latter, we consider the simple law for the fireball energy. Most likely, the ejecta are expelled over a timescale much shorter than the observer time ( day) when the afterglow observations are made. Because of this, the Lorentz factor of the freely expanding ejecta which enter the afterglow fireball at days is independent on the duration of the ejecta release. From the kinematics of the ejecta–fireball catch-up, one obtains that
| (39) |
where is the Lorentz factor of the decelerating fireball (eq.[20]). Since the fireball Lorentz factor at 100 days is less than a few, the above equation shows that, in order for the reverse shock to last for days, the GRB progenitor must release ejecta whose initial Lorentz factor is . We note that the above ratio of Lorentz factors is time-independent. Because the Lorentz factor of the reverse shock in the comoving frame of the unshocked ejecta depends on this ratio, it follows that the reverse shock Lorentz factor and the typical electron energy behind the reverse shock do not evolve in time. Then, if the magnetic parameter is also the same (which implies that the magnetic field is identical), the reverse shock injection frequency evolves as , where is the injection frequency behind the forward shock.
The equality of behind both shocks also implies that the ratio of the reverse to forward shock peak fluxes is just the ratio of the corresponding number of emitting electrons, , where and are the ejecta mass and that of the swept-up circumburst medium, respectively. For simplicity, we assume that the mass of the ejecta energized by the reverse shock increases as a power-law in the Lorentz factor of the incoming ejecta:
| (40) |
therefore (see eq.[39]). Equation (40) is equivalent to the assumption that the energy distribution in the ejecta is .
Using equations (22) and (26) with , the evolution of the reverse shock injection frequency and peak flux are
| (41) |
From here it can be shown that the radio flux from the reverse shock, , evolves as with
| (42) |
where is the electron index for the reverse shock, which we assume to be the same as for the forward shock. The exponent which quantifies the amount of injected energy can be estimated from the observed optical light-curve decay index . From equations (22), (13), and (26), it can be shown that the decay index of the forward shock optical light-curve is
| (43) |
where is the electron distribution index for the forward shock, which can be determined from the observed optical spectral slope .
Equations (42) and (43) and the observed decay indices (Table 3) allow the determination of the indices and . Generally, there are three constraints that these indices must satisfy. First, if the injected energy () exceeds that existing initially (), then the exponents and are not independent. From , and equation (20), one obtains
| (44) |
However, an energy injection that is dynamically unimportant () does not necessarily imply a negligible injected mass: in the limit, and are independent quantities. Given that the radio shallow decays are observed to last for 1–2 decades in time, the constraint given in equation (44) should be used only for , corresponding to at least a two-fold increase of the fireball energy. The second constraint is that the light-curve steepening given in equation (27), resulting from seeing the core edge, must be larger than that observed in the optical, (Table 3). The reason is that, if measurements did not capture the asymptotic early-time optical light-curve index, then the determined through power-law fits to the pre- and post-break emission is an underestimation of the true index increase . The third constraint is that must exceed the lowest value allowed by radiative losses: .
Imposing the above constraints for the indices and , we find that the energy injection scenario is compatible with the observations in the following cases:
-
1.
GRB 991208,
-
•
and (with , ),
-
•
and (, ),
-
•
and (, ),
leading to reverse shock peak fluxes evolutions (eq.[41]) which are consistent with those measured by Galama et al. (2003), but to injection frequencies whose evolutions are marginally consistent with the observations,
-
•
-
2.
GRB 991216, for
-
•
and (, ),
-
•
and (, ),
while for
-
•
and (, ),
-
•
and (, ),
-
•
and (, ),
-
•
-
3.
GRB 000926, and (, ),
-
4.
GRB 010222,
-
•
and (, ),
-
•
and (, ).
-
•
For the slope of the optical continuum determined by Rhoads & Fruchter (2001), the sharp fall-off of the optical emission of 000301 is exceeds that allowed by the core edge becoming visible. Alternatively, that steep decay would require the outflow energy to decrease faster than allowed by radiative losses. Therefore, the properties of the afterglow 000301 cannot be accommodated by the current scenario, and will be left out for the remainder of this section.
The above values of the parameter show that the energy of the ejecta reaching the forward shock over a tenfold increase in observer time is at most comparable to the initial ejecta energy. This is due to that, for the observed optical spectral slope , a significant energy injection reduces the optical light-curve steepening expected when the core edge becomes visible (eq.[27]) below that which is observed. For generality, we maintain the parameter in the following equations, although for the four anomalous afterglows.
As a further test for the reverse–forward shock scenario, we require that the forward shock emission is dimmer than that from the reverse shock emission at radio frequencies and that the latter does not overshine the former in the optical. For this test, we make use of equations (22), (26), and (41) for the evolution of the spectral characteristics, noting that the cooling frequency is the same for both shocks, as the internal energy density, bulk Lorentz factor, and comoving frame fireball age have the same values behind both shocks.
From equation (13), the reverse shock optical emission at , when is below the radio domain, is
| (45) |
The condition that the slower decaying reverse shock emission does not overshine that from the forward shock, , until the last optical measurement (), leads to an upper limit on the cooling frequency:
| (46) |
As for the case of a structured outflow (§3.3), the radio emission from the reverse shock is not overshined by that from the forward shock, , if , where is the time when crosses the radio domain. This condition leads to the same lower limit for the forward shock injection frequency () as in equation (34), except that now
| (47) |
and the cooling frequency is that given in equation (46). The lower limit on implies a lower limit on the forward shock injection frequency at the time of the first optical observation, , which must be redward of the optical domain, to explain the decay of the optical light-curve. This requirement provides a non-trivial test for the reverse–forward shock scenario, as there are cases where, even for the highest injection frequency allowed by equation (1), the peak flux of the forward shock emission at the when reaches the radio domain is brighter than the observed radio flux (attributed to the reverse shock). The above cases that satisfy this constraint are:
-
1.
GRB 991208
-
•
, Hz, ,
-
•
, Hz, Hz,
-
•
-
2.
GRB 991216, for
-
•
, Hz, ,
-
•
, Hz, ,
while for , , Hz, ,
-
•
-
3.
GRB 000926, , Hz, ,
-
4.
GRB 010222,
-
•
, Hz, Hz,
-
•
, Hz, GHz.
-
•
Finally, the reverse–forward shock scenario must satisfy two other constraints: the observed optical flux at the break time, , and the passage through the radio domain of the reverse shock frequency at time when the radio light-curve begins to fall-off. The former determines the peak flux of the forward shock emission:
| (48) |
The latter constrains the fireball Lorentz factor, as following. If the microphysical parameters and have the same values behind both shocks, then the ratio of the reverse shock to the forward shock injection frequencies is
| (49) |
is the Lorentz factor of the shocked ejecta in the frame of the incoming, undecelerated ejecta. Note that for , for and for , therefore the reverse shock crossing the ejecta is semi-relativistic. Taking into account the evolution of the reverse shock injection frequency (eq.[41]) and equation (49), the condition is equivalent to
| (50) |
With the aid of equations (34), (46), (47), (48), and (50), one can determine , , , and from afterglow observations, which can be turned into four constraints for the four basic afterglow parameters , (or for a wind), , and , after using equations (1), (2), (3), (8), (9), and the expressions for the fireball Lorentz factor (e.g. Panaitescu & Kumar 2000):
| (51) |
From here, the allowed ranges of each parameter can be used as a test of the reverse–forward shock scenario by requiring that and are below unity, and that and (or ) have plausible values. For the cases outlined above, involving a homogeneous medium, we find the following constraints on the afterglow parameters
-
1.
GRB 991208, ergs/sr, , , ,
-
2.
GRB 991216, ergs/sr, , , ,
-
3.
GRB 000926, ergs/sr, , , ,
-
4.
GRB 010222, ergs/sr, , , .
Compared to the afterglow parameters found by us (Panaitescu & Kumar 2002) through fitting the radio, optical and -ray light-curves of these afterglows with the forward shock model (i.e. without any contribution from the reverse shock), the above kinetic energies per solid angle for the reverse–forward shock model are slightly lower, the magnetic field parameter is somewhat larger, while the circumburst densities and electron energy parameter are similar. The largest discrepancy occurs for the afterglow 010222, for which radio data were not available at the time when our afterglow fits were done.
For a wind-like medium, the required kinetic energies are below ergs/sr, the microphysical parameters are slightly larger, and the wind density corresponds to . We note that kinetic energies under ergs/sr require an extremely efficient GRB mechanism to yield the observed -ray outputs, ranging from to ergs/sr (Bloom, Frail & Sari 2001) for the above four afterglows, thus a wind-like medium is somewhat less favoured.
3.5 Non-Relativistic Outflows
The scenarios considered so far involved relativistic fireballs. For either a spherical outflow or a jet with sharp edges, the afterglow light-curves asymptotically reach the same decay as the outflow becomes non-relativistic because the lateral spreading of the jet diminishes and the entire emitting surface is visible in both cases. As shown by Vietri & Waxman (2000), for a jet, the transition to the non-relativistic regime mitigates the light-curve decay, while for a fireball it leads to a steeper decay. This may suggest that a slow radio decay following a fast optical fall-off may be explained by a jet becoming non-relativistic (Frail et al. 2004).
In the above scenario, the optical light-curve is (relativistic jet). From the basic equations for dynamics and evolution of spectral parameters, the radio flux from a non-relativistic fireball is found to be
| (52) |
For the electron distribution index implied by the optical light-curve index (Table 2), the resulting radio decay is significantly steeper than observed for the afterglows 000301 and 000926, for either type of medium. For the afterglows 991208, 991216, and 010222, a homogeneous medium leads to radio decays shallower than observed, while a wind medium yields radio fall-offs that are too steep. Since the non-relativistic transition flattens the decay of the emission from a jet, it can be argued that a semi-relativistic motion leads to a milder flattening than expected for the non-relativistic regime, becoming thus compatible with the afterglows 991208, 991216, and 010222, for which the expected asymptotic radio decay is too shallow in the case of a homogeneous medium.
A severe problem with the scenario of a relativistic optical and semi-relativistic radio afterglow is that it requires the shallow radio decay to be seen after the steeper optical fall-off. Therefore this scenario cannot be at work in the afterglows 991216 and 010222, whose radio and optical observations overlap in time over one and almost two decades, respectively. For the afterglows 991208, 000301, and 000926, the overlap is short-lived, still it is rather unlikely that, during the short time interval from the last optical measurements and untill the onset of the radio decay, a relativistic jet decelerating as can slow down to a semi-relativistic motion.
We note that a scenario where the fireball becomes non-relativistic before the onset of the optical fall-off cannot explain the observed index difference . Above the cooling frequency, the light-curve for a non-relativistic afterglow is
| (53) |
Using equation (52), it follows that, when the cooling frequency is between the radio and optical domains, for a homogeneous medium and for a wind, neither of which is compatible with the observations of the five anomalous afterglows.
As the non-relativistic motion of a uniform GRB remnant seems unable to accommodate the five anomalous afterglows, we turn our attention to a structured outflow. We consider again the dual outflow scenario, which allows a maximal decoupling of the radio emission, arising from the non-relativistic, uniform outflow envelope, from the optical emission produced by a relativistic, uniform core. Equation (51) shows that, for the envelope to become non-relativistic at days after the burst, the external density must be or the GRB progenitor must have a wind with (i.e. much larger than for any known type of massive star), where is the kinetic energy per solid angle in the radio envelope.
Substituting in equations (1), (4), and (5), such high densities lead to an optically thick afterglow at the peak of the synchrotron spectrum at , therefore the self-absorption frequency is given by , instead of equations (4)–(5), where is the optical thickness to self-absorption at the injection frequency, being the electron column density of the swept-up circumburst medium, and the electron charge. For and a homogeneous medium with the high density required by the early onset of the non-relativistic regime, the resulting self-absorption frequency is
| (54) |
If the radio domain were self-absorbed at , the radio emission would rise as (for ; Frail, Waxman & Kulkarni 2000) during the non-relativistic phase. Therefore the observed radio fall-off implies that the radio emission from the envelope is optically thin at . Then, equation (54) leads to erg/sr. For such a low energy per solid angle in the envelope, the condition for non-relativistic motion at days becomes . Making use of equation (51), for this circumburst density, the optical core must have an energy per solid angle erg/sr for the core to remain relativistic untill at least 10 days and accommodate the observed steep optical decay. Assuming the same microphysical parameters in the entire outflow, that (eq.[8]) implies that the peak flux of the core emission is much larger than that of the envelope emission. As it softens, the core emission should become brighter at radio frequencies than the envelope, therefore this scenario cannot decouple the radio and optical emissions and cannot account for the five anomalous afterglows.
4 Conclusions
As shown in Figure 1, the power-law decays of the radio and optical emissions of the GRB afterglows 970508, 980703, 000418, and 021004 are similar, as is expected in the simplest form of the relativistic fireball model (adiabatic dynamics, uniform outflow, no energy injection, constant microphysical parameters). The shallow decay of the radio emission of the afterglow 010222 is only marginally compatible with that from a spreading jet but requires some extreme parameters (§2.4). However, the shallow radio decay and the steep optical fall-off of the afterglows 991208, 991216, 000301, and 000926, cannot be explained within the simplest afterglow model (see also Frail et al. 2004). The reason is that, for this model to explain the observations, the injection frequency should be between the radio and optical domains until about 100 days, which, as shown in §2.2 and §2.3, leads to a radio emission much brighter than observed.
We are thus forced to consider scenarios that decouple the radio and optical decay indices. Assuming that the radio and optical emissions arise from the same population of electrons energized by the forward shock, we have investigated two scenarios involving microphysical parameters that vary in time. Alternatively, the low and high frequency emissions may arise in different parts of the fireball if the outflow has an angular structure or if there is a long-lived reverse shock.
In the former category, we considered the case where there is no spectral break between the radio and optical domains, requiring a variable slope of the synchrotron spectrum, i.e. a time-varying slope of the electron power-law energy distribution . The evolution of can be determined (§3.1) by requiring that the resulting optical light-curve is a power-law in time, as the longest time coverage with the least measurement errors is achieved in this domain. For the five afterglows with shallow radio decays, we obtain that should increase in time, which implies that the optical spectrum should soften in time, the radio light-curves decay should steepen (), while -ray light-curves should flatten (). With the exception of the afterglow 000301, the resulting radio and -ray light-curve decays and the optical spectral slope are in conflict with the observations.
Also in the first category, we investigated a scenario where the cooling frequency is between the radio and optical domains. In this case the optical and -ray decays should to be identical, as for the afterglows 000926 and 010222, but inconsistent with the observations for 991216. To explain the shallowness of the radio decays and the steepness of the optical light-curves, must decrease faster than usually expected ( for a homogeneous medium), which requires an increasing magnetic field parameter . The evolution of and that of the parameter for minimal electron energy were determined from the observed radio and optical decay indices (§3.2). We found that, if there is no energy injection, for any geometry of the ejecta (spherical or collimated) and any radiative regime, must decrease and must increase with time333 By modeling the broadband emission of four GRB afterglows with evolving , Yost et al. (2003) have found that good fits can be obtained for decreasing slower than or increasing slower than . For both a homogeneous or a wind-like medium, the increase of is so strong that the magnetic field is either constant or increases in time, which is not consistent with a field arising in a turbulent, decelerating flow, but could be compatible with a GRB occurring in a pulsar bubble (Konigl & Granot 2002), where the fireball interacts with a magnetized medium, provided that a supernova occurred years before the burst. If there is energy injection, solutions with constant are possible; however, this scenario leads to evolutions of the peak flux and injection frequency which are in contradiction with the behaviors inferred by Galama et al. (2001) for the afterglow 991208 from its radio observations. A magnetic field strength that decreases in time can obtained if the density of the circumburst medium increases with radius. In this case, the resulting evolutions of and are more consistent with the observations of 991208 if the outflow is collimated.
We did not considered a scenario where all microphysical parameters (, , ) evolve in time, such that the difference observed between the radio and optical decay indices is due both to a steepening electron distribution and a cooling frequency decreasing faster than usually. The increase of the electron index would reduce the required increase of , though a significant evolution of the former would probably lead to -ray light-curve decays that are too steep compared with those observed for the afterglows 000926 and 010222.
In the second type of scenarios, we have considered a dual outflow endowed with a uniform core of higher energy per solid angle, emitting the optical afterglow, surrounded by a uniform envelope of a lower energy density, releasing the radio afterglow. This scenario allows a better decoupling of the radio and optical emissions than for an outflow with a smooth angular structure, and finds support in the steepenings (”breaks”) observed in the decay of the optical afterglows 991216, 000301, 000926, and 010222, at around 1 day after the burst. Such breaks are expected when the boundary of the optical core becomes visible to the observer. Another possibility is that the low frequency afterglow emission arises in the semi-relativistic reverse shock occurring when there is a continuous inflow of ejecta into the fireball, while the higher frequency emission is (as usually) attributed to the forward shock. To explain the observed steepening of the optical decay, we have maintained the premise of a structured outflow, but we have ignored the radiation emitted by the envelope.
Within the framework of these two scenarios, we required that the softening of the emission from the optically radiating region does not make its radio contribution overshine the low frequency emission from the radio emitting region. This requirement sets a lower bound (eq.[34]) on the injection frequency for the optical component at the time ( day) when the optical light-curve break is observed. At the same time, we required that the shallower decaying emission from the radio component does not yield an optical contribution exceeding that arising from the optical region. This condition leads to an upper limit on the cooling frequency for the radio outflow (eq.[46]).
For the anisotropic outflow scenario (§3.3), a stringent test is provided by the lower limit (eq.[38]) on the injection frequency of the radio emitting envelope which can be derived from that of the optical core. Since the onset of the radio decay is due to the passage of the former injection frequency through the radio domain, the lower limit on it should be below 10 GHz. For the four afterglows (991208, 991216, 000926, 010222) with slowly decaying radio emission and optical breaks compatible with a structured outflow, this condition is at best marginally satisfied. In those marginal cases, total electron energies exceeding equipartition with protons and very dense external media, leading to a self-absorbed radio emission and semi-relativistic fireball. Therefore, the structured outflow scenario cannot account for all the radio and optical properties of the above four afterglows.
In the reverse–forward shock scenario (§3.4), we found that the sets of parameters describing the energy and mass injection which are self-consistent and which can explain the magnitude of the break observed in optical light-curves, correspond to a modest increase in the fireball energy, by less than a factor 2. To explain the shallowness of the radio decay, the incoming ejecta must have an energy distribution which increases rapidly with decreasing Lorentz factor: for a homogeneous medium and for a wind-like medium. An important constraint is provided by that the afterglow optical light-curves decay from the time of the first measurement, which requires that the lower bound on the forward shock injection frequency is redward of the optical domain at . This lower limit, the upper limit on the cooling frequency (see above), the observed optical flux, and the condition that the reverse shock injection frequency crosses the radio domain when the radio decay starts, provide four constraints for the fireball kinetic energy per solid angle (), external particle density (), and microphysical parameters , and . We found that, to explain the properties of the radio and optical light-curves of the afterglows 991208, 991216, 000926 and 010222, the reverse–forward shock scenario requires total electron energy and magnetic field parameters which are close to equipartition, circumburst particle densities between and , and low fireball kinetic energies (upper limits ranging from to ergs/sr), which require a very efficient GRB mechanism. These parameters are roughly consistent with those inferred through modeling of the afterglow broadband emission with the external shock only (Panaitescu & Kumar 2002). Overall, the reverse–forward shock scenario is the most promising of all scenarios discussed here in accommodating the shallow radio decay observed for the five anomalous GRB afterglows.
A possibility not discussed so far is that the anomalous radio/optical afterglows are due to a new type of spectral break located between the radio and optical domains. Such a feature has been used to explain the broadband emission of the afterglows 991208 and 000301 (Li & Chevalier 2001, Panaitescu 2001). The passage of this break frequency () through the optical domain yields a softening of the optical spectral slope simultaneous to the light-curve break, as seems to have been the case for the afterglow 000301. To determine the evolution of requires a measurement of the optical spectral slope is redward of the optical domain. Such measurements exist only for the afterglows 991208 and 991216, for which we find that for a homogeneous medium and for a wind-like medium, assuming that the ejecta are spherical. These scalings correspond to a break in the electron distribution at energy satisfying and , respectively, where is the fireball Lorentz factor. While the former scaling has no obvious interpretation, the latter is not far from the expected for , if the total electron energy is assumed to be a constant fraction of the post-shock energy.
Acknowledgments. We thank Shri Kulkarni and Dale Frail for interesting and stimulating discussions about GRB afterglows.
References
-
[1]
Bloom, J. et al. 1999, GCN #480
- [2] Bloom, J., Frail, D., Sari, R. 2001, ApJS, 121, 2879
- [3] Castro-Tirado, A. et al. 2001, A&A, 398, 370
- [4] Chevalier, R. & Li, Z.-Y. 2000, ApJ, 536, 195
- [5] Djorgovski, S. et al. 1999, GCN #481
- [6] Frail, D. et al. 2000, ApJ, 538, L129
- [7] Frail, D., Waxman, E. & Kulkarni, S. 2000, ApJ, 537, 191
- [8] Frail, D. et al. 2004, ApJ, in press (astro-ph/0308189)
- [9] Fynbo, J. et al. 2001, A&A, 373, 796
- [10] Galama, T. et al. 2000, ApJ, 541, L45
- [11] Galama, T. et al. 2003, ApJ, 587, 135
- [12] Garnavich, P. et al. 2000, ApJ, 543, 61
- [13] Halpern, J. et al. 2000, ApJ, 543, 697
- [14] Jensen, B. et al. 2001, A&A, 370, 909
- [15] Jha, S. et al. 2001, ApJ, 554, L155
- [16] Konigl, A. & Granot, J. 2002, ApJ, 569, 134
- [17] Kulkarni, S. et al. 1999, Nature, 398, 389
- [18] Kumar, P. & Panaitescu, A. 2001, ApJ, 541, L9
- [2] Bloom, J., Frail, D., Sari, R. 2001, ApJS, 121, 2879
-
[19]
Kumar, P. & Granot, J. 2003, ApJ, 591, 1075
- [20] Lee, B. et al. 2001, ApJ, 561, 183
- [21] Li, Z.-Y. & Chevalier, R. 2001, ApJ, 551, 940
- [22] Livio, M. & Waxman, E. 2000, ApJ, 538, 187
- [23] Mészáros , P. & Rees, M. 1997, ApJ, 476, 232
- [24] Mészáros , P., Rees, M. & Wijers, R. 1998, ApJ, 499, 301
- [25] Panaitescu, A., Mészáros , P. & Rees, M. 1998, ApJ, 503, 314
- [26] Panaitescu, A. & Kumar, P. 2000, ApJ, 543, 66
- [27] Panaitescu, A. 2001, ApJ, 556, 1002
- [28] Panaitescu, A. & Kumar, P. 2002, ApJ, 571,779
- [29] Rees, M. & Mészáros , P. 1998, ApJ, 496, L1
- [30] Rhoads, J. 1999, ApJ, 525, 737
- [31] Rhoads, J. & Fruchter, A. 2001, ApJ, 546, 117
- [32] Sari, R., Piran, T., & Narayan, R. 1998, ApJ, 497, L17
- [33] Sari, R., Piran, T., & Halpern, J. 1999, ApJ, 519, L17
- [34] Stanek, K. et al. 2001, ApJ, 563, 592
- [35] Wijers, R., Rees, M. & Mészáros , P. 1997, MNRAS, 288, L51
- [36] Yost, S., Harrison, F., Sari, R. & Frail, D. 2003, ApJ, 597, 459
- [20] Lee, B. et al. 2001, ApJ, 561, 183
- [37]
TABLE 1. Definitions of quantities pertaining to afterglow dynamics and radiation
| Notation | Definition |
|---|---|
| synchrotron self-absorption frequency | |
| injection frequency (synchrotron characteristic frequency for the typical electron energy) | |
| cooling frequency (synchrotron characteristic frequency for electrons whose radiative cooling timescale equals the fireball age) | |
| flux at the peak of the synchrotron spectrum | |
| index of the afterglow power-law light-curve | |
| increase of the optical decay index at | |
| slope of the afterglow power-law spectrum | |
| fireball kinetic energy per solid angle, (O) for the optical core, (R) for the radio envelope | |
| index of power-law electron energy distribution, | |
| parameter for the minimum electron energy. For , the electron total energy is a fraction of the post-shock energy | |
| fraction of post-shock energy imparted to the magnetic field | |
| index of circumburst medium particle density, | |
| typical frequency for the radio and optical domains, respectively | |
| (R) | superscript for the radio emitting outflow envelope or reverse shock |
| (O) | superscript for the optically emitting outflow core |
| (F) | superscript for the forward shock |
| epoch of first and last optical measurement, respectively | |
| time when the optical light-curve decay steepens | |
| optical flux at the break-time | |
| time when the radio light-curve begins to fall-off | |
| radio flux at onset of radio decay |
TABLE 2. Temporal scaling of the synchrotron flux from an adiabatic fireball at an observing frequency for the three orderings of the synchrotron break frequencies , , and that may occur at 1–100 days after the burst
| fireball, | fireball, | jet | |||||||
|---|---|---|---|---|---|---|---|---|---|
| case: | (1) | (2) | (3) | (1) | (2) | (3) | (1) | (2) | (3) |
(1): below the lowest spectral break
(2): above the lowest break but below the mid break,
(3): above the mid spectral break but below the highest
TABLE 3. Parameters of radio, optical, and -ray light-curves (see Table 1 for definitions). Uncertainties of decay indices are given in Figure 1. Times in days, fluxes in mJy.
| GRB | ||||||||||
|---|---|---|---|---|---|---|---|---|---|---|
| 991208 | 0.97 | 1.78 | ….. | 4 | ….. | 10 | 1 | |||
| 991216 | 0.69 | 1.59 | 1.82 | 2 | 1 | 0.2 | ||||
| 000301 | 1.26 | 2.68 | ….. | 3 | 5 | 0.015 | 30 | 0.3 | ||
| 000926 | 0.68 | 2.30 | 2.19 | 1 | 1.5 | 0.03 | 20 | 0.4 | ||
| 010222 | 0.43 | 1.27 | 1.39 | 0.2 | 0.6 | 0.06 | 1 | 0.2 |
optical light-curve decay index measured after the break, i.e. at
slope of optical spectrum determined at epoch
a from Castro-Tirado et al. (2001)
b for Galactic reddening of , for
(Garnavich et al. 2000, Halpern et al. 2000)
c after correction for host extinction of (Jensen et al. 2001)
d after correction for host extinction of (Fynbo et al. 2001)
e after correction for host extinction of (Lee et al. 2001, Galama et al. 2003)