GEMS Imaging of Red Sequence Galaxies at : Dusty or Old?
Abstract
We have used the Hubble Space Telescope image mosaic from the Galaxy Evolution from Morphology and SEDs (gems) project in conjunction with the combo-17 deep photometric redshift survey to define a sample of nearly 1500 galaxies with . With this sample, we can study the distribution of rest-frame -band morphologies more than 6 Gyr ago, without differential bandpass shifting and surface brightness dimming across this narrow redshift slice. Focusing on red-sequence galaxies at , we find that 85% of their combined rest-frame -band luminosity density comes from visually-classified E/S0/Sa galaxies down to . Similar results are obtained if automated classifiers are used. This fraction is identical to that found at the present day, and is biased by less than 10% by large scale structure and the morphology–density relation. Under the assumption that peculiar and edge-on disk galaxies are red by virtue of their dust content, we find that less than 13% of the total rest-frame -band luminosity of the red galaxy population is from dusty galaxies.
1 Introduction
A key discriminant between hierarchical galaxy formation in a Cold Dark Matter (CDM) Universe and monolithic galaxy formation scenarios is the evolution of the number of spheroid-dominated galaxies (e.g., Kauffmann et al., 1996; Aragón-Salamanca, Baugh, & Kauffmann, 1998). Yet, it is impossible to identify distant spheroid-dominated galaxies reliably and measure this evolution without sub-arcsecond resolution imaging of large numbers of galaxies with known redshifts. The largest representative sample of morphologically early-type galaxies studied to date was a HST study of 150 galaxies (Im et al., 2002), which was too small to differentiate strongly between hierarchical and monolithic formation of the early-type population. To collect larger samples, workers have instead photometrically selected the reddest galaxies, noting that morphologically early-type galaxies in the local Universe and distant clusters populate a well-defined red sequence (e.g., Bower, Lucey, & Ellis, 1992; Schweizer & Seitzer, 1992; Hogg et al., 2002; Kodama & Arimoto, 1997). In this Letter, we explore the HST rest-frame optical -band morphologies of 1492 galaxies in the thin redshift slice to understand how well the evolution of red galaxies reflects that of the early-type galaxy population.
Careful study of color-selected galaxies has yielded impressive results111Other groups have chosen to study the evolution of distant massive -band selected galaxies. This is a roughly equivalent test, as the most massive galaxies are red at redshifts out to at least one (Bell et al., 2003b). In common with the more recent color-selected surveys, they find mild departures from passive evolution, conceptually consistent with galaxy formation in a hierarchical Universe (e.g., Kauffmann & Charlot, 1998; Drory et al., 2001; Somerville et al., 2003).. Previous work (e.g., Lilly et al., 1995; Lin et al., 1999; Pozzetti et al., 2003) found little evolution in the number density of red galaxies, but with error bars large enough to be consistent with both monolithic and hierarchical evolution of the red galaxy population. Recently, Chen et al. (2003) and Bell et al. (2003b) have used samples of 5000 and 25000 galaxies with high-quality photometric redshifts to show that the total stellar mass in the red galaxy population has increased monotonically since . In the latter case, the sample size was large enough to rule out purely passive evolution with high significance, favoring instead a factor of two stellar mass evolution, in excellent qualitative and quantitative agreement with hierarchical models of galaxy formation.
Nevertheless, a significant or even dominant fraction of distant red galaxies may be red owing to their dust contents, rather than because their stellar populations are old. In the local Universe, typically of the galaxies on the red sequence are morphologically early-type (E, S0 or Sa; Strateva et al., 2001; Hogg et al., 2002). We illustrate this in panel a) of Fig. 1, where we show evolution and -corrected colors as a function of absolute magnitude for a selected222 Where is the volume within which one could observe each galaxy, making this sample essentially volume-limited down to a limiting magnitude. sample of 1500 galaxies from the Sloan Digital Sky Survey (SDSS) selected to have (Bell et al., 2003a, b). Open blue symbols show morphologically late-type galaxies, and solid red symbols show morphologically early-type galaxies. We find that 82% of the combined -band luminosity density from red sequence galaxies in the local Universe comes from morphologically early-type galaxies. Yet, extremely red objects (EROs), galaxies with colors characteristic of early-type galaxies at , seem to be a mix of dusty star-forming galaxies, edge-on spiral galaxies and early-type galaxies, with perhaps as little as 30% of the ERO population being red by virtue of their old stellar populations (e.g., Yan & Thompson, 2003; Moustakas et al., 2003). Therefore, color-selected samples may not give a true picture of the evolution of early-type galaxies.
To better connect between these new large studies of the redshift evolution of the red galaxy population and the evolution of morphologically early-type galaxies, it is necessary to explore the rest-frame optical morphology of red galaxies at redshifts closer to unity. In this Letter, we explore the rest-frame -band morphologies of nearly 1500 galaxies with both deep F850LP HST data from the Galaxy Evolution from Morphology and SEDs (gems) survey (Rix et al., in prep.) and accurate photometric redshifts in the thin redshift slice from the combo-17 survey (‘Classifying Objects by Medium-Band Observations in 17 Filters’; Wolf et al., 2003). Throughout, we assume , , and km s-1 Mpc-1 (where ) following Spergel et al. (2003).
2 The Data
To date, combo-17 has surveyed three disjoint southern and equatorial fields to deep limits (complete to , with integration times of ksec/field) in 5 broad and 12 medium passbands. Using these deep data in conjunction with non-evolving galaxy, star, and AGN template spectra, objects are classified and redshifts assigned for % of the objects. Typical galaxy redshift accuracy is (Wolf et al., in preparation; Wolf et al., 2003), allowing construction of mag accurate rest-frame colors and absolute magnitudes.
To explore galaxy morphology in the rest-frame optical from a single observed passband, we study galaxies in one thin redshift slice. Here, we select galaxies from combo-17 in the Extended Chandra Deep Field South (E-CDFS) for morphological classification in the narrow interval (corresponding to Gyr, minimizing galaxy evolution across this slice). At this redshift, F850LP samples rest-frame -band, allowing comparison with local samples. Furthermore, the sample size is maximized by being at the peak of the combo-17 number counts and through our inclusion of the only two major large-scale structures in the E-CDFS, both at (Gilli et al., 2003).
We use F850LP imaging from the gems survey (Rix et al., in prep.) to provide sub-arcsecond resolution rest-frame -band data for our sample of galaxies. gems surveys a portion of the E-CDFS in the F606W and F850LP passbands to deep limits using the Advanced Camera for Surveys (Ford et al., 2003) on the HST. The gems area is covered by a multiple, overlapping image mosaic that includes the smaller but deeper goods area (Giavalisco et al., 2003). One orbit per pointing was spent on each passband (63 gems tiles and 15 goods tiles), allowing galaxy detection to a limiting surface brightness of mag arcsec-2 (Häußler et al., in prep). At , the ACS resolution of corresponds to pc resolution, roughly equivalent to resolution at Coma cluster distances.
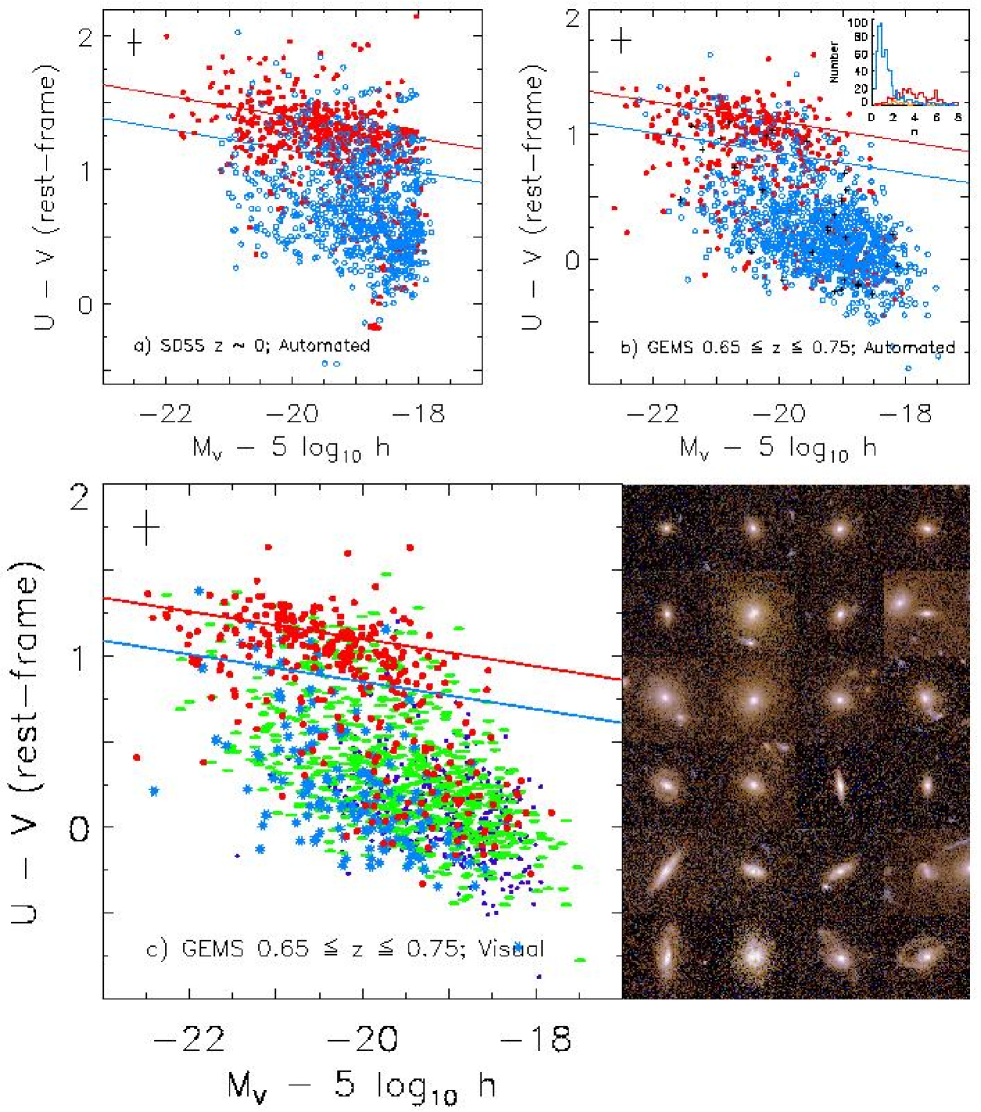
Galaxy classification was carried out both by-eye and automatically on our final sample of 1492 galaxies at . We adopt by-eye classification bins of E/S0, Sa, Sb–Sdm, Peculiar/Strong Interaction, Irregular/Weak Interaction, and unclassifiable (typically because of small galaxy size). Galaxies were classified on the basis of both central light concentration and smoothness. In particular, the difference between S0 and Sa is largely a difference in smoothness, whereas the distinction between Sa and Sb is largely driven by central concentration333Note, however, that our qualitative conclusions remain unchanged whether or not we class the Sa galaxies with the spirals or E/S0s.. The Peculiar/Strong Interaction designation includes galaxies with what appeared to be tidal tails and/or multiple nuclei; below a certain magnitude cut, these features will be too faint to readily recognize, and the galaxies will be classified as Irregular/Weak Interaction. For automated galaxy classification, we fit single-component Sérsic models to all 1492 galaxies using the galfit (Peng et al., 2002) and gim2d (Simard et al., 2002) software packages. The Sérsic (1968) model has a profile with surface brightness , where is the radius and is an index denoting how concentrated the light distribution of a given galaxy is: corresponds to an exponential light distribution, and corresponds to the well-known de Vaucouleurs profile. Typical uncertainties are for of galaxies, as estimated using simulations and galfit/gim2d inter-comparisons. In what follows, we adopt values from galfit, using gim2d to fill in values for galaxies without successful galfit fits. Less than 2% of galaxies were not successfully fit by either code; in panel b) of Fig. 1 these galaxies are denoted by black crosses.
We compare the automated and visual classifications in the inset panel of panel b) of Fig. 1, where we show the distribution of Sb–Sm galaxies as the blue histogram, and the distribution of E/S0 galaxies as the red histogram. One can immediately see that visually-classified spiral galaxies prefer , whereas visually-classified early-type galaxies have higher values, broadly distributed around . In particular, we find that roughly 80% of the visually-classified early-type galaxies have , with less than 25% contamination from later types. This success rate is very similar to the success rate achieved by the Sloan collaboration using a -band concentration parameter cut.
3 The Morphologies of red sequence galaxies
In panels b) and c) of Fig. 1, we show the automatically and visually-determined morphological types of galaxies as a function of their rest-frame -band absolute magnitude and rest-frame color. These particular passbands are chosen for consistency with classic studies of the colors of galaxies in the local Universe (e.g., Sandage & Visvanathan, 1978; Bower, Lucey, & Ellis, 1992), and with the color-based study of Bell et al. (2003b).
Focusing on the red sequence galaxies (those redder than the blue line) at , it is immediately clear that the majority of these galaxies are morphologically early-type (see also the color postage stamps of example red-sequence galaxies)444We defer a study of the nature of blue, morphologically-compact galaxies to a later date.. Down to , we find that 74% of the rest-frame -band luminosity density on the red sequence is from E/S0 galaxies, rising to 85% if Sa galaxies are included as morphologically early-type. Automatic classification gives similar results, with 78% of the -band luminosity density coming from galaxies with Sersic indices . These fractions are very similar to the local Universe (82% of the -band luminosity density; see §1) and with an E/S0 fraction of % for the red galaxy subsample from Im et al. (2002). The remaining red sequence luminosity density comes from spiral galaxies (10%), which are primarily highly inclined, and interacting/peculiar galaxies (5%).
Furthermore, under the reasonable assumption that galaxies that are red owing to their dust content will have peculiar (5% of the total rest-frame -band luminosity density) and/or highly-inclined disk (8% of the total luminosity density) morphologies, we place an upper limit of 13% on the fraction of rest-frame -band luminosity density that is from galaxies that are dust-reddened rather than old. Interestingly, most dust-reddened galaxies at are edge-on spiral galaxies rather than dust-enshrouded starbursts.
The comoving volume probed by this sample is only comoving Mpc-3. Furthermore, this redshift range contains the only significant large-scale structure in the CDFS; therefore, owing to the morphology-density relation (e.g., Dressler et al., 1997), it is possible that the relative fraction of early-type galaxies to the red galaxy population would be somewhat lower in a cosmologically-representative volume. To check this, we explored the F850LP visual morphologies of an unbiased sample of 51 galaxies with and . We found that 66% of the red-sequence galaxies were E/S0, 12% were edge-on disks, 14% were less inclined disks (Sa–Sb), and 8% were possible interactions. Not withstanding the small number statistics, this suggests that the environmental bias in the fraction of red galaxies that are morphologically early-type is % (74% E/S0 at vs. 66% E/S0 at ).
4 Comparison with EROs
Morphologically early-type galaxies form less than 40% of the ERO (galaxies with the colors of passively-evolving stellar populations with ) population; the rest consists of edge-on disks and dusty starbursting galaxies (Yan & Thompson, 2003; Moustakas et al., 2003). Nevertheless, we find that in complete samples with well-defined redshift ranges % of red sequence galaxies with are morphologically early-type over the last half of the Universe’s evolution. While we cannot rule out strong evolution of the red galaxy population in the 3 Gyr between and , it is possible that the main difference between our and the ERO results is sample selection. EROs are selected to have observed frame red optical–near-infrared colors, and are therefore an inhomogeneous mix of intrinsically red galaxies at a variety of different redshifts. For example, intrinsically very red but relatively faint and numerous edge-on galaxies at lower redshifts may have the same apparent -band magnitudes as rather less intrinsically red but more luminous and rare early-type galaxies at higher redshifts, boosting the observed fraction of edge-on galaxies. A detailed census of a large sample of EROs with morphological and redshift information should help to definitively disentangle the roles of dust and old stellar populations in driving the colors of red galaxies at .
5 Monolithic or hierarchical formation of spheroids?
We find that the dominant portion of the rest-frame -band light from red-sequence galaxies at all redshifts comes from morphologically early-type galaxies. At first sight, this result cannot distinguish between a monolithic, early origin for spheroids or a hierarchical, extended build up. Yet, taken together with the clear detection of stellar mass increase in the red sequence over the last Gyr (Bell et al., 2003b; Chen et al., 2003), a hierarchical origin of spheroids is favored at this stage. A more detailed investigation of morphologically-selected spheroids, decomposing galaxies into both bulge and disk components, is clearly required to make further progress towards this important goal.
References
- Aragón-Salamanca, Baugh, & Kauffmann (1998) Aragón-Salamanca, A., Baugh, C. M., & Kauffmann, G. 1998, MNRAS, 297, 427
- Bell et al. (2003a) Bell, E. F., McIntosh, D. H., Katz, N., Weinberg, M. D. 2003a, ApJS, in press (astro-ph/0302543)
- Bell et al. (2003b) Bell, E. F., Wolf, C., Meisenheimer, K., Rix, H.-W., Borch, A., Dye, S., Kleinheinrich, M., & McIntosh, D. H., 2003b, submitted to ApJ (astro-ph/0303394)
- Blanton et al. (2003) Blanton, M. R., et al. 2003, ApJ, 594, 186
- Bower, Lucey, & Ellis (1992) Bower, R. G., Lucey, J. R., & Ellis, R. S. 1992, MNRAS, 254, 601
- Chen et al. (2003) Chen, H.-W., et al. 2003, ApJ, 586, 745
- Dressler et al. (1997) Dressler, A., et al. 1997, ApJ, 490, 577
- Drory et al. (2001) Drory, N., Bender, R., Snigula, J., Feulner, G., Hopp, U., Maraston, C., Hill, G. J., & Mendes de Oliveira, C. 2001, ApJ, 562, L111
- Ford et al. (2003) Ford, H., et al. 2003, SPIE, 4854, 81
- Giavalisco et al. (2003) Giavalisco, M., et al. 2003, ApJL, in press (astro-ph/0309105)
- Gilli et al. (2003) Gilli, R., et al. 2003, ApJ, 592, 721
- Hogg et al. (2002) Hogg, D. W., et al. 2002, AJ, 124, 646
- Im et al. (2002) Im, M., et al. 2002, ApJ, 571, 1361
- Kauffmann & Charlot (1998) Kauffmann, G., & Charlot, S. 1998, MNRAS, 297, L23
- Kauffmann et al. (1996) Kauffmann, G., Charlot, S., & White, S. D. M. 1996, MNRAS, 283, L117
- Kodama & Arimoto (1997) Kodama, T., & Arimoto, N. 1997, A&A, 320, 41
- Lilly et al. (1995) Lilly, S. J., Tresse, L., Hammer, F., Crampton, D., & Le Fèvre, O. 1995, ApJ, 455, 108
- Lin et al. (1999) Lin, H., et al. 1999, ApJ, 518, 533
- Moustakas et al. (2003) Moustakas, L. A., et al. 2003, ApJL, in press (astro-ph/0309187)
- Peng et al. (2002) Peng, C. Y., Ho, L. C., Impey, C. D., & Rix, H.-W. 2002, AJ, 124, 266
- Pozzetti et al. (2003) Pozzetti, L., et al. 2003, A&A, 402, 837
- Sandage & Visvanathan (1978) Sandage, A., & Visvanathan, N. 1978, ApJ, 225, 742
- Schweizer & Seitzer (1992) Schweizer, F., & Seitzer, P. 1992, AJ, 104, 1039
- Sérsic (1968) Sérsic, J. L. 1968, Atlas de Galaxies Australes (Cordoba: Observatorio Astronomico)
- Simard et al. (2002) Simard, L., et al. 2002, ApJS, 142, 1
- Somerville et al. (2003) Somerville, R. S., et al. 2003, ApJL, in press (astro-ph/0309067)
- Spergel et al. (2003) Spergel, D. N., et al. 2003, ApJS, 148, 175
- Strateva et al. (2001) Strateva, I., et al. 2001, AJ, 122, 1861
- Wolf et al. (2003) Wolf, C., Meisenheimer, K., Rix, H.-W., Borch, A., Dye, S., & Kleinheinrich, M. 2003, A&A, 401, 73
- Yan & Thompson (2003) Yan, L., & Thompson, D. 2003, ApJ, 586, 765