Large-scale Gas Dynamics in the Milky Way
Abstract
We present new gas flow models for the Milky Way inside the solar circle. Using a mass model derived from the COBE/DIRBE maps and clump giant star counts, and using a parametric model for the spiral arm pattern in the disk, we calculate the gas flow and compare with 12CO observations. We find that models with 4 spiral arms fit the observations better then 2-armed models. We also find that models with separate pattern speeds for the bar and spiral arms can explain the gas flow in the bar corotation region better than single-pattern speed models.
Astron. Institut Uni Basel, Venusstr. 7, 4102 Binningen, Switzerland.
Institut für Mathematische Stochastik, Universität Göttingen, Lotzestr. 13, 37089 Göttingen, Germany.
1. Introduction
The Milky Way (MW) is the best studied galaxy and is particularly interesting for studies of galactic structure such as bars and spiral arms and dynamics. While it has been notoriously difficult to assess the MW’s large scale structure and dynamics because of our position within the galactic plane, a rich amount of small scale details will allow to test theories of galaxy dynamics and evolution once this problem is solved. One longstanding problem is the origin and dynamics of spiral arms. In particular for the MW: what is the shape and amplitude of the spiral arms? Do they rotate with a fixed pattern speed? Is the bar the driving force behind the spiral pattern, or do bar and spiral arms have multiple pattern speeds?
2. Models for the mass distribution
Models for the mass distribution of the Milky Way have been constructed based on parametric fits for disk and bulge to the observed NIR luminosity distribution with a constant mass-to-light ratio for each component, and an analytical description of the dark matter halo. Perhaps the most successful axisymmetric model has been given by Kent (1992), who used the (K-Band) IRT map to fit parametric models for disk and bulge and compared to the rotation curve derived from atomic hydrogen 21-cm maps.
This basic approach was also followed by recent studies using the higher quality COBE/DIRBE near-IR maps which open new possibilities for studies of non-axisymmetric structure in the bulge and inner disk. The peanut shape of isophotes in the bulge has been attributed to a bar or triaxial bulge (Dwek et al. 1995; Binney, Gerhard, & Spergel 1997; Freudenreich 1998), which has been claimed to exist since the early galactic 21 cm maps (see in Gerhard 1996).
Unlike distant galaxies, our view of the inner Galaxy is subject to perspective effects, which can be used to infer its true 3-dimensional light distribution, and has inspired development of non-parametric deprojection methods. One key ingredient for these methods is the presence of a bar, which is assumed to be nearly 8-fold symmetric.
The quality of such models is limited by angular resolution and depends on the quality of the underlying dust correction model, such as those by Spergel, Malhotra, & Blitz (1996), Drimmel & Spergel (2001). In addition, noise and non-uniqueness limit the predictive power of the deprojected model (Binney et al. 1997; Zhao 2000).
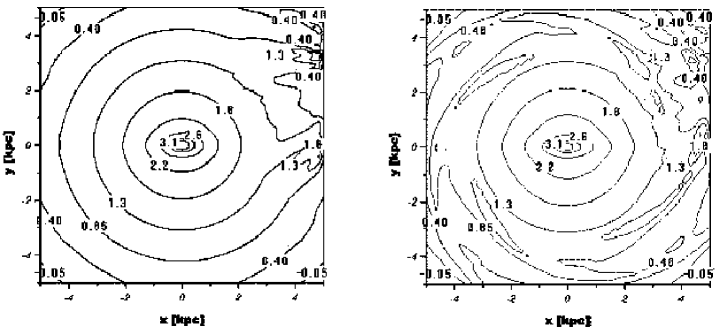
The recovered 3D-structure of one such model is shown in Fig. 1, derived by Bissantz & Gerhard (2002). Their method attempts to iteratively estimate the luminosity distribution in the inner Galaxy from the COBE/DIRBE -band data, while maximizing a penalized likelihood function. This method is non-parametric in the sense that it can adjust the luminosity of approx. 150 000 grid points, which cover the inner 5 kpc of the MW, such that the overall fit to the COBE near-IR map is optimized, that is, no functional form of the density distribution is assumed.
The likelihood function is biased by 3 penalty terms: First, the luminosity density function should be smooth. This is to suppress the amplification of noise in the data. Second, the Galaxy should be approximately 8-fold symmetric. This symmetry is fulfilled by a bar-like distribution, however, spiral arms are 4-fold symmetric. Therefore, a third bias is introduced, namely the model should be close to a given spiral arm model in the galactic plane.
The method attempts to balance between all constraints, and there are statistical arguments and tests which demonstrate that the result is dominated by data and not by one of the penalizing criteria (Bissantz, Munk, & Scholz 2003).

For a given position of the sun with respect to the bar, a best model is found. The non-parametric model is currently limited to the central 5 kpc of the Galaxy. Further out, the model is continued by a parametric model, while at the very center, the density profile is modified to include a cusp.
When comparing the COBE/DIRBE light distribution to the projected model, with or without spiral arms, it fits almost perfectly. Hence, the bar in the galactic center is sufficient to explain the asymmetry in the near-IR light; no clear direct evidence for spiral arms is found in the data. Indirect evidence rather comes from the fact that artificial features in the disk plane are greatly reduced when spiral arms are taken into account (see Fig. 1). More recent studies by Drimmel & Spergel (2001) find weak evidence for a spiral arm pattern in the DIRBE maps when the bar region is excluded.
To improve the disentanglement of bar and spiral arm contributions, additional data is needed. One very useful data set comes from the line-of-sight distribution of red clump giants. Stanek et al. (1994, 1997) observed three fields toward the bulge and found that on the left side of the bulge the maximum of the red clump giant density is nearer than on the right side. Models with spiral arms yield a more elongated bar, which can explain the asymmetry between positive and negative

longitudes in the red clump distribution quite nicely, while models without spiral arms fail to do so (see Fig. 2). Note, that the spiral arms do not contribute significantly themselves to the red clump distribution asymmetry, they merely modify the shape of the deprojected bar.
Another successful model of the mass distribution was found by Fux (1997). His fully self-consistent model was made using bar formation unstable n-body models. By selection from a sample of models, he was able to find a model and time step which is very similar to the observed inner galaxy (residual 0.4%). The precision of this method is limited by the number of models one can run and also by the parametric description of the initial axisymmetric n-body model. Nevertheless, further progress in this direction will help to understand the origin of the galactic bar and its fate.
3. Gas dynamics
Observations of the gas dynamics using Doppler-shifted mm-lines offer a direct way to test models. The Dynamics and distribution of molecular gas in the MW are mostly governed by its dissipative nature and the gravity of the mass distribution. The cold gas orbits around the center of the galaxy, but streamlines are not allowed to cross and shocks modify the gas flow to avoid such crossings. Hence, gas orbits probe different aspects of the underlying potential from stellar orbits. A good mass distribution model for the MW should allow us to reproduce the observed gas distribution and velocities.
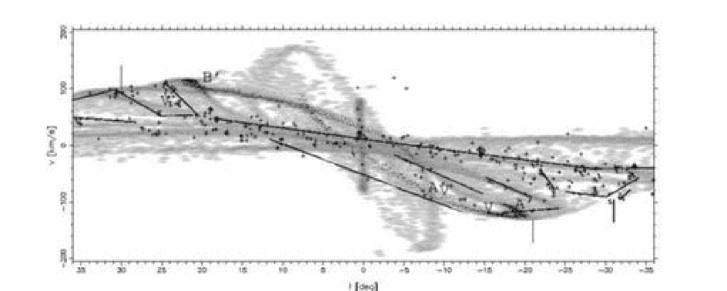
Englmaier & Gerhard (1999) modeled the MW gas flow using SPH, but without a spiral arm pattern in the deprojected mass model. From the model they computed terminal velocity curves and compared them to the observed data. As can be seen in Fig. 3, the fit is quite good and deviations from the observed velocities at most longitudes are of the order of the scatter in the observed data. The terminal curve reflects both the axisymmetric part of the rotation and the streaming velocities induced by in the bar. At radii near the solar radius the dark matter halo starts to contribute significantly to the observed terminal velocities. Hence, it can already be concluded, that the deprojected luminosity distribution together with the assumption of constant mass-to-light ratio is quite capable of reproducing the correct mass distribution in the inner galaxy.
Bissantz, Englmaier, & Gerhard (2003) extended the model by including spiral arms in the mass model. They confirmed the basic parameters for the galactic bar found by Englmaier & Gerhard (1999), i.e. pattern speed km/s/kpc, corotation radius kpc, orientation angle , but also allowed for 3 different values for the fixed pattern speed of the spiral arms, namely 20, 40, and 60 km/s/kpc. In the last model, the spiral pattern corotates with the bar.
In these gas models, at almost any given time, the outer spiral arms smoothly connect to the inner spiral arms. See Sellwood & Sparke (1988) for a similar finding. For any model with a given pair of pattern speeds, a best model time can be found by comparison with the observed gas dynamics.
One can see in these 3 cases, that the spiral pattern differs mostly in the transition region around the corotation radius of the bar, where both the bar and the spiral arms impose perturbations with different pattern speeds. The solution, of course, is time-dependent but nearly periodic. In Fig. 3 time steps which are closest to the observed velocity data are shown. Note, that the spiral arms disappear in the corotation region in the model with a single pattern speed while they pass smoothly through the corotation region of the bar in other models.
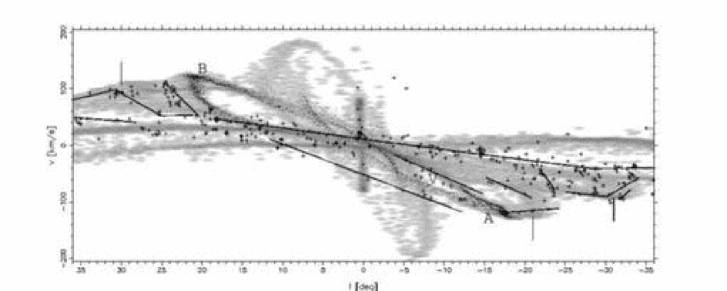
Bissantz et al. (2003) calculated longitude-velocity (lv) diagrams from the SPH models to compare with surveys of the molecular gas (12CO), but also HII regions and giant molecular clouds. One difficulty with lv-diagrams is that a coherent spatial structure does not always correspond to a clear structure in the lv-diagram and vice versa. In general the models reproduce the large scale structure qualitatively and quantitatively quite well, although some features related to an asymmetric mass and gas distribution cannot be reproduced correctly.
In the lv-diagram region which corresponds to the corotation region of the bar, the 12CO molecular gas distribution observed by Dame et al. clearly shows spiral arm ridges and void areas with low gas content. In the models, Bissantz et al. (2003) find similar voids in this region, but only if the spiral pattern rotates slower then the bar pattern (Fig. 4). In the model where the spiral and bar pattern rotate with the same speed, no voids form. The reason is that spiral arms cannot propagate through their own corotation region, because the solution for density waves is exponentially decaying there (Goldreich & Tremaine 1978). Hence, the spiral arms smear out and leave no clear signature in the lv-diagram.
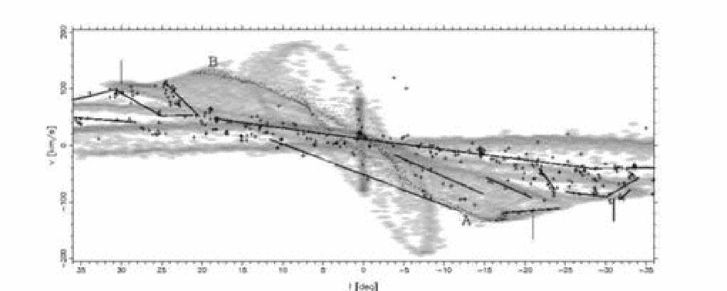
Although a 4–armed pattern in the MW is preferred by many papers, some data seem to indicate a 2–armed pattern (Vallée 1995). Unfortunately, models with 2 spiral arms are also possible with the DIRBE K-band data, while the dust seen in the 240 m data prefers a 4-armed pattern (Drimmel & Spergel 2001). Bissantz et al. (2003) find that 2–armed models produce too few spiral arm ridges in the lv-diagram and they poorly match the observed spiral arm ridges. In other words, if the COBE/DIRBE data is combined with molecular gas data dynamics, a 4–armed pattern is preferred.
References
Binney, J.J., Gerhard, O.E., & Spergel, D. 1997, MNRAS, 288, 365
Bissantz, N., Englmaier, P., & Gerhard, O.E. 2003, MNRAS, 340, 949
Bissantz, N., & Gerhard, O.E. 2002, MNRAS, 330, 591
Bissantz, N., Munk, A., & Scholz, A. 2003, MNRAS, 340, 1190
Drimmel, R., & Spergel, D.N. 2001, ApJ, 556, 181
Dwek, E., Arendt, R.G., Hauser, M.G., Kelsall, T., Lisse, C.M., Moseley, S.H., Silverberg, R.F., Sodroski, T.J., Weiland, J.L. 1995, ApJ, 445, 716
Englmaier, P., & Gerhardt, O.E. 1999, MNRAS, 304, 512
Freudenreich, H.T. 1998, ApJ, 492, 495
Fux, R. 1997, A&A, 327, 983
Gerhard, O.E. 1996, IAU Symposium, 169, 79
Goldreich, P., Tremain, S. 1978, ApJ, 222, 850
Kent, S.M. 1992, ApJ, 387, 181
Sellwood, J.A., & Sparke, L.S. 1988, MNRAS, 231, 25
Spergel, D.N., Malhotra, S., Blitz, L. 1996, in ESO/MPA workshop proc., Spiral Galaxies in the Near-IR, eds.: Minniti, D., & Rix, H.-W. (Berlin: Springer), 128
Stanek, K.Z., Mateo, M., Udalksi, A., Szymanski, M., Kaluzny, J., Kubiak, M. 1994, ApJ, 429, 73
Stanek, K.Z., Udalksi, A., Szymanski, M., Kaluzny, J., Kubiak, M., Mateo, M., Krzeminski, W. 1997, ApJ, 477, 163
Vallée, J.P. 1995, ApJ, 454, 119
Zhao, H.S., 2000, MNRAS, 316, 418