Light element evolution resulting from WMAP data
Abstract
The recent determination of the baryon-to-photon ratio from WMAP data by Spergel et al. (2003) allows one to fix with unprecedented precision the primordial abundances of the light elements D, 3He, 4He and 7Li in the framework of the standard model of big bang nucleosynthesis. We adopt these primordial abundances and discuss the implications for Galactic chemical evolution, stellar evolution and nucleosynthesis of the light elements. The model predictions on D, 3He and 4He are in excellent agreement with the available data, while a significant depletion of 7Li in low-metallicity stars is required to reproduce the Spite plateau.
keywords:
Galaxy: abundances – Galaxy: evolution – nuclear reactions, nucleosynthesis, abundances.1 Introduction
The standard theory of big bang nucleosynthesis (SBBN; e.g., Boesgaard & Steigman 1985; Steigman 1989; Walker et al. 1991) accurately predicts the primordial abundances of the light elements D, 3He, 4He and 7Li, as a function of the cosmic baryon density, , or, equivalently, of the baryon-to-photon ratio, . Since the baryon density is the sole parameter in the SBBN, observations of D, 3He, 4He and 7Li in astrophysical environments not yet affected by subsequent stellar evolution offer a direct way to infer the baryon density of the universe and to assess whether the SBBN theory correctly describes the first three minutes of the hot early universe. Nowadays, there is still disagreement on which is the value of as inferred from i) limits on the primordial deuterium abundance from high-redshift absorption systems (mostly Damped Lyman or Lyman limit absorbers; e.g., Carswell et al. 1994; Songaila et al. 1994; Tytler, Fan & Burles 1996; Rugers & Hogan 1996; Songaila, Wampler & Cowie 1997; Webb et al. 1997; Burles & Tytler 1998; Levshakov, Kegel & Takahara 1998; O’Meara et al. 2001; Pettini & Bowen 2001; Levshakov et al. 2002); ii) estimates of the primordial 4He abundance from extragalactic H II regions (e.g., Olive, Skillman & Steigman 1997; Izotov et al. 1999; Peimbert, Peimbert & Luridiana 2002; see also Pagel 2000 for a review) and iii) estimates of the pristine 7Li content in old, metal-poor ([Fe/H] dex), warm ( K) dwarf stars in the solar neighbourhood (e.g., Spite & Spite 1982; Spite, Maillard & Spite 1984; Spite & Spite 1986; Rebolo, Molaro & Beckman 1988; Thorburn 1992, 1994; Bonifacio & Molaro 1997; Vauclair & Charbonnel 1995, 1998; Théado & Vauclair 2001; Pinsonneault et al. 1999, 2002). Measurements of 3He/H in H II regions in the outer parts of the Galactic disc should provide values very close to the primordial one, owing to the slow evolution of the disc in these regions, but they appear to poorly constrain the range (e.g., Rood et al. 1998; Bania, Rood & Balser 2002).
Data on cosmic microwave background (CMB) anisotropies provide an alternative, independent method for constraining . The first release of results from the Wilkinson Microwave Anisotropy Probe (WMAP; Bennett et al. 2003; Spergel et al. 2003) makes the CMB the prime cosmic baryometer, owing to the high WMAP precision. A combination of WMAP data with other finer scale CMB experiments (ACBAR – Kuo et al. 2002 – and CBI – Pearson et al. 2002) and with astronomical measurements of the power spectrum (2dF Galaxy Redshift Survey measurements – Percival et al. 2001 – and Lyman forest data – Croft et al. 2002; Gnedin & Hamilton 2002) gives , or, equivalently, (Spergel et al. 2003)111Notice that from WMAP data only., where . By adopting the SBBN predictions and using this value, one obtains the primordial abundances of D, 3He, 4He and 7Li, and can use them to compare with observations in low-metallicity environments and to gain insight into chemical evolution.
The aim of this paper is to analyse the effect of adopting primordial abundances predicted by SBBN constrained by WMAP on the chemical evolution of the Milky Way and to gain insights into the mechanisms of light element production/destruction inside stars.
2 Primordial abundances
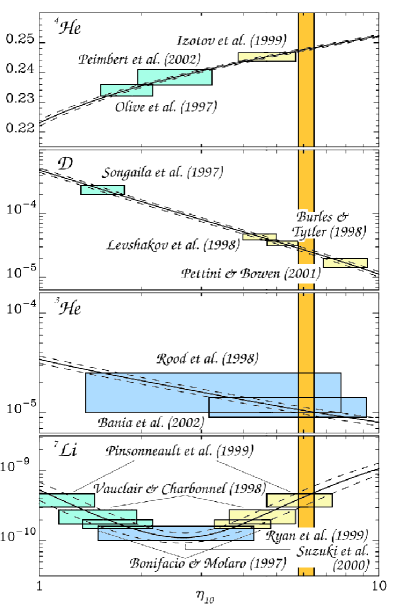
In Fig. 1 we show the primordial abundances of D, 3He, 4He and 7Li predicted by the SBBN model as a function of , with their 1 deviations. Theoretical predictions are from Fiorentini et al. (1998). The values inferred from the observations quoted in the Introduction are also displayed with 1 boxes.
The primordial abundance by mass of 4He () is derived by analysing the helium content in low-metallicity extragalactic H II regions. Since even in the lowest metallicity H II regions some 4He must be produced by stars along with the heavy elements, it is necessary to correlate with metallicity and to extrapolate to zero metallicity in order to infer (Peimbert & Torres-Peimbert 1974). Olive et al. (1997) found for their full data set and an even lower value, , for a subset of H II regions with the lowest metallicity. Izotov et al. (1999) used high-quality spectroscopic observations of the two most metal-deficient blue compact galaxies known, I Zw 18 and SBS 0335-052, to determine . The weighted mean helium mass fraction in the two galaxies, , after correction for the stellar 4He production implies a primordial 4He mass fraction . This value corresponds to , while Olive et al.’s value translates into . This discrepancy could be less severe, if corrections for unseen neutral hydrogen and/or helium apply to Izotov et al.’s estimate of (Gruenwald, Steigman & Viegas 2002). Very recently, Peimbert et al. (2002) have obtained from the helium abundances of five objects including the three low-metallicity objects with the best line determinations and the two objects with the lowest metallicity. They used the temperature derived from the He I lines, which is always smaller than that derived from the [O III] lines, and considered the collisional contribution to the Balmer-line intensities, never taken into account in the other recent determinations in the literature. Indeed, the temperature structure, the collisional excitation of the hydrogen lines, and the ionization structure are problems affecting the determination that need to be further analysed. The determination of by Peimbert et al. favors values in the range .
An alternative approach to derive from Galactic globular clusters was suggested by Iben (1968) and Iben & Faulkner (1968). This method originally provided low values of (Buzzoni et al. 1983), but was affected by significant uncertainties both on the star counts and on the stellar evolution theory. Very recent application of the method to much more complete data sets and with updated stellar models (Cassisi, Salaris & Irwin 2003) indicates instead .
Observations of D in high-redshift QSO absorbers provide an estimate of the primordial deuterium abundance. The controversy on whether the primordial abundance of deuterium was a few times or one order of magnitude higher (e.g., Carswell et al. 1994; Songaila et al. 1994; Tytler et al. 1996; Rugers & Hogan 1996; Songaila et al. 1997; Webb et al. 1997; Burles & Tytler 1998) seems now largely solved: several low D/H values have been reported in the last few years (e.g., Levshakov et al. 1998; O’Meara et al. 2001; Pettini & Bowen 2001; Levshakov et al. 2002 – Table 1) and it has been argued that D/H values higher than a few are likely to be due to contamination by H I interlopers at velocities similar to the isotope shift (e.g., Kirkman et al. 2001).
3He is not a very good baryometer. Rood et al. (1998) suggested (3He/H) as a reasonable estimate for the primordial 3He. A smaller range, (3He/H), has been more recently obtained by Bania et al. (2002) for a Galactic H II region located at kpc, namely, for a region where stellar activity should not have contaminated the pristine 3He abundance significantly. As can be seen in Fig. 1, even this latter, more precise determination of (3He/H)p does not significantly constrain the value of , because of the weak dependence of (3He/H)p on the baryon density. However, it points against the low range () suggested by the high-D, low-4He determinations.
The actual value of the primordial 7Li abundance is still controversial, with some people favoring the hypothesis that the so-called Spite plateau is truly representative of the pristine 7Li content of halo dwarfs, and hence of the primordial 7Li abundance (Spite & Spite 1982; Spite et al. 1984, Spite & Spite 1986; Rebolo et al. 1988; Spite et al. 1996; Bonifacio & Molaro 1997), and other authors suggesting the existence of non-standard depletion processes to reproduce the observed plateau value starting from a higher primordial one (e.g., Thorburn & Beers 1993; Vauclair & Charbonnel 1995, 1998; Théado & Vauclair 2001; Pinsonneault et al. 1999, 2002). On the other hand, the primordial lithium abundance could be even lower than that shared by warm halo dwarfs because of significant early contribution from Galactic chemical evolution ( fusion mechanism and stellar nucleosynthesis; e.g., Ryan, Norris & Beers 1999; Suzuki, Yoshii & Beers 2000). A set of representative primordial abundances of 7Li is shown in Fig. 1. Notice that the most recent estimate of the plateau value from Bonifacio (2002), (7Li)p222(7Li) = (N/NH) + 12, where N and NH are the abundances by number of 7Li and H, respectively. = 2.317 0.0141σ 0.05sys, is not shown, because it refers to a preliminary data analysis published inso far only as conference proceedings. The quoted value results from the analysis of a high-quality sample of 22 stars satisfying the conditions 5700 K, [Fe/H] 1.5, taking into account the effects of standard depletion and non-LTE. This value is higher than previous estimates by Spite & Spite (1982) [(7Li)] and Bonifacio & Molaro (1997) [(7Li)p = 2.238 0.0121σ 0.05sys], but always lower than those suggested if non-standard stellar depletion is acting in low-mass, warm halo stars.
The first release of results from WMAP allows us to independently constrain the range of values of with unprecedented precision. A value of is found (Spergel et al. 2003). The range is shown in Fig. 1 as a vertical band. It is clearly seen that the low-4He and high-D values are completely ruled out. In particular, for D this was already a prediction from Galactic chemical evolution (GCE) models (Steigman & Tosi 1992; Galli et al. 1995; Prantzos 1996; Tosi et al. 1998; Chiappini, Renda & Matteucci 2002). In fact, the level of stellar astration required by chemical evolution models for deuterium to match its present interstellar medium (ISM) abundance starting from a high primordial value is inconsistent with a number of observational constraints for the Milky Way.
In the following, we adopt the primordial abundances resulting from the range derived from WMAP data and study the evolution of the light elements D, 3He, 4He and 7Li in the Galaxy. We discuss the implications of these model results on stellar evolution and nucleosynthesis.
3 Light element evolution in the Milky Way
We adopt two different chemical evolution models for the Milky Way, the one developed by Chiappini et al. (1997, 2001) and that developed by Tosi (1988a, b – model called Tosi 1). Both models satisfy the main observational constraints for the solar neighbourhood as well as the whole Galactic disc. In the following, we underline the major differences and similarities between the models.
In both models, the Galactic disc is divided into concentric rings without radial flows between them and the disc of the Galaxy is built up inside-out (Matteucci & François 1989) from gas infalling from outside (see also Larson 1976; Tinsley & Larson 1978; Tosi 1982). In Chiappini et al.’s model, the infall rate is exponentially decreasing in time, with an -folding time increasing with increasing Galactic radius. In particular, Gyr (Romano et al. 2000). This leads to a faster disc formation in the innermost regions. The infalling gas has a primordial chemical composition. In the model of Tosi, a constant (in time) and uniform (in space) infall density of 0.004 kpc-2 yr-1 is assumed, so that more mass is accreted in the outer disc than in the inner one; the infall law is formally exponential and decreasing in time, but practically constant. The infalling gas is slightly metal-enriched, = 0.2 (see Tosi 1988b). In Chiappini et al.’s model, the star formation rate at a given radius and time is explicitly dependent on , and , i.e., the gas and total mass densities at that radius and time and the present-day total mass density at the solar position. In Tosi’s model the star formation is explicitly dependent on the gas and total mass density currently observed at each Galactocentric distance and exponentially decreasing in time (with -folding time 15 Gyr). In the model of Chiappini et al., a threshold in the star formation process is considered, which makes the star formation in the disc go to zero when the gas density falls below a critical value ( pc-2). This threshold is not considered in Tosi’s model. The two models differ also in the adopted initial mass functions (IMFs): Chiappini et al. adopt Scalo’s (1986) IMF, while Tosi adopts Tinsley’s (1980) IMF. Both models avoid the instantaneous recycling approximation, i.e., they account for the stellar lifetimes. However, they adopt different stellar lifetimes.
For the stellar nucleosynthesis of D, 3He and 4He we assume that D is only destroyed in stellar interiors333A mechanism for post big bang deuterium production (interaction of protons accelerated in flares with the stellar atmosphere creating a flux of free neutrons, which undergo radiative capture on atmospheric protons resulting in D synthesis) has been proposed (Mullan & Linsky 1999), but we do not include it here. Indeed, it has been recently proved that this production channel does not allow for D production at a level which will reverse the monotonic decline of D (Prodanović & Fields 2003)., while 3He and 4He are partly produced and partly burnt to form heavier species (e.g., Dearborn, Steigman & Tosi 1996). The evolution of 3He is assumed to be strongly affected by extra-mixing and subsequent Cool Bottom Processing (CBP) in low-mass stars as prescribed by Sackmann & Boothroyd (1999a, b). These prescriptions are the same as those already adopted by Galli et al. (1997), Palla et al. (2000) and Chiappini et al. (2002) to reproduce the observed abundances of D and 3He. For 7Li, the adopted nucleosynthesis prescriptions are those described by Romano et al. (1999, 2001).
3.1 Evolution of D, 3He and 4He in the Galaxy
Our models assume (D/H), (3He/H) and , consistently with the range of inferred from WMAP data. These adopted values happen to be the same as adopted by Chiappini et al. (2002) for their Model C-II, except for 3He, for which we assume a slightly lower primordial abundance. Model C-II also assumes that 93 per cent of the stars with mass 2 suffer some extra-mixing, resulting in an overall 3He destruction (see Chiappini et al. 2002 for details; see also Galli et al. 1997; Charbonnel & do Nascimento 1998). We assume the same percentage throughout this paper as well, unless otherwise stated.
The adopted theoretical SBBN predictions are from Fiorentini et al. (1998). The assumed (3He/H)p value is the lowest still compatible with WMAP data (at 1 level – see Fig. 1). This choice is motivated by the fact that GCE models always tend to overproduce 3He (especially if extra-mixing and CBP are not included in the computations – see, for instance, figure 4 of Palla et al. 2000). Therefore, it is meaningful to start from the lowest admissible value for (3He/H)p. It is worth noticing that different SBBN computations do not always lead to values of (D/H)p, (3He/H)p, and (7Li/H)p which agree (within the errors) with those adopted here. For instance, by adopting the SBBN predictions by Cyburt, Fields & Olive (2001), in light of the WMAP determination of one gets (D/H), (3He/H), and (7Li/H). Instead, for the OSU code, at , (D/H) and (7Li/H) (G. Steigman, private communication). These results are fairly different from those listed above, but similar to the ones from the Burles et al. (1999) code [(D/H) and (7Li/H)]. However, we have checked that no appreciable changes in the GCE predictions are produced by adopting these values rather than those used here.
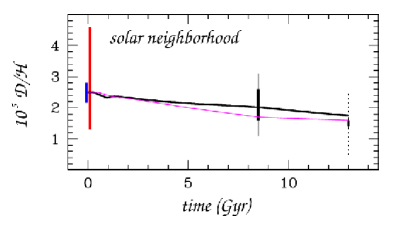
In Fig. 2 we show the temporal behaviour of the deuterium abundance in the solar neighbourhood predicted by Model CRM (the same as Model C-II of Chiappini et al. 2002, but with a lower 3He primordial abundance; thick continuous line) compared to that obtained by Model Tosi 1 (thin continuous line) starting from the same primordial deuterium abundance and considering extra-mixing in 93 per cent of low-mass stars. It can be seen that, notwithstanding the differences between the two models mentioned above, the predicted behaviour is almost the same. In particular, the two models predict nearly the same depletion factor for deuterium, , where and are the primordial and present-day D abundances by mass, respectively. The vertical bars at represent the range allowed for the primordial deuterium abundance from WMAP data (smaller bar) and from high-redshift QSO absorbers (bigger bar – Levshakov et al. 1998; O’Meara et al. 2001; Pettini & Bowen 2001; Levshakov et al. 2002). The vertical solid bars at Gyr are the Geiss & Gloeckler (1998) Protosolar Cloud (PSC) data at 1 and 2 (thick and thin lines, respectively), while the vertical solid bars at Gyr represent the local ISM value by Linsky (1998; at 1 and 2 – thick and thin solid lines, respectively). The dotted line at Gyr shows the most likely range of D/H variation as allowed from measurements with Copernicus, HST-GHRS, IMAPS, STIS and FUSE along several lines of sight (e.g., Vidal-Madjar et al. 1998; Jenkins et al. 1999; Moos et al. 2002; Hoopes et al. 2003). However, notice that values as high as D/H = 4 10-5 have also been reported from IUE observations (see Vidal-Madjar et al. 1998 for references, but see also Vidal-Madjar & Ferlet 2002). Starting from the WMAP primordial D determination, the protosolar and local deuterium abundances are very well reproduced by assuming that D is only destroyed in stars.
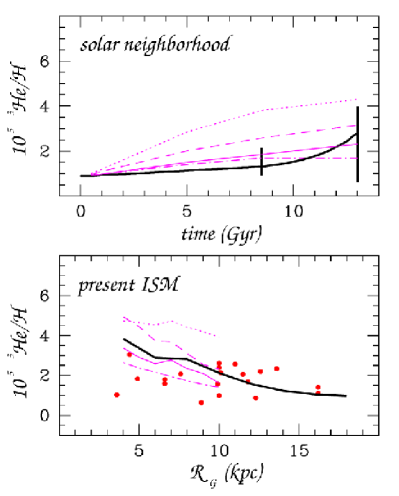
In Fig. 3, upper panel, the evolution of 3He/H in the solar neighbourhood predicted by the same models of Fig. 2 is displayed, together with predictions from other three models, which differ from Model Tosi 1 either in the assumed primordial deuterium abundance or in the percentage of low-mass stars suffering extra-mixing. In particular, the cases (D/H), (D/H) and 100 per cent of low-mass stars destroying 3He through CBP are shown, as a dotted, dashed and dot-dashed thin line, respectively. The protosolar and local 3He abundances are from Geiss & Gloeckler (1998). It is seen that models starting from a high primordial deuterium abundance are not able to reproduce the protosolar and/or local 3He abundance, even allowing for per cent of extra-mixing in low-mass stars. This gives further support to the argument that the primordial D abundance cannot be higher than (D/H) (Chiappini et al. 2002; see also Tosi et al. 1998). A model where 100 per cent of low-mass stars destroy their 3He through CBP results in an almost flat 3He behaviour from the time of the protosolar nebula formation to now. This is clearly an extreme case, since the high 3He abundances derived for a small sample of Galactic planetary nebulae (e.g., Balser et al. 1997; Balser, Rood & Bania 1999; Palla et al. 2000) suggest that at least a minor fraction of the stars of 1 – 2 do indeed produce 3He in significant quantities. In Fig. 3, lower panel, the behaviour of 3He/H across the Galactic disc as predicted by the same models for the present epoch is displayed and compared to H II region observations by Bania et al. (2002). We do not recover the flat behaviour suggested by Bania et al. (2002), but rather predict a negative 3He gradient in the 4 – 18 kpc Galactocentric distance range, unless the case of 100 per cent of low-mass stars suffering extra-mixing is considered.
As far as 4He is concerned, starting from the WMAP value of , a value of (Model CRM) and (Model Tosi 1) is found at the time of Sun formation. The latter nicely compares to the value at birth of the Sun of from Grevesse & Sauval (1998; see also Bahcall, Pinsonneault, & Basu 2001). Notice that by adopting the Tinsley (1980) IMF, i.e. the same IMF assumed by Model Tosi 1, Model CRM predicts . A detailed discussion of the effects of changing the IMF in the chemical evolution code will be presented in a forthcoming paper.
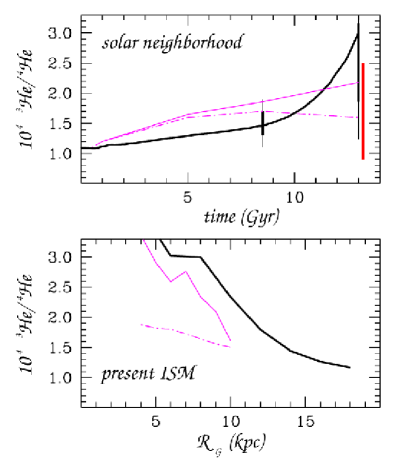
In Fig. 4 we show the temporal (upper panel) and spatial (lower panel) variation of the helium isotopic ratio in the solar neighbourhood and across the Galactic disc at the present time, respectively. Only the predictions from Models CRM and Tosi 1 with 93 per cent and 100 per cent of extra-mixing are shown. The data for the solar nebula and the local ISM (vertical bars in the upper panel) are taken from Geiss & Gloeckler (1998; at 1 and 2 – thick and thin lines, respectively) and Salerno et al. (2003; 1-bar on the right at Gyr). The measurement of 3He/4He in the local ISM from the COLLISA experiment on board of MIR [3He/4He = (1.7 0.8) 10-4; Salerno et al. 2003] involves neutral gas reaching Earth’s orbit before interacting with the solar EUV photons, which thus keeps the original isotopic abundance ratios. If heavier weight is given to this more recent measurement, a case where nearly all low-mass stars suffer extra-mixing should be preferred. A reliable estimate of the 3He/4He gradient across the Galactic disc is hence highly desirable in order to establish which is the actual fraction of low-mass stars destroying their pristine 3He. In fact, different models, assuming different degrees of extra-mixing, predict large differences in the 3He/4He ratio across the Galactic disc, especially at inner radii (Fig. 4, lower panel). Assessing this point could have important consequences on our knowledge of the mechanisms of 3He production/destruction inside stars. Unfortunately, the value of the 3He/4He ratio at different positions along the Galactic disc determined by observations is very uncertain, owing to the uncertain, model-dependent ionization corrections which apply to the raw data.
The temporal variation of D/H and 3He/H in the solar neighbourhood predicted by the two different chemical evolution models (Model CRM and Model Tosi 1), when starting from the same primordial abundances and adopting the same nucleosynthesis prescriptions, is fairly similar (see Figs. 2 and 3). However, Model Tosi 1 predicts a slightly lower deuterium abundance and a slightly higher 3He abundance from Gyr to now, except for the last 1 Gyr of evolution, when a higher 3He mass fraction in the ISM is expected according to Model CRM than according to Model Tosi 1. The same behaviour is recovered also in the 3He/4He versus time plot (Fig. 4). The differences in the abundance trends can be explained as due to the different stellar lifetimes, IMF slopes, infall and star formation laws adopted by the two models. In particular, in Model Tosi 1 stars in the mass range 0.5 – 0.9 never die, while they do in Model CRM, and these low-mass stars contribute an important fraction of 3He at late times. The different choice of the IMF produces a smaller – although still non-negligible – effect on the predicted 3He evolution.
3.2 Evolution of 7Li in the solar neighbourhood
Once the SBBN model predictions from Fiorentini et al. (1998) are adopted, the WMAP value of 6.1 results in a primordial lithium abundance of (7Li/H) (see Fig. 1). In the usual (7Li) notation, this translates to (7Li), higher than any previous estimate of the primordial 7Li abundance from observations of warm, metal-poor halo dwarfs under the hypothesis that they have preserved all their pristine lithium and have not been significantly polluted by early Galactic lithium production. In the following, we analyse the effect of adopting such a high value for the primordial 7Li abundance in the chemical evolution code.
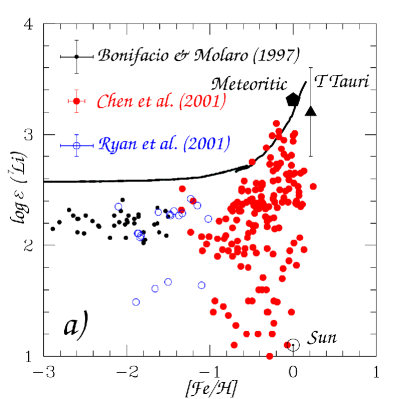
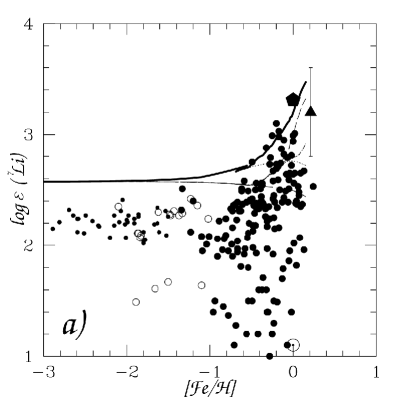
In Figs. 5a and 6a, we show the (7Li) versus [Fe/H] diagram for field dwarfs in the solar neighbourhood hotter than 5700 K (data are from Bonifacio & Molaro 1997; Ryan et al. 2001; Chen et al. 2001). The solar (Grevesse & Sauval 1998), meteoritic (Nichiporuk & Moore 1974) and T Tauri (Stout-Batalha, Batalha & Basri 2000) values are shown as well. In the context of standard stellar evolution, warm halo stars ([Fe/H] 1.5 dex) should not display lithium abundances significantly lower than that in the gas out of which they formed (Deliyannis, Demarque & Kawaler 1990). In fact, in standard stellar evolution models lithium is destroyed mainly during the pre-main sequence phase (during the main sequence lifetime, the convective regions are too shallow to allow Li depletion) and pre-main sequence Li depletion is not expected at low metallicities (D’Antona & Mazzitelli 1984). However, the halo stars could destroy a significant fraction of their initial lithium content, if they were suffering for non-standard destruction mechanisms (e.g., Vauclair & Charbonnel 1995, 1998; Théado & Vauclair 2001; Pinsonneault et al. 1999, 2002). Since these non-standard depletion mechanisms are responsible for a broad spread in the Li abundances, as actually seen in the data at [Fe/H] 1.0 dex, the remarkable flatness and thinness of the Spite plateau represent a major challenge to stellar evolution models taking non-standard 7Li depletion into account. Recent models considering gravitational waves as the major depletion cause (Talon & Charbonnel 2003) seem indeed capable of reproducing both the observed 7Li spread at high metallicities and the tightness of the Spite plateau at low ones. These models predict that the observed Spite plateau is actually 4 – 5 times lower than the primordial value (Charbonnel 2003, private communication).
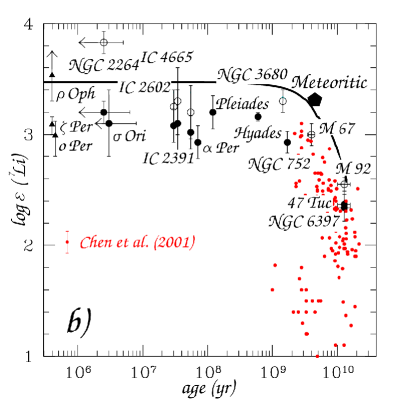
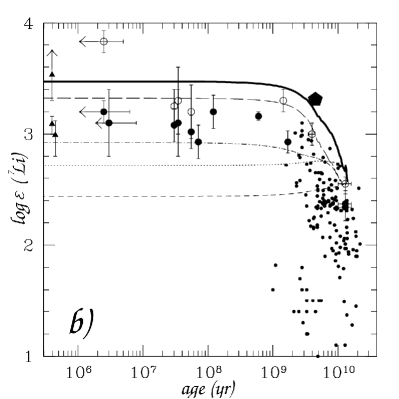
In Figs. 5b and 6b, we show the (7Li) versus age diagram, which allows for a better appreciation of the lithium variations in the last 1 Gyr. Data for Galactic open clusters as well as old globular clusters are shown. The big filled circles represent mean lithium values, while the big open circles represent the highest lithium abundance observed in the cluster. Different measurements of the ISM value are also shown. For NGC 6397, the mean value for 12 turnoff stars corrected for non-LTE and standard depletion is that by Bonifacio et al. (2002). For 47 Tuc, the 7Li abundance is the mean value for 2 turnoff stars determined by Pasquini & Molaro (1997). For M 92, the highest non-LTE Li abundance measured by Boesgaard et al. (1998) is shown. The age of all these clusters is taken from Carretta et al. (2000). For M 67, data are from Pasquini, Randich & Pallavicini (1997); for NGC 752, from Balachandran (1995 – average of the three stars with the largest Li abundances on the hot side of the Li dip). For NGC 3680, we assume the highest lithium abundance from Pasquini, Randich & Pallavicini (2001); for the Hyades, the mean value is taken from Balachandran (1995 – average of the three stars with the largest Li abundances on the cool side of the Li dip). The values for the Pleiades and Per are from Soderblom et al. (1993) and Randich et al. (1998), respectively, while those for IC 2391 and IC 2602 are non-LTE values from Randich et al. (2001). For IC 4665 and NGC 2264, non-LTE values from Martín & Montes (1997) and Soderblom et al. (1999), respectively, are displayed. The value for Ori is the mean value from Zapatero Osorio et al. (2002). The ISM values are from Lemoine et al. (1993; line of sight towards Oph) and Knauth et al. (2000; lines of sight towards Per and Per). Data for field dwarfs (Chen et al. 2001) are also shown for comparison.
The thick continuous lines in Figs. 5 and 6 represent the predictions of a model where Galactic cosmic ray (GCR) and stellar lithium production are taken into account in order to rise the 7Li content in the ISM from its primordial value of (7Li) to the meteoritic [(7Li) = 3.3] and local [(7Li) 3.2] ones. In particular, lithium is mostly produced by low-mass, long-lived stellar sources (low-mass stars on the red giant branch and novae). Only a minor contribution comes from stars on the asymptotic giant branch and from Type II supernovae (see Romano et al. 1999, 2001 and Fig. 6) contrary to what has been suggested by Travaglio et al. (2001), who invoke a large contribution from AGB stars (see, however, Ventura, D’Antona & Mazzitelli 2002 for a critical analysis of their results). It is found that the amount of stellar production required in order to match the meteoritic data does not change with changing the assumed primordial 7Li abundance from (7Li) to (7Li), owing to the fact that the evolution of 7Li during almost the whole Galaxy evolution is practically determined solely by the amount of lithium produced through stellar and GCR processes (cf. figure 6 of Romano et al. 2001). The different lines in Fig. 6 represent the predictions of models where lithium is contributed by only a single stellar Li factory: asymptotic giant branch (AGB) stars (short-dashed line); Type II supernovae (SNeII; dotted line); low-mass red giants (long-dashed line); novae (dot-dashed line).
We conclude that, even in the case in which the primordial abundance of lithium is as high as (7Li) (as suggested from recent WMAP data), our previous conclusions on the 7Li evolution in the solar neighbourhood are left unchanged; in particular, the rise off the primordial plateau value is still explained as due to the same important, late 7Li contribution from long-lived stellar sources (low-mass red giants and novae; Romano et al. 1999, 2001). However, if the (7Li)p value is as high as , we strongly need some non-standard depletion mechanism able to explain the absence of scatter and the high level of flatness observed in halo stars over a quite large range of metallicity.
4 Final remarks and conclusions
The recent results from WMAP and their direct consequences on the primordial abundances of the light elements have finally allowed us to check that GCE models able to reproduce all the major observed properties of the Milky Way are consistent also with SBBN predictions. It has been shown several times in the last decade (e.g., Steigman & Tosi 1992; Galli et al. 1995; Prantzos 1996; Tosi 1996; Tosi et al. 1998; Chiappini et al. 2002) that only a very moderate D depletion from its primordial abundance to the present one is allowed to let the models reproduce the observed radial distributions of chemical abundances, star and gas densities and star formation rates, as well as the age-metallicity relation and the G-dwarf metallicity distribution. However, until now there was no definitive observational evidence on the primordial values, since one cannot completely exclude that even high-redshift, low-metallicity QSO absorbers might be already polluted by stellar nucleosynthesis. Now we have seen that the D, 3He and 4He produced during the big bang are in excellent agreement with Galactic evolution requirements. For 7Li, some problems do arise, but they mainly concern our understanding of the mechanisms of lithium dilution/destruction in stars rather than chemical evolution. Indeed, by assuming the WMAP primordial abundance of (7Li), we still need the same important, late contribution of 7Li from long-lived stellar sources (low-mass red giants and novae) required in order to explain the observations in meteorites when starting from the lower value of (7Li) suggested from observations of halo stars under the hypothesis that they neither destroyed their pristine lithium nor suffered any pollution by early GCE (see also Romano et al. 2001). In fact, the amount of lithium production from stars and GCRs required by our model in order to explain the observations is such that it largely overwelms the lithium primordial abundance. However, if the adopted primordial value of (7Li) is confirmed, a mechanism able to deplete Li in halo stars while preserving the flatness of the Spite plateau and producing almost no scatter in the star to star abundance at low metallicities is strongly needed. Gravitational waves seem interesting in this respect (see Talon & Charbonnel 2003), but we still wait for full metallicity dependent computations.
We should recall at this point that our standard chemical evolution models refer to large-scale, long-term phenomena and cannot account for small-scale, short-term variations. If we want to reproduce also the observed spread in the abundances of the light elements, as observed, for instance, by FUSE in the local ISM (e.g., Moos et al. 2002), or for 3He/H across the Galactic disc (Bania et al. 2002), we should also take into account the possible inhomogeneities in the chemical enrichment of each region and the effects of possible orbital diffusion of the stars.
Acknowledgments
M.T. is particularly grateful to Corinne Charbonnel, Johannes Geiss, and George Gloeckler of the LOLA-GE team for the enlightening discussions at the International Space Science Institute in Berne (CH). Dana Balser, Tom Bania, and Bob Rood are warmly thanked for always being ready to share updated values of the 3He abundances. We also thank Daniele Galli and Gary Steigman for their useful comments. Ed Jenkins, Warren Moos and Alfred Vidal-Madjar are gratefully acknowledged for clarifying what is the range of LISM D/H values which should be quoted according to the most reliable data. This work has been partially supported by the Italian ASI through grant IR 11301ZAM.
References
- [1] Bahcall J. N., Pinsonneault M. H., Basu S., 2001, ApJ, 555, 990
- [2] Balachandran S., 1995, ApJ, 446, 203
- [3] Balser D. S., Bania T. M., Rood R. T., Wilson T. L., 1997, ApJ, 483, 320
- [4] Balser D. S., Rood R. T., Bania T. M., 1999, ApJ, 522, L73
- [5] Bania T. M., Rood R. T., Balser D. S., 2002, Nature, 415, 54
- [6] Bennett C. L., et al., 2003, ApJ, in press (astro-ph/0302207)
- [7] Boesgaard A. M., Deliyannis C. P., Stephens A., King J. R., 1998, ApJ, 493, 206
- [8] Boesgaard A. M., Steigman G., 1985, ARA&A, 23, 319
- [9] Bonifacio P., 2002, , in New Quests in Stellar Astrophysics: The Link Between Stars and Cosmology, ed. M. Chávez, A. Bressan, A. Buzzoni, D. Mayya (Dordrecht: Kluwer), in press
- [10] Bonifacio P., et al., 2002, A&A, 390, 91
- [11] Bonifacio P., Molaro P., 1997, MNRAS, 285, 847
- [12] Burles S., Nollett K. M., Truran J. W., Turner M. S., 1999, Phys. Rev. Lett., 82, 4176
- [13] Burles S., Tytler D., 1998, ApJ, 507, 732
- [14] Buzzoni A., Fusi Pecci F., Buonanno R., Corsi C. E., 1983, A&A, 128, 94
- [15] Carretta E., Gratton R. G., Clementini G., Fusi Pecci F., 2000, ApJ, 533, 215
- [16] Carswell R. F., Rauch M., Weymann R. J., Cooke A. J., Webb J. K., 1994, MNRAS, 268, L1
- [17] Cassisi S., Salaris M., Irwin A. W., 2003, ApJ, 588, 862
- [18] Charbonnel C., do Nascimento J. D. Jr., 1998, A&A, 336, 915
- [19] Chen Y. Q., Nissen P. E., Benoni T., Zhao G., 2001, A&A, 371, 943
- [20] Chiappini C., Matteucci F., Gratton R., 1997, ApJ, 477, 765
- [21] Chiappini C., Matteucci F., Romano D., 2001, ApJ, 554, 1044
- [22] Chiappini C., Renda A., Matteucci F., 2002, A&A, 395, 789
- [23] Croft R. A. C., Weinberg D. H., Bolte M., Burles S., Hernquist L., Katz N., Kirkman D., Tytler D., 2002, ApJ, 581, 20
- [24] Cyburt R. H., Fields B. D., Olive K. A., 2001, New Astr., 6, 215
- [25] D’Antona F., Mazzitelli I., 1984, A&A, 138, 431
- [26] Dearborn D. S. P., Steigman G., Tosi M., 1996, ApJ, 465, 887 (erratum: ApJ, 473, 570)
- [27] Deliyannis C. P., Demarque P., Kawaler S. D., 1990, ApJS, 73, 21
- [28] Fiorentini G., Lisi E., Sarkar S., Villante F. L., 1998, Phys. Rev. D, 58, 063506
- [29] Galli D., Palla F., Ferrini F., Penco U., 1995, ApJ, 443, 536
- [30] Galli D., Stanghellini L., Tosi M., Palla F., 1997, ApJ, 477, 218
- [31] Geiss J., Gloeckler G., 1998, Space Sci. Rev., 84, 239
- [32] Gnedin N. Y., Hamilton A. J. S., 2002, MNRAS, 334, 107
- [33] Grevesse N., Sauval A. J., 1998, Space Sci. Rev., 85, 161
- [34] Gruenwald R., Steigman G., Viegas S. M., 2002, ApJ, 567, 931
- [35] Hoopes C. G., Sembach K. R., Hébrard G., Moos H. W., Knauth D. C., 2003, ApJ, 586, 1094
- [36] Iben I. Jr., 1968, Nature, 220, 143
- [37] Iben I. Jr., Faulkner J., 1968, ApJ, 153, 101
- [38] Izotov Y. I., Chaffee F. H., Foltz C. B., Green R. F., Guseva N. G., Thuan T. X., 1999, ApJ, 527, 757
- [39] Jenkins E. B., Tripp T. M., Woźniak P. R., Sofia U. J., Sonneborn G., 1999, ApJ, 520, 182
- [40] Kirkman D., et al., 2001, ApJ, 559, 23
- [41] Knauth D. C., Federman S. R., Lambert D. L., Crane P., 2000, Nature, 405, 656
- [42] Kuo C. L., et al., 2002, ApJ, submitted (astro-ph/0212289)
- [43] Larson R. B., 1976,MNRAS, 176, 31
- [44] Lemoine M., Ferlet R., Vidal-Madjar A., Emerich C., Bertin P., 1993, A&A, 269, 469
- [45] Levshakov S. A., Dessauges-Zavadsky M., D’Odorico S., Molaro P., 2002, ApJ, 565, 696
- [46] Levshakov S. A., Kegel W. H., Takahara F., 1998, ApJ, 499, L1
- [47] Linsky J. L., 1998, Space Sci. Rev., 84, 285
- [48] Martín E. L., Montes D., 1997, A&A, 318, 805
- [49] Matteucci F., François P., 1989, MNRAS, 239, 885
- [50] Moos H. W., et al., 2002, ApJS, 140, 3
- [51] Mullan D. J., Linsky J. L., 1999, ApJ, 511, 502
- [52] Nichiporuk W., Moore C. B., 1974, Geochim. Cosmochim. Acta, 38, 1691
- [53] Olive K. A., Skillman E. D., Steigman G., 1997, ApJ, 483, 788
- [54] O’Meara J. M., Tytler D., Kirkman D., Suzuki N., Prochaska J. X., Lubin D., Wolfe A. M., 2001, ApJ, 552, 718
- [55] Pagel B. E. J., 2000, Phys. Rep., 333, 433
- [56] Palla F., Bachiller R., Stanghellini L., Tosi M., Galli D., 2000, A&A, 355, 69
- [57] Pasquini L., Molaro P., 1997, A&A, 322, 109
- [58] Pasquini L., Randich S., Pallavicini R., 1997, A&A, 325, 535
- [59] Pasquini L., Randich S., Pallavicini R., 2001, A&A, 374, 1017
- [60] Pearson T. J., et al., 2002, ApJ, submitted (astro-ph/0205388)
- [61] Peimbert A., Peimbert M., Luridiana V., 2002, ApJ, 565, 668
- [62] Peimbert M., Torres-Peimbert S., 1974, ApJ, 191, 401
- [63] Percival W. J., et al., 2001, MNRAS, 327, 1297
- [64] Pettini M., Bowen D. V., 2001, ApJ, 560, 41
- [65] Pinsonneault M. H., Steigman G., Walker T. P., Naranyanan V. K., 2002, ApJ, 574, 398
- [66] Pinsonneault M. H., Walker T. P., Steigman G., Naranyanan V. K., 1999, ApJ, 527, 180
- [67] Prantzos N., 1996, A&A, 310, 106
- [68] Prodanović T., Fields B. D., 2003, ApJ, in press (astro-ph/0307183)
- [69] Randich S., Martín E. L., García López R. J., Pallavicini R., 1998, A&A, 333, 591
- [70] Randich S., Pallavicini R., Meola G., Stauffer J. R., Balachandran S. C., 2001, A&A, 372, 862
- [71] Rebolo R., Molaro P., Beckman J. E., 1988, A&A, 192, 192
- [72] Romano D., Matteucci F., Molaro P., Bonifacio P., 1999, A&A, 352, 117
- [73] Romano D., Matteucci F., Salucci P., Chiappini C., 2000, ApJ, 539, 235
- [74] Romano D., Matteucci F., Ventura P., D’Antona F., 2001, A&A, 374, 646
- [75] Rood R. T., Bania T. M., Balser D. S., Wilson T. L., 1998, Space Sci. Rev., 84, 185
- [76] Rugers M., Hogan C. J., 1996, ApJ, 459, L1
- [77] Ryan S. G., Beers T. C., Kajino T., Rosolankova K., 2001, ApJ, 547, 231
- [78] Ryan S. G., Norris J. E., Beers T. C., 1999, ApJ, 523, 654
- [79] Sackmann I.-J., Boothroyd A. I., 1999a, ApJ, 510, 217
- [80] Sackmann I.-J., Boothroyd A. I., 1999b, ApJ, 510, 232
- [81] Salerno E., Bühler F., Bochsler P., Busemann H., Bassi M. L., Zastenker G. N., Agafonov Yu. N., Eismont N. A., 2003, ApJ, 585, 840
- [82] Scalo J. M., 1986, Fundam. Cosmic Phys., 11, 1
- [83] Soderblom D. R., Jones B. F., Balachandran S., Stauffer J. R., Duncan D. K., Fedele S. B., Hudon J. D., 1993, AJ, 106, 1059
- [84] Soderblom D. R., King J. R., Siess L., Jones B. F., Fischer D., 1999, AJ, 118, 1301
- [85] Songaila A., Cowie L. L., Hogan C. J., Rugers M., 1994, Nature, 368, 599
- [86] Songaila A., Wampler E. J., Cowie L. L., 1997, Nature, 385, 137
- [87] Spergel D. N., et al., 2003, ApJ, submitted (astro-ph/0302209)
- [88] Spite M., François P., Nissen P. E., Spite F., 1996, A&A, 307, 172
- [89] Spite M., Maillard J. P., Spite F., 1984, A&A, 141, 56
- [90] Spite F., Spite M., 1982, A&A, 115, 357
- [91] Spite F., Spite M., 1986, A&A, 163, 140
- [92] Steigman G., 1989, in Cosmic abundances of matter, AIP Conf. Proc. (New York: American Institute of Physics), Vol. 183, 310
- [93] Steigman G., Tosi M., 1992, ApJ, 401, 150
- [94] Stout-Batalha N. M., Batalha C. C., Basri G. S., 2000, ApJ, 532, 474
- [95] Suzuki T. K., Yoshii Y., Beers T. C., 2000, ApJ, 540, 99
- [96] Talon S., Charbonnel C., 2003, A&A, in press (astro-ph/0305151)
- [97] Théado S., Vauclair S., 2001, A&A, 375, 70
- [98] Thorburn J. A., 1992, ApJ, 399, L83
- [99] Thorburn J. A., 1994, ApJ, 421, 318
- [100] Thorburn J. A., Beers T. C., 1993, ApJ, 404, L13
- [101] Tinsley B. M., 1980, Fundam. Cosmic Phys., 5, 287
- [102] Tinsley B. M., Larson R. B., 1978, ApJ, 221, 554
- [103] Tosi M., 1982, ApJ, 254, 699
- [104] Tosi M., 1988a, A&A, 197, 33
- [105] Tosi M., 1988b, A&A, 197, 47
- [106] Tosi M., 1996, in From Stars to Galaxies: The Impact of Stellar Physics on Galaxy Evolution, ed. C. Leitherer, U. Fritze-von-Alvensleben, J. Huchra, ASP Conf. Ser. (San Francisco: ASP), Vol. 98, 299
- [107] Tosi, M., Steigman, G., Matteucci, F., & Chiappini, C. 1998, ApJ, 498, 226
- [108] Travaglio C., Randich S., Galli D., Lattanzio J., Elliott L. M., Forestini M., Ferrini F., 2001, ApJ, 559, 909
- [109] Tytler D., Fan X.-M., Burles S., 1996, Nature, 381, 207
- [110] Vauclair S., Charbonnel C., 1995, A&A, 295, 715
- [111] Vauclair S., Charbonnel C., 1998, ApJ, 502, 372
- [112] Ventura P., D’Antona F., Mazzitelli I., 2002, A&A, 393, 215
- [113] Vidal-Madjar A., et al., 1998, Space Sci. Rev., 84, 297
- [114] Vidal-Madjar A., Ferlet R., 2002, ApJ, 571, L169
- [115] Walker T. P., Steigman G., Kang H.-S., Schramm D. M., Olive K. A., 1991, ApJ, 376, 51
- [116] Webb J. K., Carswell R. F., Lanzetta K. M., Ferlet R., Lemoine M., Vidal-Madjar A., Bowen D. V., 1997, Nature, 388, 250
- [117] Zapatero Osorio M. R., Béjar V. J. S., Pavlenko Ya., Rebolo R., Allende Prieto C., Martín E. L., García López R. J., 2002, A&A, 384, 937