Gemini Mid-Infrared Imaging of Massive Young Stellar Objects in NGC 3576111Based on observations obtained at the Gemini Observatory, which is operated by the Association of Universities for Research in Astronomy, Inc., under a cooperative agreement with the NSF on behalf of the Gemini partnership: the National Science Foundation (United States), the Particle Physics and Astronomy Research Council (United Kingdom), the National Research Council (Canada), CONICYT (Chile), the Australian Research Council (Australia), CNPq (Brazil) and CONICET (Argentina)
Abstract
We present a mid-infrared study of NGC 3576. The high-resolution images were taken at the Gemini South Observatory through narrow and broad band filters centered between 7.9 and 18 . The nearly diffraction limited images show IRS 1 resolved into 4 sources for the first time in the 10 band. The positions of the sources are coincident with massive young stellar objects detected previously in the near infrared. The properties of each object, such as spectral energy distribution, silicate absorption feature, color temperature and luminosities were obtained and are discussed. We also report observations of two other YSO candidates and the detection of a new diffuse MIR source without a NIR counterpart. We conclude that none of these sources contributes significantly to the ionization of the H II region. A possible location for the ionization source of NGC 3576 is suggested based on both radio and infrared data.
1 Introduction
Massive stars are responsible for many important phenomena in galaxies. They alter their environment through the emission of high energy radiation and the deposition of momentum and mechanical energy into the interstellar medium through powerful winds. At the end of their lives, massive stars explode as supernova enriching the interstellar medium and causing shocks that may trigger the formation of new stars. The life and death of massive stars have a profound impact on both local and galactic scales.
Massive stars are believed to form in warm dense cores of molecular clouds. The earliest stage of a star in the process of forming is known as ‘Prestellar Core’ (PSC) (Churchwell, 2002). PSCs have not yet formed a central protostar and will not be detected in the near infrared (NIR) or at radio wavelengths. Moreover PSCs have temperatures of only 20 K and their spectral energy distributions (SEDs) peak in the far infrared (FIR) at 200 (Garay & Lizano, 1999). The next phase of evolution toward the main sequence is known as the Hot Core (HC) phase. In this stage, a compact, dense and warm molecular cloud core is believed to harbor a massive protostar in a process of rapid accretion, probably surrounded by an equatorial accretion disk (Kurtz et al., 2000). HCs are not detected at wavelengths shorter than 10 , their SEDs are broader than a single temperature black body distribution, but they have a pronounced peak at 100 . Since the protostar experiences a process of rapid massive accretion it cannot produce a detectable H II region (Osorio, Lizano & D’Alessio, 1999). After the accretion is over or greatly diminished, the Lyman Continuum photons emitted by the massive star ionize the surrounding gas and a ultra-compact H II (UCH II) region is formed. UCH II regions have SEDs also peaking at 100 , but they now can be detected at shorter wavelengths, such as 1-2 (Wood & Churchwell, 1989b; Hanson, Luhman & Rieke, 2002). The ionized gas is surrounded by a warm dust cocoon which makes UCH II regions bright sources in the mid infrared (MIR), as well. As the star evolves, the UCH II region expands, the natal gas and dust are swept away by intense stellar winds. Eventually, the ionizing star becomes visible, but it may have moved 10-15% along its evolutionary track (i.e after the zero age main sequence) at this stage (Garmany, 1994), and important questions regarding the formation of massive stars and their environment cannot be directly addressed anymore.
NGC 3576 harbors at least a dozen intriguing objects with color indexes 2, identified by Figuerêdo et al. (2002, hereafter FBDC). The -band spectra of some of the brighter sources do not show any photospheric features. Moreover, the CO 2.3 bandhead is seen in emission or absorption in the spectra of 4 of these objects. Although the presence of this feature in emission or absorption has been explained by a variety of mechanisms, such as circumstellar disks, stellar or disk winds, magnetic accretion, instabilities in the inner regions of accretion disks of low mass stars or free-falling gas along field lines (see the references in FBDC), disk emission is the most preferred model, at least for low mass stars. The case is not yet clear for massive stars. The CO bandhead was also found in emission in massive stars in M17 by Hanson, Howarth & Conti (1997) in low resolution spectra. Optical spectra of some of these same stars suggest they do have circumstellar disks.
The “ excess” objects in NGC 3576 may be even younger than the M17 objects, which are visible in the band (Hanson, Howarth & Conti, 1997) and are believed to be massive young stellar objects (YSOs) perhaps surrounded by a thick accretion disk. There are analogous massive objects with strong NIR excess in W31 (Blum, Damineli & Conti, 2001), W42 (Blum, Conti & Damineli, 2000), and W49 (Conti & Blum, 2002).
Four sources - #48, #50, #60 and #60b (all sources with “#” in the present paper follow the FBDC nomenclature) - were found at the position of the MIR source IRS 1, identified by Frogel & Persson (1974). The -band spectrum of #48 does not show any photospheric lines and moreover, source #50 was not detected at and bands. For this reason no further information, such as spectral type could be derived from NIR data. However, at this evolutionary stage, crucial stellar parameters, like luminosity and hence the stellar mass, can be inferred by measuring their fluxes in the MIR. This spectral regime is also suitable to study the environment where the YSOs are forming. The spatial distribution of dust can put constraints on the geometry of accretion since accretion via a disk needs large amounts of gas (which is mixed to the dust) concentrated in a small region.
NGC 3576 (also known as G291.3-0.71 or RCW57) is a giant H II region located in the Galactic plane at a kinematic distance 2.8 () kpc (FBDC). It was observed at radio wavelengths by McGee & Gardner (1968), Goss & Shaver (1970), Wilson, et al. (1970), McGee & Newton (1981) and De Pree, Nysewander & Goss (1999). Methanol and water masers were detected by Caswell et al. (1995) and Caswell et al. (1989), respectively. NIR photometry was performed by Moorwood & Salinari (1981), Moneti (1992), Persi et al. (1994) and FBDC who presented a deep NIR study of NGC 3576. Frogel & Persson (1974) originally observed the region in the MIR. Five sources were identified and the brightest, IRS 1, was unresolved with a 7 diaphragm. Later MIR observations of NGC 3576, from Moorwood & Salinari (1981), Lacy, Beck & Geballe (1982), Persi, Ferrari-Toniolo & Spinoglio (1987) and more recently, Walsh et al. (2001), were also unable to resolve the source IRS 1.
In this paper, we present high-resolution MIR observations of 3 selected fields in NGC 3576, taken through the atmospheric windows near 10 and 18 , in 2. The data and the discussion of the results are presented in the 3. The conclusions are summarized in 4.
2 Observations and Data Reduction
The data were obtained at the Gemini South Observatory 8-m telescope on 2001 November 30th and December 4th and 6th in service mode with the University of Florida OSCIR222This paper is based on observations obtained with the mid-infrared camera OSCIR, developed by the University of Florida with support from the National Aeronautics and Space Administration, and operated jointly by Gemini and the University of Florida Infrared Astrophysics Group. MIR camera. The camera employs a Rockwell 128128 pixel SI:As BIB detector, the plate scale at Gemini was 0.0859″/pixel; the total field of view (FOV) of the array was 11″11″.
Flux calibration was performed using the MIR standard star CMa observed during the night as part of the baseline calibration program. Air mass differences between the standard star observations and the target observations were 0.3 resulting in an uncertainty of approximately 10%. Table 1 presents a summary of the observations, as well as the filter parameters. Sky and background subtraction were achieved by the standard chop-and-nod technique. Sky images were taken to the north of the selected fields. Images were processed using the OSCIR reduction package running under IRAF333IRAF is distributed by the National Optical Astronomy Observatories. environment, including the flat field correction. The processed images were also corrected for bad pixels and finally were flux calibrated. The photometry was performed assuming a Gaussian PSF model fitted to the objects.
Images were obtained through the -broad band at 10.5 and the narrow-band filters at 7.9, 9.8, 12.5 and 18.2 . The 40 seconds exposure time was the minimum value to allow a complete chop-nod cycle. Based on pre-commissioning sensitivity, this value would result in a narrow-band S/N of 3 for a 100 mJy point source.
The detection limit (S/N1) is 100 mJy in all bands, except at 18.2 , which is 900 mJy. Three fields were observed: the region associated with IRS 1 (in all bands), the region centered on source #95 (at 7.9, 9.8, 12.5 and 18.2 bands) and field where sources #52 and #54 are located (only at the 12.5 band).
3 Results and Discussion
The first field observed was centered at the position of IRS 1, where 3 NIR sources were found by Persi et al. (1994) and FBDC: #48, #50 and #60. The second field observed is located east of IRS 1. This field hosts 2 YSO candidates (#95 and #83) and a late-O/early-B star (#85) identified in the color-magnitude diagram presented by FBDC (their Figure 3). This second set of images, however, has lower S/N ratio and for this reason we could measure the flux only for source #95 in the 7.9, 9.8 and 12.5 bands. The third field was imaged only in the 12.5 band and for this reason will not be presented. It is located southern of IRS 1 and hosts one YSO candidate (#52) and an object detected by FBDC only in the -band (#54). A third object was detected in this field as a negative pattern, its position relative to the extend emission seen at the top of image, led us identify this object as source #73 caught in the sky beam of chopping procedure, 15 north.
3.1 The Images
3.1.1 Sources #48, #50 and #60
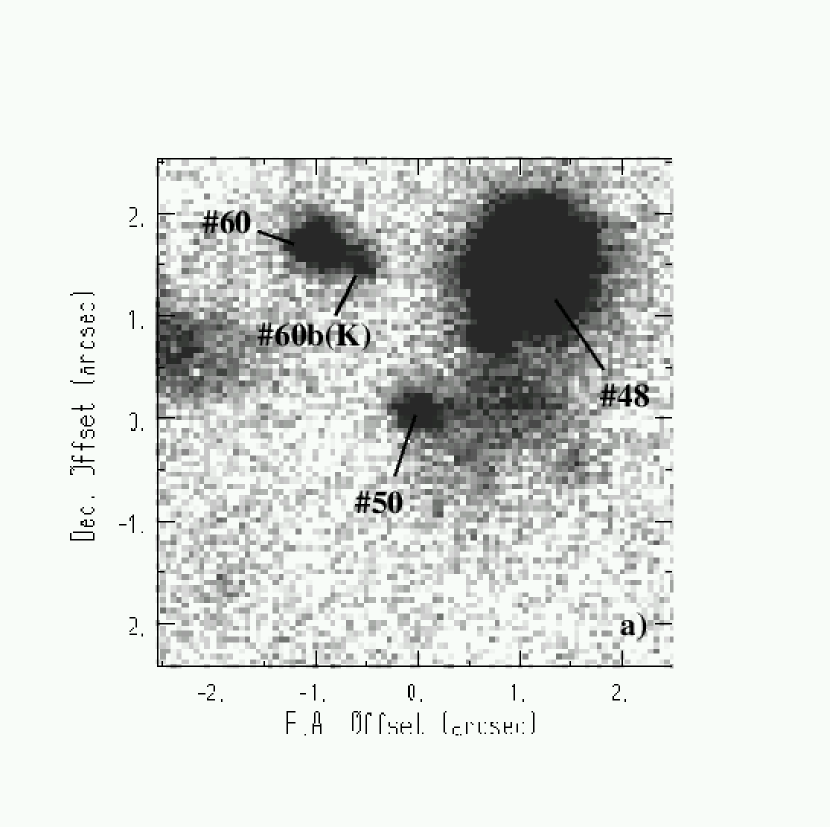
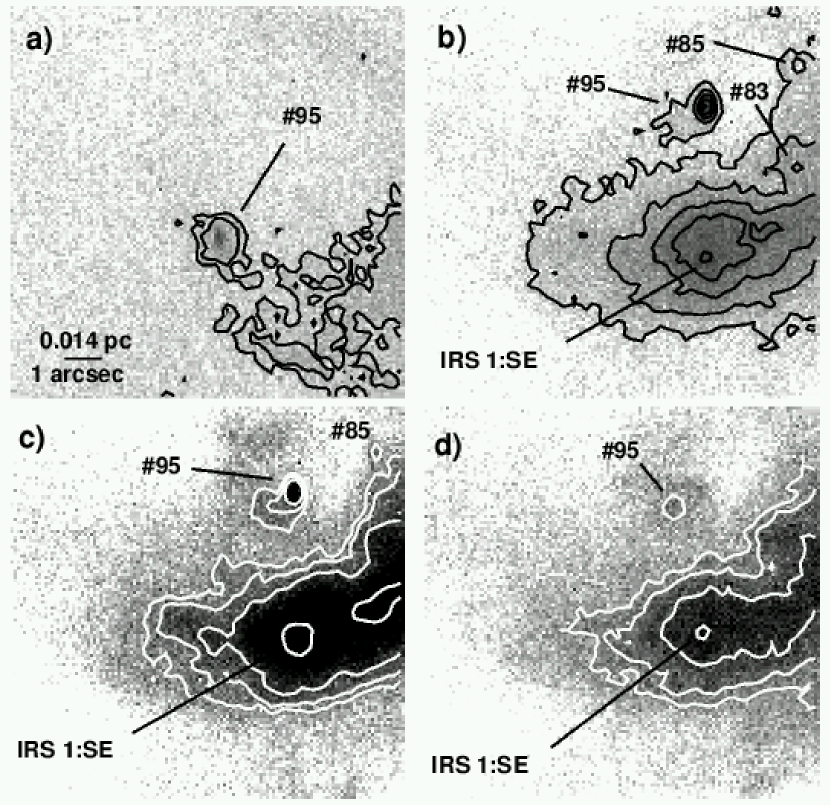
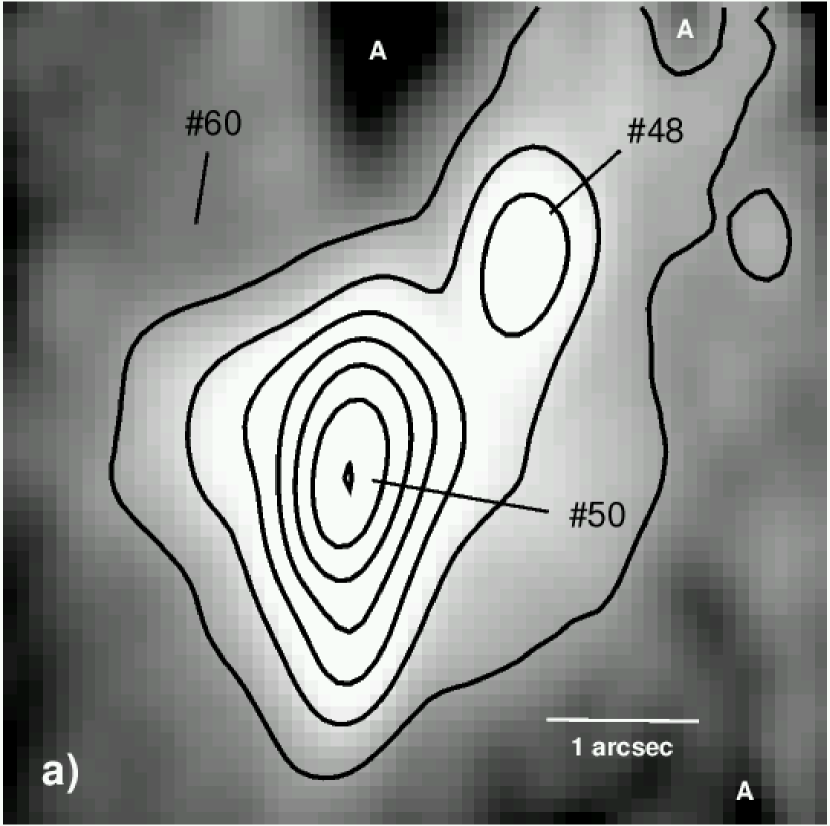
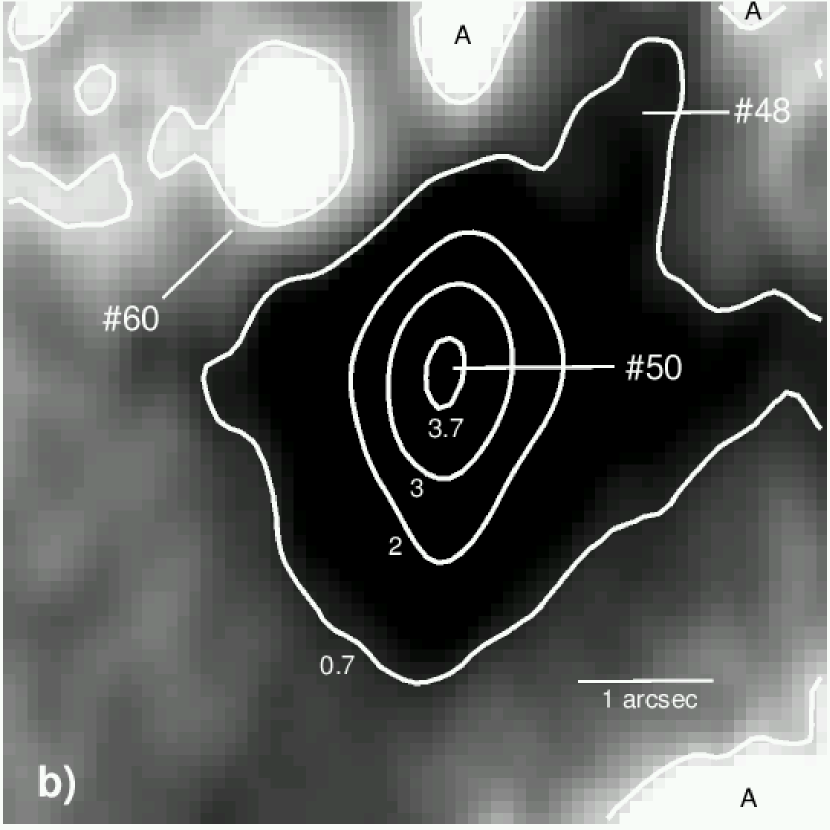
Sources in IRS 1 are presented in Figure 1. Panel (a) shows the -band image of sources #48, #50 and #60 taken with the PHOENIX acquisition camera under good seeing (0.3″), the average PSF is and the camera plate scale is 0.055/pixel.444www.gemini.edu/sciops/instruments/phoenix/phoenixindex.html The sources are labeled according to FBDC. Figure 1 (b) displays the -band image of the same region showing the sources in IRS 1 resolved for the first time at 10 and identified with the NIR counterparts (again, adopting the source numbers of FBDC). The brightest MIR source is #50, followed by #48, opposite from the situation seen in the -band image, which shows source #48 brighter than source #50. For this reason, source #48 was associated with IRS 1 by previous authors. Both images also show the double nature of source #60. The companion of source #60, hereafter #60b, is located away to southwest. Like source #50, it is brighter at longer wavelengths.
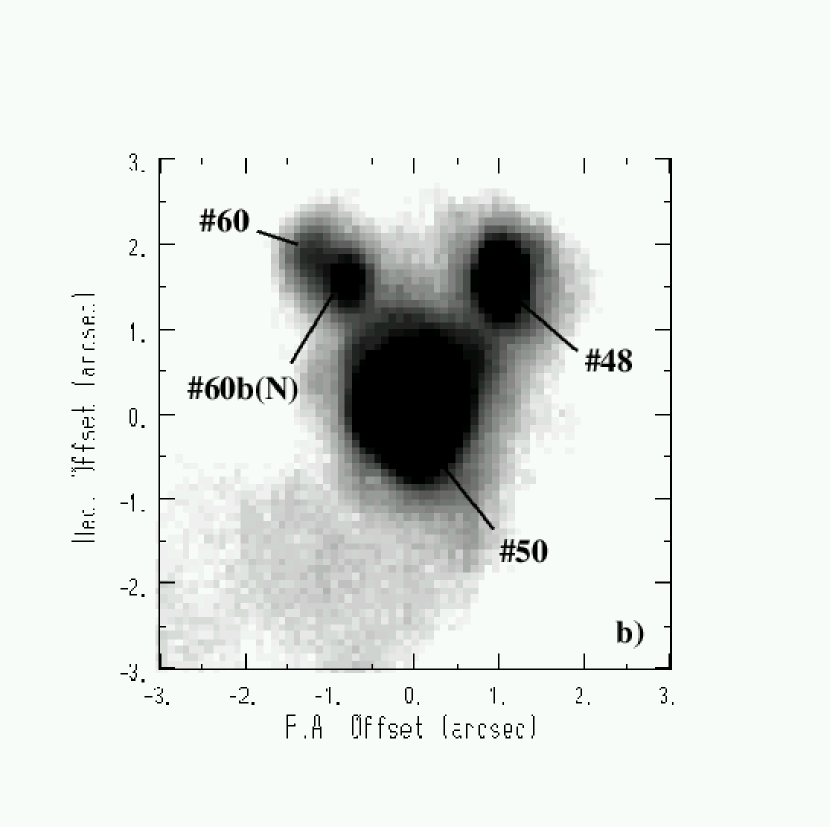
The images taken through the MIR narrow-band filters are presented in the Figure 2. Every image shows persistent artifacts located at the upper and lower right corners produced by the chop and nodding procedure. A careful inspection of the sky beam images did not show any point source object, however the artifacts could be produced by weak diffuse sources in the chopped sky beam. A logarithmic gray scale was used to emphasize the low level extended emission where the sources are embedded. The elongated shape in the N-S direction seen in the images at 7.9 and 12.5 (Figure 2a and 2c, respectively) was produced by non optimum tuning of the primary mirror active optics system. A careful inspection of the images, especially the image taken at 9.8 (Figure 2b), shows #60 elongated in the NE-SW direction. In this case, it is the effect of its near companion, as seen in the -band image. It can be noted also, that source #60 is undetected in 7.9 and 12.5 , but it is clearly seen in the 9.8 image. This brightening at 9.8 comes from the emission of dust silicate grains in low density regions surrounding source #60.
The case of source #60b(N) and #60b(K) is somewhat different. Comparing the images taken at and , we note that its centroid, relative to the centroid of other sources in the field, is shifted by . Both images were supposed to be taken under the same orientation, but a slight rotation could lead us to a mistake in the identification of the sources. The positions of the sources, relative to source #50, are listed in the Table 3. They were obtained from the astrometry of sources in the Figure 1. The positions of all sources are the same (whithin the errors), except the position of source #60b. This fact means that the -band image has the same orientation of the -band image. Therefore we believe sources #60b(K) and #60b(N) to be associated. This shifting in the positions represents cm at 2.8 kpc. This length scale is nearly the same expected for UCH II regions which have radii up to cm and dust cocoons that are 10 times larger (Wood & Churchwell, 1989b). We speculate that the positional shift is caused by emission and/or reprocessing of radiation arising from different places in the source #60 dust cocoon. -band emission could be radiated by superheated dust grains located in a dense, self-protective accretion disk, near the star (Churchwell, 2002). On the other hand, radiation detected at longer wavelength, such as the band, is emitted in the outer layers of the cocoon by warmer dust grains. The spatial resolution of both images, (or cm) is just high enough to make this effect evident.
3.1.2 Sources IRS1:SE and #95
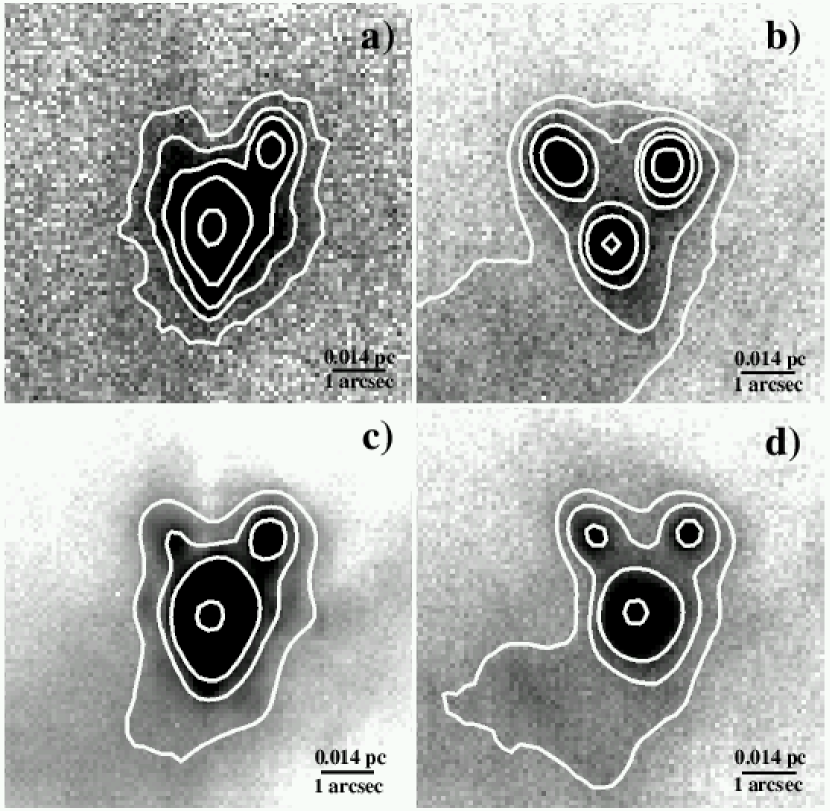
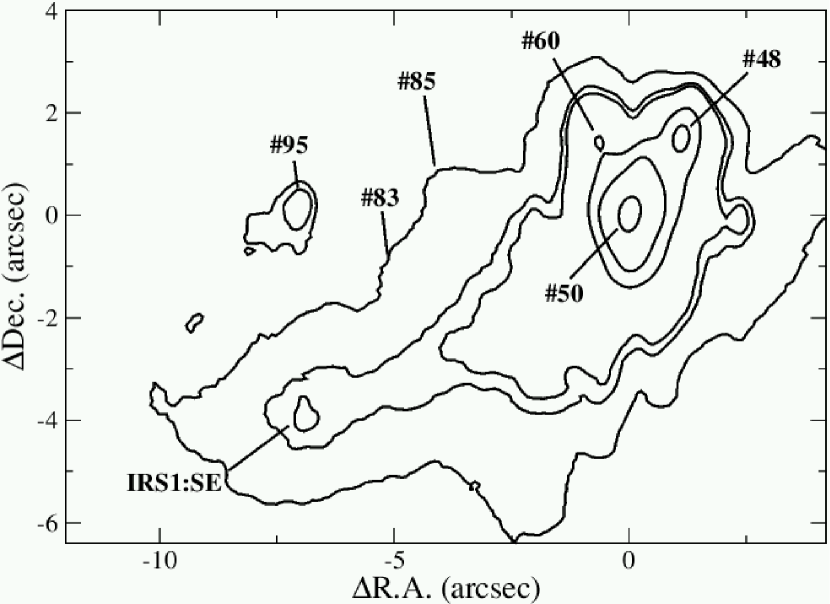
Source #95 is presented in Figure 3, a contoured mosaic in the 12.5 band built from the images taken at the positions of IRS 1 and source #95. The level curves are in arbitrary units but a logarithmic scale was used to enhance the extended emission surrounding the sources. This figure is composed of 2 adjacent images with a small overlapping area. The positions of sources #83 and #85 are indicated for reference, as well as the position of a previously unknown MIR source, detected 8 southeast of IRS 1. This source does not have any NIR counterpart to be correlated, so we named it IRS 1:SE. Images of source #95 and IRS 1:SE are shown in the Figure 4, the extended emission seen around the sources comes from the warm dust distributed in the intra-cluster medium. Source #50 has a PSF FWHM which is statistically indistinguishable from that of the unresolved standard star. IRS 1:SE is an extended source but it has a prominent peak as intense as source #95. For this reason and the fact that IRS 1:SE is located in low density end of the “tail” of the extended emission of #50 we believe it is an embedded source instead of a bright knot in the cloud. The position of the peak emission is = 11h11m54.8s and = -611826 (J2000). Source #95, instead, closely resembles a cometary UCH II in the classification scheme of Wood & Churchwell (1989b).
3.2 Photometry
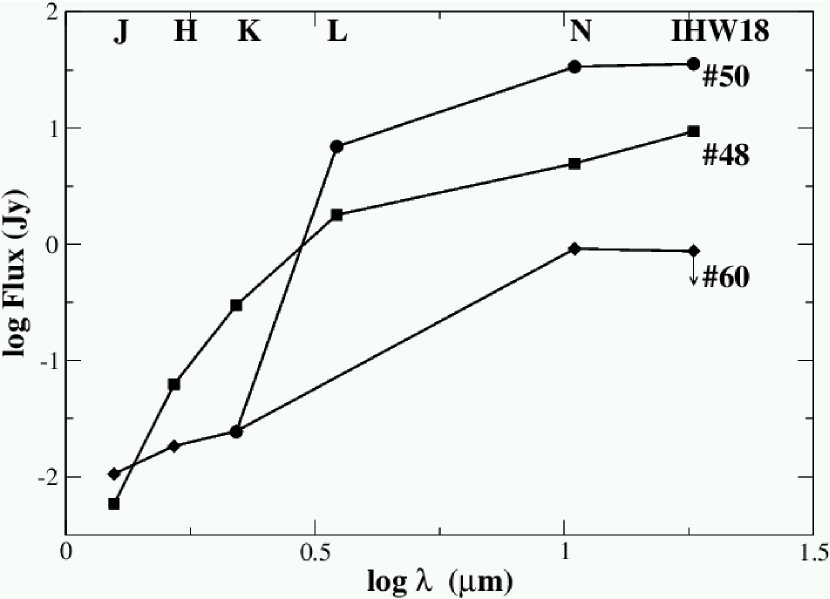
Photometry was performed by fitting a Gaussian PSF to the objects detected in the images, except IRS 1:SE. In this case the fluxes were obtained through a circular aperture of 1.5 radius centered at the peak of IRS 1:SE emission. The -band flux extracted from the calibrated image is given in the Table 2 along NIR fluxes. The fluxes were calculated from the magnitudes reported by Figuerêdo (2001) and the flux is from Moneti (1992). The magnitudes were converted into fluxes adopting the zero points from Bessel & Brett (1988). SEDs in the range 1.25 to 18.2 are plotted in the Figure 5. The SEDs show a flat spectrum for source #48 and a spectrum rising toward longer wavelengths for source #50. The 18.2 flux for sources #60 and #60b might be the fluxes of sources #60 and #60b together, since at this wavelength the sources remain unresolved.
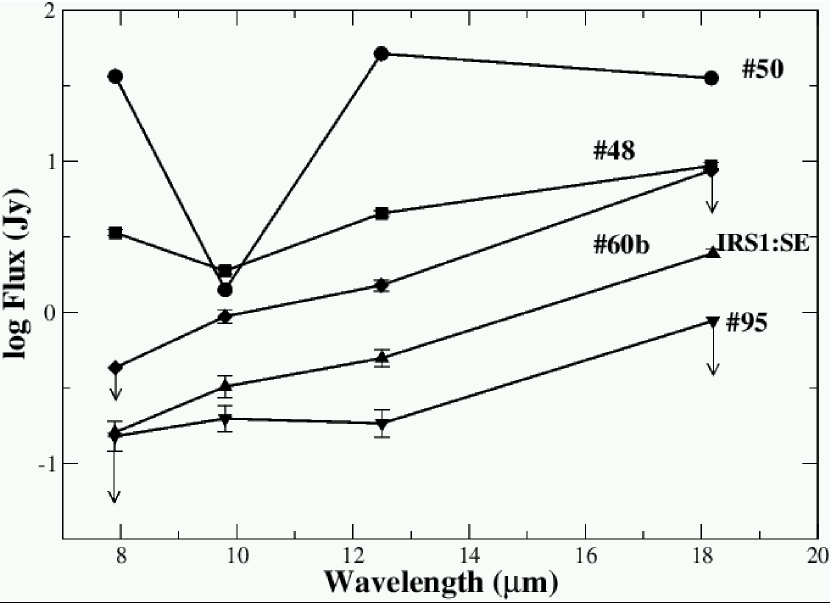
Fluxes measured for each source at MIR wavelengths are presented in Table 4. The upper limits reported in this table (except for the sources #60 and #60b) represent the fluxes of the local background emission. They were obtained by integrating the flux of the extended emission at the position of the source over a circular aperture of 0.6. Therefore they represent the minimum flux that the source indicated should have to be detected. The SEDs corresponding to the fluxes obtained with the narrow-band filters are shown in the Figure 6. The expected level of free-free MIR emission was obtained by extrapolating the 3.4 cm flux from De Pree, Nysewander & Goss (1999), assuming , after deconvolving the radio beamwidth. The free-free emission represents 0.2% of the -band flux of source #48 and #60b, 0.02% for #50, 0.05% for #95 and 0.1% for IRS 1:SE.
While there is no reason to expect the standard classification of low mass YSOs to be similar to that for high mass YSOs, we can calculate similar spectral indices for the present sources to compare with those of lower mass stars. The 2.2-12.5 spectral indices (Lada, 1987) for sources #48, #50 and #95 which we have measured the fluxes at 2.2 and 12.5 are reported in the Table 5. Sources #48 and #50 have indices like low mass Class I object () and source #95 has a similar index as low mass Class II object (), according to the classification scheme of Greene et al. (1994).
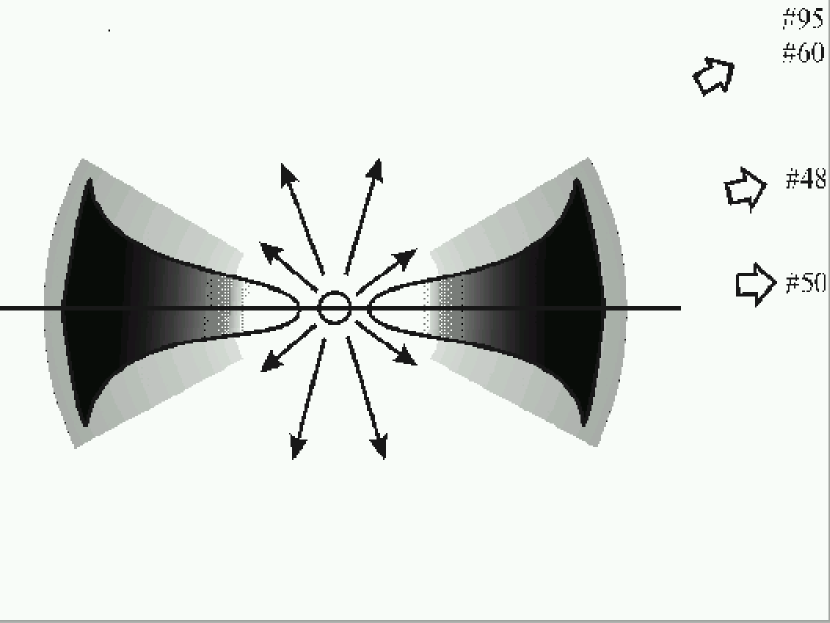
The geometry of birth sites of these stars can explain the differences in the observed SEDs. It might be that the stars are surrounded by their birth material in the form of a torus seen at different lines of sight. The radiation escaping along the rotation axis would produce a dust evacuated region, disrupting the spherical symmetric dust cocoons making them highly non uniform in density. Therefore, the stellar luminosities derived from the fluxes reprocessed by the dust can be taken as lower limits, only. Figure 7 is a sketch of this scenario. The light emitted by sources viewed edge-on or nearly edge-on is absorbed by the torus, consistent with deep dust absorption observed at 9.8 and little or no emission at wavelengths shorter than 10 . However, the emission of superheated dust grains in the inner radius of the torus (seen as white) could be detected in the band if it is not seen exactly edge-on. This would be the case of source #50. From above (or below) the torus equatorial plane, the light emitted by the star would travel through regions with lower density, implying lower absorption by the dust. From this viewpoint, the light emitted at NIR wavelengths () could be detected, but photospheric lines would appear veiled by the inner torus emission. The CO bandhead at 2.3 is detected in emission if the angle is small (the case of source #48), otherwise it would be detected in absorption (like we see in the spectra of the YSO candidates #4, #160 and #184, for which we do not have any MIR data yet). Increasing the angle over (or below) the equatorial plane, one would observe the radiation that crosses regions with even lower densities (the gray volume around the torus), in this case the dust absorption feature is absent and the star becomes brighter at wavelengths shorter than 2 . This would be the scenario for sources #95 and #60. Even at this vantage point, the photospheric lines would still appear veiled by the inner torus emission and/or by radiation reflected by the lower density dust near the star.
3.3 Color Temperature, Luminosity and Silicate Absorption
Observations at two different wavelengths can be combined to determine the dust color temperature and optical depths (Ball et al., 1996; De Buizer, 2000). Since temperature determines the ratio of blackbody flux densities at any two wavelengths, color temperature maps can be obtained by simply ratioing two calibrated images at different wavelengths.
The dust color temperature of sources in the field of IRS 1 was obtained from the ratio of images taken at 7.9 and 18.2 . Both images were registered by matching the position of source #50 and zoomed to show the sources, the resulting image is shown in the Figure 8. Sources #50 and #48 are clearly seen and they have color temperatures of (10) K and (15) K respectively. Sources #60 and #60b are not detected in this map due to their low S/N ratio.
The dust color temperature of sources #95 and IRS 1:SE were also obtained, but in this case through the fluxes measured in the 12.5 and 18.2 band, since the image taken at 7.9 has low S/N ratio. The results are: T = 270 (10) K for source #95, T = 100 (20) K for source IRS 1:SE. The uncertainties in the temperatures represent the difference between the results obtained using the 7.9/18.2 flux ratio and the 12.5/18.2 flux ratio.
MIR luminosity of sources #48 and #50 were estimated by integrating the fluxes measured at 3.5 ( band), 7.9, 12.5 and 18.2 . The MIR luminosity of source #60b, instead, was estimated by performing the same integration, but using only the fluxes measured at 7.9, 12.5 and 18.2 . From these results, we can estimate the bolometric luminosity assuming that MIR luminosity must represent % of the bolometric luminosity (Wood & Churchwell, 1989a). The results are presented in the Table 5. The spectral types were obtained from the derived bolometric luminosities and the grids of stellar models of Schaller et al. (1992), and they should be considered approximate given the large bolometric correction used to derive the bolometric luminosity.
The silicate absorption map can be used to investigate the spatial distribution of dust and was obtained by ratioing the 9.8 band image and a “continuum” image. This “continuum” was produced by averaging the images at 7.9 and 12.5 . The silicate optical depth, obtained by the procedure described by Gezari, Backman & Werner (1998), is = 3.7 for source #50, corresponding to mag, assuming (Rieke & Lebofsky, 1985) and = 0.77 for source #48 corresponding to an = 12. Previous estimates of the opacity of IRS 1 are from Persson, Frogel & Aaronson (1976) who found =3.5 using a 15 beamwidth and from Persi et al. (1994), who found using a CVF 10 spectrum taken with an aperture of 7.5. Both estimates were made using large apertures which include contributions from all sources and also their surrounding dust. Values for visual extinction obtained with NIR data for source #48 are (FBDC) and (Persi, Ferrari-Toniolo & Spinoglio, 1987).
3.4 Where is the ionizing source of NGC 3576?
IRS 1 was initially thought to be an important source of radiation to NGC 3576, but we have found that it does not contribute substantially, as we show below. The number of Lyman continuum photons derived from the radio data (De Pree, Nysewander & Goss, 1999) is s-1 for NGC 3576. A single O3 star or a cluster of at least 10 O6 stars is needed to produce the amount of Lyman continuum photons found in NGC 3576, but where are the ionizing sources?
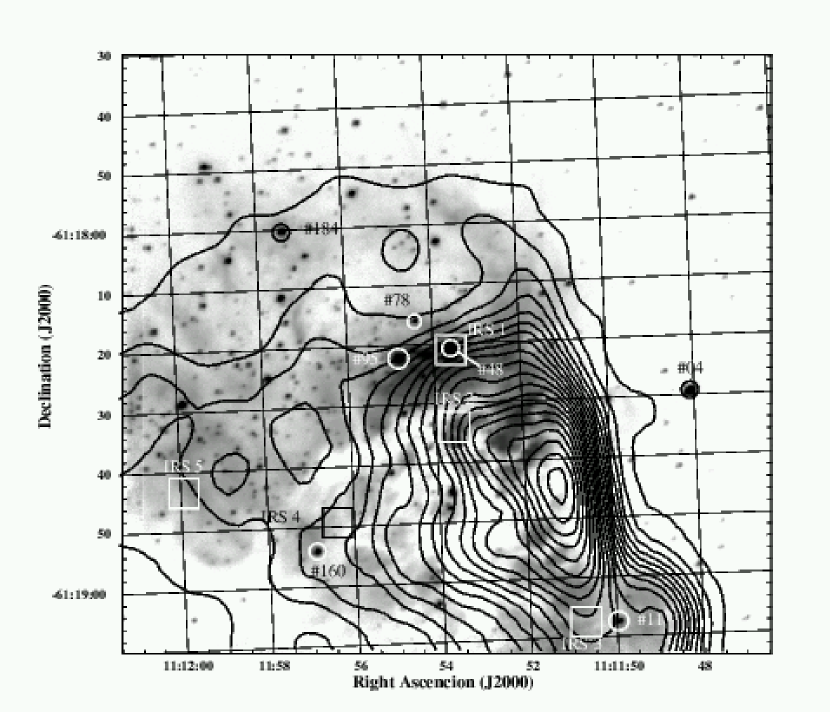
Figure 9 can give us an idea. The -band image of NGC 3576, from FBDC, was overplotted by the 3.4 cm continuum contour curves, from De Pree, Nysewander & Goss (1999). The radio beamwidth in the image is . YSOs are shown inside the circles and the positions of MIR sources, detected by Persson, Frogel & Aaronson (1976), are shown as boxes. None of the MIR sources (IRS 1-5) is associated with the radio peak emission, moreover IRS 1 does not affect the level curves in its vicinity. However, the strong continuum emission and rather large beam size of the radio image may be limiting our ability to detect compact radio emission around the IRS 1 source. The radio data neither eliminate nor preclude their presence. However, according to our torus model and expectations for the evolutionary status of the massive YSOs outlined in §1, we expect these sources might be in the UCHII region phase. Despite the lack of a compact 3.4 cm source, there is very strong Br emission surrounding the IRS 1 sources (Blum, 2003). This strongly suggests a local contribution to the ionization of the circumstellar environment of these objects. For the brightest band source, # 48, we have recently obtained a high spectral resolution (50,000) spectrum at 2.17 m on the Gemini South telescope which shows a marked double peak morphology. This morphology does not include broad wings typical of a disk like signature, but would be consistent with a shell or torus geometry. This spectrum (to be published in an upcoming paper) is consistent with our torus model, and we thus prefer the interpretation that the IRS 1 sources are in an UCHII region phase, rather than in an earlier phase of evolution.
Returning to the issue of where the dominant ionizing sources in NGC 3576 lie, we note that the radio peak emission corresponds to a region of dark patches to the south in the band image and for this reason no ionizing source(s) could be detected at . The radio peak emission lies far from any MIR source and it is identified as an UCH II region in the figure 2(f) of Walsh et al. (2001). The ionizing source(s) must be a stellar cluster, just blocked by the dark clouds in the line of sight. In this case the cluster stars must be somewhat evolved: they already have broken out their birth material producing the quoted Lyman continuum photons that are ripping apart the interviewing dark patches and hence do not form any detectable UCH II region. If the stars in the cluster were in an earlier, more enshrouded stage of evolution they could not produce the observed radio emission. A complete MIR map of the region is planned in order to further study the massive YSO candidates and their environment on the same basis as we have done for IRS 1.
4 Summary and Conclusions
We have presented MIR images of NGC 3576. IRS 1 is resolved into 4 sources for the first time at 10 . The brightest source in the band is source #50, which is different from the situation seen at , where source #48 is the brightest. We have also presented MIR images of the YSO candidate #95, and the detection of NIR sources #52, #54 and #73 as a negative object in the sky beam.
SEDs of sources #48, #50 and #60 were constructed from 1.25 to 18.2 by combining the data available in the literature with our data. We also constructed the MIR SEDs for sources #48, #50, #95 and the detected companion of source #60, named #60b, based on the fluxes measured through narrow-band filters.
The optical depth, and hence the visual extinction toward each object was obtained from the silicate absorption feature and amounts to = 3.7 (AV = 59 mag) for #50 and = 0.77 (AV = 12 mag) for #48. Previous values of visual extinction for source #48 are (FBDC) and (Persi, Ferrari-Toniolo & Spinoglio, 1987).
The MIR luminosity of sources #48, #50, #60b and #95 were obtained after integrating their MIR fluxes in order to give an approximate of their bolometric luminosities and hence the spectral types. We argue, based on the radio continuum image, that the IRS 1 sources are not the major contributors to the ionization of NGC 3576. Nevertheless, we conclude that sources #48, #50 and #95 are young massive stars possibly surrounded by a torus of gas and dust which is responsible for the different SEDs observed.
We report the detection of a new diffuse MIR source without any NIR counterpart. This source was found at 8 southeast of #50 and has a core-halo morphology. We named it IRS 1:SE and derived the color temperature of 100 K. IRS 1:SE has both morphology and color temperature compatible with HCs (Osorio, Lizano & D’Alessio, 1999). Moreover its emission profile is indistinguishable from a point source embedded in extended emission. For these reasons we do not believe IRS 1:SE is just a bright knot in the tail of the extended emission of source #50. However, additional data are needed to give any firm conclusion.
The ionizing source of NGC 3576 is believed to be behind the dark clouds seen in the -band image, blocked from detection at shorter wavelengths by large amounts of intervening dust.
References
- Ball et al. (1996) Ball, R., Meixner, M. M., Keto, E., Arens, J. F., & Jernigan, J. G. 1996, AJ, 112, 1645
- Bessel & Brett (1988) Bessell, M. S. & Brett, J. M. 1988, PASP, 100, 1134
- Blum, Conti & Damineli (2000) Blum, R. D., Conti, P. S., & Damineli, A. 2000, AJ, 119, 1860
- Blum, Damineli & Conti (2001) Blum, R. D., Damineli, A., & Conti, P. S. 2001, AJ, 121, 3149
- Blum (2003) Blum, R. D. 2003, private communication
- Caswell et al. (1989) Caswell, J. L., Batchelor, R. A., Foster, J. R., & Wellington, K. J. 1989, Australian J. Phys., 42, 331
- Caswell et al. (1995) Caswell, J. L., Vaile, R. A., Ellingsen, S. P., Whiteoak, J. B., & Norris, R. P. 1995, MNRAS, 272, 96
- Cohen et al. (1992) Cohen, M., Walker, R., Barlow, M., & Deacon, J. 1992, AJ, 104 1650
- Conti & Blum (2002) Conti, P. S., & Blum, R. D. 2002, ApJ, 564, 827
- Churchwell, Wolfire & Wood (1990) Churchwell, E., Wolfire, M. G., & Wood, D. O. S. 1990, ApJ, 354, 247
- Churchwell (2002) Churchwell, E. 2002, ARA&A, 40, 27
- De Buizer (2000) De Buizer, J. M. 2000, Ph. D. Thesis, University of Florida.
- De Pree, Nysewander & Goss (1999) De Pree, C. G., Nysewander, M. C., & Goss, W. M. 1999, AJ, 117, 2902
- Faison et al. (1998) Faison, M., Churchwell, E., Hofner P., Hackwell, J., Lynch, D. K., & Russell, R. W. 1998, ApJ, 500, 280
- Figuerêdo (2001) Figuerêdo, E., MSc Thesis, Universidade de São Paulo.
- Figuerêdo et al. (2002) Figuerêdo, E., Blum, R. D., Damineli, A., & Conti, P. S. 2002 (FBDC), AJ, 124, 2739
- Frogel & Persson (1974) Frogel, J. A., & Persson, S. A. 1974, ApJ, 192, 351
- Garay & Lizano (1999) Garay, G. & Lizano, S. 1999, PASP, 111, 1049
- Garmany (1994) Garmany, C 1994, PASP, 106, 25
- Gezari, Backman & Werner (1998) Gezari, D. Y., Backman, D. E., & Werner, M. W. 1998, ApJ, 509, 283
- Goss & Shaver (1970) Goss, W. M., & Shaver, P. A. 1970, Australian J. Phys. Astroph Suppl., 14, 1
- Greene et al. (1994) Greene, T. P., Wilking, B. A., André, P., Young E. & Lada, C. J. 1994, ApJ, 434, 614
- Hanson, Luhman & Rieke (2002) Hanson, M. M., Luhman, K. L. & Rieke, G. H. 2002, ApJS, 138, 35
- Hanson, Howarth & Conti (1997) Hanson, M. M., Howarth, I. D., & Conti, P. S. 1997, ApJ, 489, 698
- Hollenbach et al. (1994) Hollenbach, D., Johnstone, D., Lizano, S., & Shu, F. 1994, ApJ, 428, 654
- Kurtz et al. (2000) Kurtz, S., Cesaroni, R., Churchwell, E., Hofner, P., & Walmsley, C.M. 2000, in Protostars and Planets IV, ed. V. Mannings, A. P. Boss, & S. S. Russel (Tucson: Univ. Arizona Press), 299
- Lacy, Beck & Geballe (1982) Lacy, J.H., Beck, S. C., & Geballe, T. R. 1982, ApJ, 255, 510
- Lada (1987) Lada, C. J. 1987, in Star Forming Regions, ed. M. Peimbert and J. Jugaku, Reidel, Dordrecht, 1
- McGee & Gardner (1968) McGee, R. X., & Gardner, F. F. 1968, Australian J. Phys. Astroph Suppl., 21, 149
- McGee & Newton (1981) McGee, R. X., & Newton, L. M. 1981, MNRAS, 196, 889
- Moneti (1992) Moneti, A. 1992, A&A, 259, 627
- Moorwood & Salinari (1981) Moorwood, A. F. M., & Salinari, P. 1981, A&A, 102, 197
- Osorio, Lizano & D’Alessio (1999) Osorio, M., Lizano, S., & D’Alessio, P. 1999 ApJ, 525, 808
- Persi, Ferrari-Toniolo & Spinoglio (1987) Persi, P., Ferrari-Toniolo, M., & Spinoglio, L. 1987, in Circumstellar Matter, ed. I. Appenzeller and C. Jordan, IAU Symp. No. 122, Reidel, Dordrecht, 93
- Persi et al. (1994) Persi, P., Roth, M., Tapia M., Ferrari-Toniolo, M., & Marenzi, A. R. 1994, A&A, 282, 474
- Persson, Frogel & Aaronson (1976) Persson, S. E., Frogel, J. A. & Aaronson, M. 1976, ApJ, 208, 753
- Rieke & Lebofsky (1985) Rieke, G. H. & Lebofsky, M. J. 1985, ApJ, 288, 618
- Schaller et al. (1992) Schaller, G., Schaerer, D., Meynet, G., & Maeder, A. 1992 A&AS, 96, 296
- Walsh et al. (2001) Walsh, A. J., Bertoldi, F., Burton, M. G., & Nikola, T. 2001, MNRAS, 326, 36
- Wilson, et al. (1970) Wilson, T. L., Mezger, P. G., Gardner, F. F., & Milne, D. K. 1970, A&A, 6, 364
- Wood & Churchwell (1989a) Wood, D. O. S. & Churchwell, E. 1989a ApJ, 340, 265
- Wood & Churchwell (1989b) Wood, D. O. S. & Churchwell, E. 1989b ApJS, 69, 831
| Central | OSCIR | OSCIR | Observed | Exposure | ||
|---|---|---|---|---|---|---|
| Filter | Wavelength | Bandwidth | ZMFDaaZero Magnitude Flux Density | FD CMabbFlux Density of Sirius through OSCIR filters, assuming =-1.35 mag. and =-1.34 mag. Cohen et al. (1992). | PSF | TimeccOn source integration time. |
| (µm) | (µm) | (Jy) | (Jy) | (arcsec) | (s) | |
| 7.9 | 7.91 | 0.755 | 59.4 | 207.01 | 0.4 | 43 |
| 9.8 | 9.80 | 0.952 | 39.9 | 138.03 | 0.4 | 43 |
| N | 10.75 | 5.23 | 37.8 | 131.82 | 0.5 | 40 |
| 12.5 | 12.49 | 1.156 | 25.1 | 87.09 | 0.4 | 43 |
| IHW18 | 18.17 | 1.651 | 11.9 | 40.88 | 0.65 | 40 |
| Source | J | H | K | L | N | ||||
|---|---|---|---|---|---|---|---|---|---|
| (mag) | (mJy) | (mag) | (mJy) | (mag) | (mJy) | (mag) | (mJy) | (mJy) | |
| #48 | 13.6 | 5.86 | 10.56 | 62.50 | 8.35 | 299 | 5.52 | 1790 | 4950 () |
| #50 | 11.07 | 24.40 | 4.05 | 6920 | 33540 () | ||||
| #60 | 12.96 | 10.60 | 11.89 | 18.4 | 11.06 | 24.70 | 913 () | ||
| #60b | 1346 () | ||||||||
| K | N | |||
|---|---|---|---|---|
| Source | RA | Dec | RA | Dec |
| () | () | () | () | |
| #48 | 1.0 | 1.5 | 1.0 | 1.5 |
| #60 | -1.1 | 1.8 | -1.2 | 1.8 |
| #60b | -0.5 | 1.5 | -0.7 | 1.6 |
| Source | 7.9 (mJy) | 9.8 (mJy) | 12.5 (mJy) | IHW18 (mJy) |
|---|---|---|---|---|
| #48 | 3360 () | 1880 () | 4520 () | 9340 () |
| #50 | 36560 () | 1410 () | 51600 () | 35560 () |
| #52 | 227 () | |||
| #54 | 130 | |||
| #60 | 430 | 764 () | 200 | 8730bb8730 mJy is the combined 18.2 flux from both source, #60 and #60b, as these were not resolved at this wavelength. |
| #60b | 430 | 907 () | 1510 () | 8730bb8730 mJy is the combined 18.2 flux from both source, #60 and #60b, as these were not resolved at this wavelength. |
| #73 | 173 () | |||
| #95 | 151 () | 198 () | 184 () | 890 |
| IRS 1:SEaaValues for IRS 1:SE are in mJy arcsec-2. | 160 | 322 () | 498 () | 2460 () |
| Source | Tc | LMIR | aaBolometric luminosity estimated by adopting a “bolometric correction” as given by Wood & Churchwell (1989a) for UCHII regions. L = 10 LMIR, see text. | Sp. Type | Spectral |
|---|---|---|---|---|---|
| (K) | (erg s-1) | ZAMS | Index | ||
| #48 | 215 () | 2.7 | 3.8 | B1 | 0.6 |
| #50 | 280 () | 2.4 | 4.8 | O8 | 3.4 |
| #60b | 100bbLower limit for the temperature due to the unresolved nature of source at 18.2 | 3.5 | 2.9 | B3 | |
| #95 | 270 () | 1.5 | 2.5 | B5 | -0.8 |