Constraining the Cosmic Background Light with four BL Lac TeV spectra
Abstract
The intrinsic BL Lac spectra above few hundreds GeV can be very different from the observed ones due to the absorption effects by the diffuse Extragalactic Background Light (EBL), at present poorly known. With the recent results, there are now 4 sources with good spectral information: Mkn 421 (z=0.031), Mkn 501 (z=0.034), 1ES 1426+428 (z=0.129) and 1ES 1959+650 (z=0.047). Making simple assumptions on the shape of the intrinsic spectra (according to the present blazar knowledge), we have considered the effects of different EBL spectral energy distributions (SED) for the first time on all 4 objects together, deriving constraints for the EBL fluxes. These resulted significantly lower than many direct estimates.
1 Introduction
The interpretation of blazars TeV spectra is at present affected by a fundamental ambiguity, due to the absorption of high energy photons by the diffuse extragalactic background light (EBL) through - collision and pair production. The still large uncertainties on EBL knowledge prevent a reliable reconstruction of the intrinsic source spectrum, while conversely data from the synchrotron peak alone are not sufficient to univocally constrain the high energy peak of the blazars Spectral Energy Distribution (SED), thus hindering the possibility to disentangle absorption from intrinsic features. Until more and better data are available, two possible lines of study are: 1) to assume a “best estimate” for the EBL and then to study the reconstructed intrinsic spectrum in the context of blazars emission models (see e.g. co3 ); or 2) to make simple, “reasonable” assumptions on the shapes of the intrinsic TeV spectra (according to our present blazar knowledge), and then to limit the range of possible EBL fluxes (and spectral shapes) compatible with them.
This second approach becomes more constraining as more sources are available, since the EBL must be the same for all and how much an incident spectrum is deformed depends strongly on redshift. With the recent results on 1ES 1426+428 aha3 ; dj ; petry and 1ES 1959+650 horn19 ; bruno , we have now 4 objects with measured TeV spectra (see Fig. 1) and at 3 very different redshifts (0.03, 0.047, 0.129), thus allowing to draw multiple constraints. In the following, we will focus on this second approach, and present the first preliminary results on the EBL SED obtained considering the effects on all 4 TeV sources at the same time.

2 Data and Results
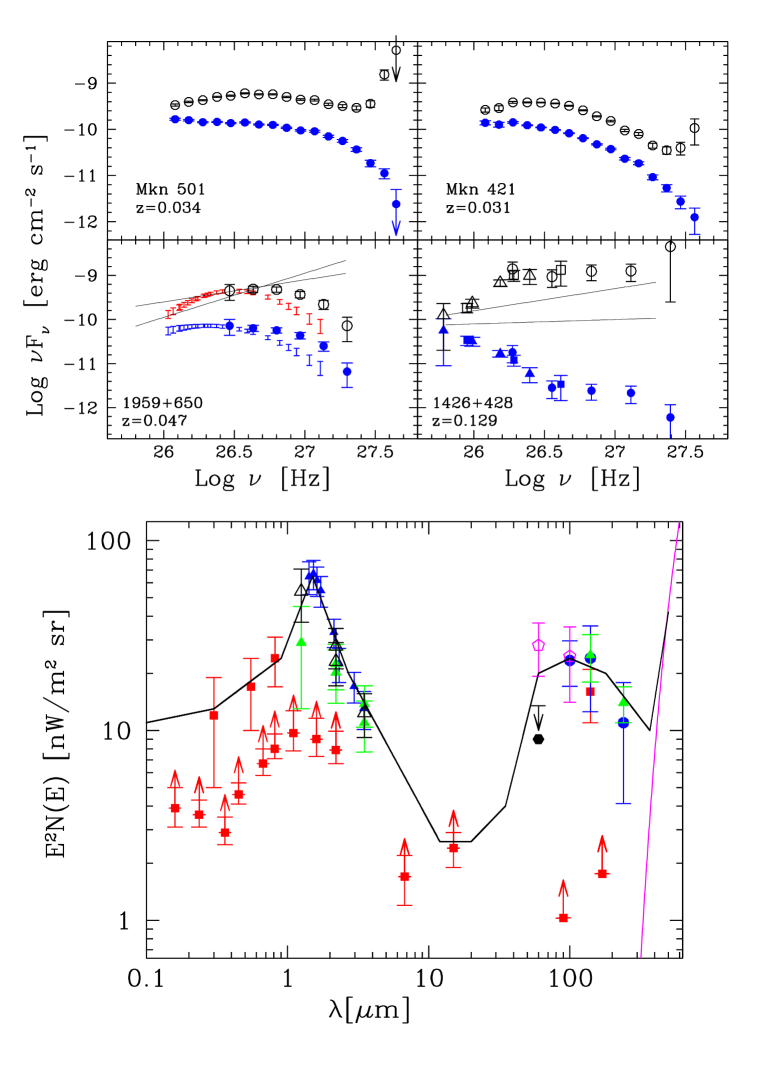
Fig. 1 and 2 show different EBL shapes (obtained simply by connecting flux values at fixed frequencies) and the corresponding effects on the absorption–corrected TeV spectra. The compilation of measurements and lower limits have been taken from haus , updated with the most recent publications (ref. in aha3 ). For the blazar spectra, we have used the HEGRA data aha1 ; aha2 ; horn19 ; aha3 completed at low energy by the CAT and WHIPPLE results for 1ES 1426+428 dj ; petry and 1ES 1959+650 bruno . In calculating the optical depths, we have assumed no model for EBL evolution, but only the changes in energy and photon density due to cosmology. For the latter, we adopted the recent W-MAP results, namely: H km/s/Mpc, and .


Our main assumptions for a “reasonable” blazar TeV spectrum have been: a smooth (power-law or curved) continuum, with no sharp features as up-turns or strong breaks, and a spectral index () not too hard, i.e. possibly , which is the hardest value expected from an electron distribution cooled by synchrotron or inverse Compton mechanisms. Fig. 1 (left) show the results with an EBL shape designed to match the reported EBL measurements, in particular the high points at 1-3 m mats , and the first estimates at 60 m fink . This gives origin to a sharp up-turn in the Mkn 501 and Mkn 421 spectra, and to an extremely hard spectrum up to 1 TeV for 1ES 1959+650 and 1ES 1426+428 (, i.e. ), with a sharp break for the latter. To avoid these effects, it is necessary to lower the EBL flux in the range 30-80 m (to avoid the up-turns in the two Markarians, Fig. 1 right) and in the range 1-3 m (to reduce the hardening of the low energy spectra, Fig. 2 left). Note also that the slope between 2 and 10 m should be around (or steeper than) , otherwise the flattening of the observed 1ES 1426+428 spectrum above 2 TeV would imply again a sharp up-turn and very hard slope for the intrinsic one horn ; aha3 .
With an EBL SED given in Fig. 2 (left), which is similar to some model predictions primack , one can avoid strange shapes for the blazar intrinsic spectra, but still has to face two uncommon features: a very hard spectrum for 1ES 1959+650 ( between 0.5 and 2 TeV) and the overall SED of 1ES 1426+428, whose TeV spectrum would imply a high energy peak at or above 8 TeV with a Compton dominance , unexpected in this class of objects co3 . To avoid this, the EBL fluxes should be of even lower intensity below 3 m , approaching the lower limits given by the HST counts madau . With a shape as given in Fig. 2 (right), the intrinsic 1ES 1959+650 spectrum would have a low energy slope around 0.5, and 1ES 1426+428 would be characterized by a lower (more usual) Compton dominance () with a TeV spectral slope similar to the X-ray one (0.9, co ; horn ). These limits can be loosened a bit taking into account the residual uncertainty on the absolute flux and energy calibration of Ĉerenkov telescopes, estimated in 20% and 15% respectively (i.e. systematically decreasing energy and normalization of the data points of all the 4 TeV sources).
3 Conclusions
To avoid “unreasonable” shapes for the blazar intrinsic spectra, at least according to our present knowledge of the blazar phenomenon, the data of the 4 TeV BL Lacs considered together put some limits to the EBL fluxes and spectral shape, which can be roughly given as: 15 nW/m2/sr in the range 0.8-3 m , 6 nW/m2/sr at 60m (these values become 20 and 10 nW/m2/sr, respectively, including the systematic error), and with a slope around or steeper than between 2 and 10 m . Conversely, if higher values or different shapes should be confirmed by more constraining data or models, this would require a deep revision of our understanding of the blazars emission mechanisms and physical conditions.
References
- (1) Aharonian F.A. et al., 2001, A&A, 366, 62
- (2) Aharonian F.A. et al., 2002, A&A, 393, 89
- (3) Aharonian F.A. et al., 2003, A&A, 403, 523
- (4) Costamante L. et al., 2001, A&A, 371, 512
- (5) Costamante L. et al., 2003, proc. ”Relativistic jets in the Chandra and XMM era”, Bologna 2002, (astro-ph/0301211)
- (6) Djannati-Ataï A. et al., 2002, A&AL, 391, 25
- (7) Finkbeiner D.P. et al., 2000, ApJ, 544, 81
- (8) Hauser M.G. & Dwek E., 2001, ARAA, vol. 39, (astro–ph/0105539)
- (9) Horns D. et al., 2003, proc. ”The Universe viewed in Gamma-Rays”, Kashiwa 2002
- (10) Horns D. et al., these proceedings
- (11) Khelifi B., PhD Thesis, http://lpnp90.in2p3.fr/Thesis
- (12) Madau P. & Pozzetti L., 2000, MNRAS, 312L, 9
- (13) Matsumoto T. et al. 2000, Lecture Notes in Physics, 548, 96
- (14) Petry D. et al., 2002, ApJ, 580, 104
- (15) Primack et al., 2001, AIP Conf. Proc. 558, 463