email: labarber@na.astro.it
Probing galaxy evolution through the internal colour gradients, the Kormendy relations and the Photometric Plane of cluster galaxies at .††thanks: Based on observations collected at European Southern Observatory (ESO 65.O-0251, 69.D-0653). Tab. 2 is fully available in electronic form at the CDS via anonymous ftp to cdsarc.u-strasbg.fr.
We present a detailed analysis of the photometric properties of galaxies in the cluster B at redshift . R-, I- and K-band structural parameters, (half light radius , mean surface brightness within and Sersic index ) are derived for galaxies, and are used to study their internal colour gradients. For the first time, we use the slopes of optical-NIR Kormendy relations to study colour gradients as a function of galaxy size, and we derive the Photometric Plane at in the K band. Colour gradients are negligible at optical wavelengths, and are negative in the optical-NIR, amounting on average to . This result is in agreement with our previous measurements of colour gradients at intermediate redshifts, and imply a metallicity gradient in galaxies of per radial decade. The analysis of the Kormendy relation suggests that its slope increases from the optical to the NIR, implying that colour gradients do not vary or even do become less steep in more massive galaxies. Such a result is not simply accomodated within a monolithic collapse scenario, while it can be well understood within a hierarchical merging framework. Finally, we derive the first NIR Photometric Plane at , accounting for both the correlations on the measurement uncertainties and the selection effects. The Photometric Plane at is consistent with that at , with an intrinsic scatter significantly smaller than the Kormendy relation but larger than the Fundamental Plane.
Key Words.:
Galaxies: clusters: individual: B – Galaxies: photometry – Galaxies: fundamental parameters1 Introduction
Studies of galaxy populations in clusters at intermediate redshifts have been proved to be an effective tool to constrain the mechanisms underlying their formation and evolution. A pure photometric approach involves the analysis of galaxy Luminosity Functions (LFs), of galaxy colours, mainly via the colour magnitude (CM) diagrams, and of the internal light distribution of galaxies, i.e. their structural parameters.
The galaxy LF and its dependence on the waveband carry information both on the stellar processes occurring in galaxies and on the cosmological processes which determine their mass function. Since Press & Schechter (1974), the shape of the LF has been seen as a basic test of theories of structure formation and evolution. The luminosities of early-type galaxies are also tightly correlated with their colours, through the colour magnitude (CM) relation (Visvanathan & Sandage, 1977; Bower, Lucey and Ellis, 1992). The slope of this relation shows little evolution with redshift up to , while its zeropoint changes according to what is expected for an old passively evolving stellar population (e.g. Stanford, Eisenhardt and Dickinson 1998, Kodama et al. 1998, hereafter KAB98). As shown by KAB98 (see also Merluzzi et al. 2003), the evolution of the CM sequence with redshift sets strong constraints on the origin of this relation, resolving the well known age–metallicity degeneracy (Worthey et al., 1996).
The structural properties of galaxies at different redshifts provide a wealth of information by which galaxy evolution can be investigated, both through the study of the correlations and through the analysis of the waveband dependence of such quantities. The NIR light, in fact, is less sensitive to more recent star formation, to metallicity effects (though line blanketing) and to dust absorption, following more closely the luminous matter distribution.
The multi-waveband analysis gives information on the internal colour gradients (CGRs) of galaxies, and therefore on the radial gradients of the properties of their stellar populations (SPs), such as age, metallicity and dust content. Nearby galaxies have on average negative CGRs, their SPs becoming bluer toward the periphery (Peletier et al., 1990; Peletier, Valentijn and Jameson, 1990). Due to the low evolution of colour gradients with redshift, metallicity seems to be the primary driver of the SP gradients in spheroidal galaxies, as demonstrated both by optical–optical studies (e.g. Saglia et al. 2000; Tamura and Ohta 2000) and by optical–NIR CG measurements (La Barbera et al., 2002, 2003a, hereafter LBM02 and LBM03a). Age gradients, however, are not fully ruled out by the present data (Saglia et al. 2000, LBM03a), while the effects of dust absorption still remain substantially unresolved. The presence of metallicity gradients can be well explained in the monolithic formation scenario of early-type galaxies (Larson, 1974), due to the later beginning of a galactic wind in the inner galaxy regions. However, it can also be accommodated within the hierarchical merging framework, since metallicity gradients are settled in disk galaxies at high redshifts, and more massive early-types form on average from the merging of larger disks (Kauffmann, 1996).
Structural parameters, such as the effective (half–light) radius , the mean surface brightness within and the Sersic index , are correlated by various relations, whose physical origins reside both in the properties of the SPs of galaxies and in the dynamical structure of these systems. For the early-type galaxies, one of these correlations is that between and , also known as the Kormendy relation (KR). As shown by Capaccioli, Caon and D’Onofrio (1992), form two distinct families in the plane of effective parameters: that of the bright early-types, following the KR, and another ‘ordinary’ family, whose properties are more disperse and heterogeneous. Recently, Graham and Guzmàn (2003) showed that a real dichotomy does not exist between the two families, but their observed properties are well explained by a systematic change in the profile shape with galaxy luminosity. The evolution of the zeropoint of the KR has been largely investigated at optical wavebands to constrain the major formation epoch of galaxy SPs and to perform the Tolman test for the cosmological expansion (Sandage and Perelmuter, 1991; Pahre, Djorgovski and de Carvalho, 1996; Barger et al., 1998; Ziegler et al., 1999; Sandage and Lubin, 2001; Lubin and Sandage, 2001). On the other hand, the slope of the KR is an interesting tool to gain insight into the properties of the galaxy SPs as a function of galaxy size (Ziegler et al. 1999, La Barbera et al. 2003b hereafter LBM03b), which is a crucial prediction of hierarchical merging scenarios. As recently shown by Graham (2002, hereafter GRA02), early-type galaxies also follow a three-dimensional relation between , and , which is similar to the spectroscopic Fundamental Plane (FP), once velocity dispersions are replaced by Sersic indices. This ‘photometric plane’ (hereafter PHP) has an observed scatter comparable to that of the Fundamental Plane (FP) relation, and carries interesting information on the physical properties of galaxies and their origin.
In the framework of a project aimed at investigating the optical–NIR photometric properties of galaxies in the fields of ROSAT PSPC extended sources, we have obtained multi-waveband data (BVRIK) for a field of centered at and , at about North ( at with , and )111We adopt this cosmology throughout the paper. With these parameters the age of the universe is , and the redshift corresponds to a lookback time of . of the Abell cluster at redshift (Arnaud et al., 1994). The coordinates of this field correspond to the center of a secondary extended emission in the X-ray map of , known as B (Elbaz, Arnaud and Böhringer, 1995, hereafter EAB95), with an X-ray temperature . The cluster (, )222The coordinates refer to and define the peak of the X-ray emission (EAB95). is a very rich and complex structure of galaxies, which has been extensively studied for its exceptionally hot X-ray temperature, (see Markevitch et al. 1996, and references therein), and for its huge radio halo, one of the most powerful known so far (Feretti et al., 2001, hereafter FFG01). Our data show the presence of a significant excess of galaxies at redshift in the field of B, with a NIR spatial distribution typical for a cluster of galaxies, with a main central overdensity and a secondary structure at in the North-East direction.
In the present work, we study the photometric and structural properties of the galaxy population of B, by discussing the constraints implied by our results on different galaxy evolution scenarios.
The layout of the paper is as follows. The data are presented in Sec. 2, while the luminosity density map, the colour magnitude relations and the K-band LF of B are studied in Sec. 3. Cluster members are then selected by the photometric redshift technique, as described in Sec. 4. The derivation of structural parameters is outlined in Sec. 5. Sec. 6 deals with the comparison of structural parameters and with the analysis of the internal colour gradients of galaxies. Secs. 7 and 8 deal with the correlations between the structural parameters. In Sec. 7, we attempt for the first time to perform an optical/NIR comparative study of the – relation, while in Sec. 8 we use the K-band data to analyze the PHP for the population of spheroids in B. Discussion and conclusions follow in Sec. 9. Details on data reduction are given in Appendix A, while the estimate of the cluster redshift from the optical–NIR CM relations is detailed in Appendix B. The catalogue, including all the photometric properties of galaxies in the field of B, that is BVRIK total magnitudes, colours, photometric redshifts and RIK structural parameters, is described in Section 2.3.
2 The data
2.1 Observations
The data relevant for the present study were collected at the ESO New Technology Telescope and include BVRIK photometry centered on the field of galaxies B. The data were obtained on August and September 2000 (hereafter run I), under partly non photometric conditions, and on April 2002 (run II), under photometric conditions.
During three nights of run I, we obtained K-band imaging with the SOFI instrument (pixel scale ) for a field of . The sky conditions were photometric for two nights and non photometric for the third night. A total of 120 exposures were collected, with a DIT of , , and a dithering box of . Due to the non photometric conditions, only 85 exposures were retained, resulting in a total integration time of . Standard stars from Persson et al. (1998) were observed during each night, each at five different positions on the chip. In order to perform the illumination correction (see Sec. A.2), we also observed a standard star at different positions on a grid across the frame. In the same period, we also obtained V-, R-, and I-band photometry with the EMMI instrument for a region of (pixel scale ), under non photometric conditions. On April 2002, the field B was re-observed in B, V, R and I band with EMMI under photometric conditions. The relevant information on the observations are summarized in Tab. 1. The total exposure times amount to , , and for the B, V, R and I bands, respectively.
2.2 Analysis
The data were reduced by using FORTRAN routines developed by the authors and IRAF packages333IRAF is distributed by the National Optical Astronomy Observatories, which are operated by the Association of Universities for Research in Astronomy, Inc., under cooperative agreement with the National Science Foundation. . Details are given in Appendix A.1 and A.2 for the optical and the NIR images, respectively. Photometry was derived by using the software S-Extractor (Bertin & Arnout, 1996). For the optical images, S-Extractor was run in the so-called double-image mode, using the R-band image for the detection of the sources, and the other images only to measure their fluxes. Particular care was taken so that closed objects were deblended in the same way both in the optical and in the NIR images. The BVRI and the K-band catalogues were cleaned by spurious detections and cross-correlated. For each object, we computed colour indices by using magnitudes within a fixed aperture of diameter , corresponding to at redshift . Since the images have different seeing, the aperture magnitudes were corrected to the same FWHM of , following the procedure detailed in La Barbera et al. (2003c). The aperture corrections amount to , , , , and for the B, V, R, I and K bands, respectively. Total magnitudes were obtained with the S-Extractor mag-auto parameter, which provides magnitudes in an adaptive aperture of diameter , where is the Kron (1998) radius, and , for which the Kron magnitude encloses of the object source. Total magnitudes444In the following, total magnitudes will be indicated by a pedex . were then obtained by subtracting from the Kron magnitudes. The uncertainties on galaxy magnitudes were obtained by adding in quadrature the errors on the photometric zeropoints to the uncertainties estimated by S-Extractor. Galaxy/star separation was performed on the basis of the stellar index of S-Extractor, defining as stars the objects with . The completeness of the K-band photometry, which is used in Sec. 3.2 for the LF analysis, was derived by following the method of Garilli, Maccagni and Andreon (1999). This method consists in the determination of the magnitude at which objects start to be lost since they are below the brightness treshold in the detection cell. To estimate the completeness limit, the magnitudes in the detection cell were computed and compared to the total magnitudes. This approach allows to define a conservative value for the completeness magnitude, corresponding to a completeness percentage of . The completeness magnitude in the K band is . Down to this limit, the BVRIK catalogue includes galaxies. The completeness of the BVRIK catalogue with respect to the K-band catalogue is at , falling to at . At , the typical photometric accuracies on the B-, V-, R- and I- band data amount to 0.38, 0.17, 0.11 and 0.1 mag, respectively. For the optical catalogues, we also computed the fraction of sources () for which S-Extractor provides reliable magnitude estimates555We adopted an upper limit of for the uncertainty on the flux. as a function of the K-band magnitude. For the B band, amounts to at , dropping to at . For the V, R and I bands, we have and , respectively.
2.3 The catalogue
![[Uncaptioned image]](/html/astro-ph/0307482/assets/x1.png)
The BVRIK photometric catalogue for the galaxies with photometric redshift estimate (see Sec. 4)666The full catalogue will be available in electronic form at the CDS via anonymous ftp to cdsarc.u-strasbg.fr. is shown in Tab. 2.
The catalogue is organized as follows. Two rows correspond to each
galaxy. The first one provides the measured quantities, while the
second one gives the relative uncertainties (one sigma standard
intervals). All the photometric quantities have been corrected for
galactic extinction by using the photometric redshift estimates and
adopting , with the extinction law from SFD98. The
typical uncertainties on the structural parameters are discussed in
Sec. 6.1.
Column 1: running number of the catalogue.
Column 2: photometric redshift.
Column 3, 4: right ascension and
declination referred to J2000. The astrometric solution was computed
by using a list of stars from the USNO catalogue. The rms of the
residuals to the astrometric solution is .
Columns
5–9: B-, V-, R-, I- and K-band total magnitudes.
Columns 10–13:
optical–NIR galaxy colours in the aperture of corrected for
seeing effects.
Columns 14–16: mean surface brightness
within the effective radius , logarithm of (in arcsec) and
Sersic index for the R-band.
Columns 17–19: the same of
columns 14–16 for the I-band.
Columns 20–22: the same of columns
14–16 for the K-band.
Columns 23, 24: axis ratio and position
angle in degree obtained from the K-band surface photometry.
3 The cluster B
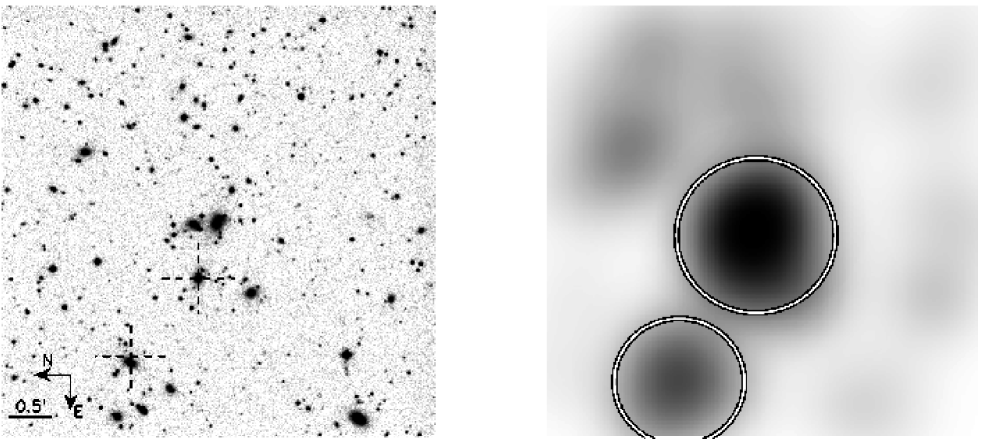
Fig. 1 plots the K-band image of B and the luminosity-weighted density map for the galaxies brighter than . The figure clearly shows the presence of a cluster of galaxies, with a main over-density in the center and a secondary structure at a distance of () from the main peak. We note that, on the basis of field galaxy counts (Sec. 3.2), only galaxies out of 105 are expected to be field contaminants in the area of the K-band image, confirming that the features in Fig. 1 (right panel) are highly significant. It is very interesting to note that both the X-ray image of B and the radio map show a spatial structure very similar to the luminosity density image (see Fig. 7 of FFG01). In Fig 1, we also show the positions of the two radio sources found by FFG01. One of this turns out to coincide with an early-type777Sersic index greater than 2. galaxy (possible merging) in the main clump, while the second one is very close to a bright early-type in the second overdensity region.

In order to derive the redshift of the galaxy population of B we compared the BVRIK photometry with predictions of stellar population models from the GISSEL00 code (Bruzual & Charlot, 1993). In particular, we used (1) the optical–NIR colour magnitude (hereafter CM) relations (Sec. 3.1), (2) the K-band LF (Sec. 3.2) and (3) the photometric redshift technique (Sec. 4). We point out that, although it is known that broad-band colours are degenerate in age, metallicity and redshift, and that uncertainties exist among stellar population models (e.g. Charlot, Worthey and Bressan 1996), the large wavelength baseline provided by our photometry (from U to NIR restframe) and the use of the GISSEL synthesis code allow to obtain a reliable redshift estimate of galaxies at intermediate redshift by using purely photometric techniques, as shown by other studies (e.g. de Propris & Pritchet 1998, Busarello et al. 2002, La Barbera et al. 2003c). Another important point for estimating is the effect of the galactic reddening . The main sources for the reddening of the Milky Way are based on measurements from Burstein & Heiles (1984, hereafter BH84) and on COBE/DIRBE and IRAS/ISSA FIR data from Schlegel, Finkbeiner and Davis (1998, hereafter SFD98). Generally, the estimates of from SFD98 are systematically higher than those of BH84. For B, BH84 and SFD98 predict very different extinction values, and , respectively. In the next section, we obtain a simultaneous estimate of the galactic reddening as well as of the cluster redshift from the optical–NIR colour magnitude relations. This procedure gives an extiction value which is in remarkable agreement with that of SFD98 and a redshift estimate of , which concides within the uncertainties with that obtained from the K-band LF (Sec. 3.2), for which extinction effects are negligible. The difference between BH84 and SFD98 reddening values, therefore, does not affect the present analysis.
3.1 Colour magnitude relations
Fig. 2 shows the optical–NIR CM diagrams, not corrected for galactic extinction, for all the galaxies brighter than in the field of B. Each diagram shows a sharp sequence of red galaxies, following the CM relation:
| (1) |
where N is the optical waveband, is a reference K-band magnitude, is the slope and is the zeropoint of the relation, that is the colour at . The values of and , that are shown in Fig. 2, were estimated by applying a least square fit, minimizing the rms of the residuals in colour, , to the relation. In order to reduce the effect of outliers and field contaminants, the value of was computed by using the bi-weight statistics (Beers, Flynn and Gebhardt, 1990). Moreover, for comparison with previous works (KAB98), the fits were performed by considering only the galaxies within the three brightest magnitudes of the red sequence, corresponding to . We note that, down to this limit, the BVRIK photometry is complete (see Sec. 2.2), and that, on the basis of field galaxy counts (see Sec. 3.2), only of the galaxies are expected to be field contaminants. Despite the large uncertainties, the values of show that the slope of the CM relation increases systematically from about for the sequence to about for the relation. The slopes of the , and sequences can be straightly compared with those predicted from a pure mass-metallicity model by KAB98 at the redshift of B (, see below): , , and (see their Fig. 4). We note, in fact, that the CM slopes of KAB98 were normalized to a physical aperture of , which is very similar to that adopted in the present work, and, therefore, the effects of galaxy colour gradients do not affect the comparison of CM slopes. Our results fully agree with the values of KAB98.
The zeropoints of the CM relation were used to obtain a simultaneous estimate of the cluster redshift and of the galactic reddening in the direction of , fitting the values of with the colours expected from old stellar population models (see Appendix B for details). In this approach, we took into account the degeneracy among metallicity and the other stellar population parameters exploiting the fact that the CM relation mainly origins from a mass-metallicity relation (see Merluzzi et al. 2003 and references therein). This procedure gives and . It is quite remarkable that (1) the estimate of is in very good agreement with that of SFD98, , and (2) the value of coincides with that obtained from the K-band LF, which is virtually unaffected by galactic reddening. For this reason, we adopted in the following , and applied the corresponding absorption corrections to our photometry888For , at , and practically for any galaxy spectral model, we have , , , and .. Repeating the zeropoint fitting with gives , which is fully consistent with the redshift of the main cluster structure ( ) at .

3.2 Luminosity function
The evolution of the characteristic magnitude of the K-band LF of cluster galaxies at is consistent with the behaviour of an old passive stellar population with formation redshift and solar metallicity. This result has been obtained by de Propris et al. (1999, hereafter dPS99) fitting a Schechter function (hereafter SF) with fixed slope to the K-band counts of cluster galaxies with , and turns out to be independent of cluster richness or X–ray luminosity.
We used these results in order to obtain a further estimate of the redshift of B. The K-band LF was obtained by correcting our number counts with field galaxy counts from the Calar Alto Deep Imaging Survey (CADIS, see Huang et al. 2001), which is the largest medium deep K-band survey to date, with a total area of and a completeness magnitude of . Since our K-band photometry is complete down to (see Sec. 2.2), the CADIS data are the most suitable dataset for the estimate of field galaxy counts. The LF of B is shown in Fig. 3. The error bars take into account Poissonian uncertainties on both field and cluster counts, while the different curves show the SF fits of the LF. In order to account for the finite size of the magnitude bins, the fits were performed by the convolution of a SF with the bin size. Following dPS99 and de Propris & Pritchet (1998, hereafter dPP98), we fitted the galaxy counts down to (, see below) by a SF with , excluding the three brightest cluster galaxies. The fit provided a good description of the counts of bright galaxies999 The only two bins for which galaxy counts deviate by more than from the model are at . We note that limiting the fit range to does not affect our results, giving ., giving the following estimate of the characteristic magnitude: . In order to estimate , we minimized the function:
| (2) |
where is the value of expected at redshift , and was obtained by adding to the value of the characteristic magnitude of the Coma cluster (, see dPP98) the luminosity distance term and the K+E corrections, derived from GISSEL00 spectral models with a Scalo IMF and an exponential SFR. It turned out that, by using models with different metallicities () and formation redshifts (), the estimate of does not vary significantly: . This result is in very good agreement with that obtained from the CM relations in Sec. 3.1, and, therefore, still shows that the redshift of B is consistent with that of the main cluster structure . We found that the estimate of is very robust with respect to the field subtraction procedure and to the value adopted for the galactic reddening, due to the low sensitivity of the K-band photometry to dust absorption. For example, by using , we obtain , and neglecting field counts gives .
In order to study the faint end of the LF, we performed a SF fit for by treating both and as free parameters. As shown in Fig. 3, the SF, whose best-fit parameters are and , provides a good description of the LF of B. The cluster counts show some deviation from the SF fit only for the two bins at and . Although this could be an indication of a bimodal behaviour of the LF, as found by previous studies (see Mercurio et al. 2003, and references therein), the deviations are only at the levels of and , respectively, and are therefore not very significant. The value of is in very good agreement with the value of found by Andreon (2001) for a rich cluster of galaxies at in an area of , which is similar to that analyzed in the present study (), and is also consistent with values of the faint end slope of the NIR LF for the Coma cluster, (dPP98) and (Andreon & Pellò, 2000), and for field galaxies, (Kochanek et al., 2001). We also analyzed the dependence of the LF of B on environment, by performing the SF fits separately for the galaxies inside the higher density region, defined by the circles in Fig. 1, and for the galaxies outside that region. The two LFs are shown in Fig. 4 with the corresponding SF fits. Interestingly, we found that the values of vary from (higher density) to (lower density), implying a steepening of the faint end slope at lower densities, in agreement with the findings of other studies (see Haines et al. 2003, submitted, and references therein). This steepening is due to the fact that, as shown in Fig. 4, the lower density environment is characterized by a higher fraction of faint galaxies, with a significant difference () in the low- and high- density counts at .

4 Photometric redshifts
In order to select cluster members, we used the photometric redshift technique, which has been proven to be an effective tool to estimate the redshift of cluster galaxies at intermediate redshifts (e.g. Busarello et al. 2002, La Barbera et al. 2003c and references therein). Photometric redshifts were estimated according to the Spectral Energy Distribution fitting method (see Massarotti, Iovino and Buzzoni 2001; Massarotti et al. 2001, and references therein). In order to achieve a reasonable accuracy, we considered galaxies with signal-to-noise ratio in at least three bands, limiting the sample to the galaxies brighter than . Since the percentage of galaxies101010This estimate was obtained by using a Pure Luminosity Evolution model (see e.g. Pozzetti, Bruzual and Zamorani 1996). at redshift with is expected to be negligible (), we looked for redshifts in the range with a step of 0.01, imposing that at a given redshift galaxy templates were younger than the age of the universe in the adopted cosmology. We used the GISSEL00 code in order to produce galaxy templates with a Scalo IMF and an exponential SFR . The colours of E/S0, Sa/Sb, and Sc/Sd spectra were modeled by choosing and , respectively, while early-type galaxies with different metallicities were described by using E/S0 models with =0.2, 0.4, 1 and 2.5. The differential dust extinction of the Milky Way was included in the computation of model colours by adopting the extinction curve of Cardelli, Clayton and Mathis (1989) and a colour excess of (see Sec. 3.1). The uncertainty on the photometric redshift was estimated by performing numerical simulations, taking into account the measurement errors on galaxy colours. The mean value of is , varying from at to at .

As shown in Fig. 5, the distribution of photometric redshifts is dominated by the peak around , indicating that most galaxies with are actually cluster members. Applying the bi-weight statistics, we obtained the following estimate of the cluster redshift: , in agreement with the values obtained in Sec.3.1 and 3.2. Galaxies with photometric redshift in a range of around were defined as cluster members, resulting in a final list of objects111111We note that in the analysis of the optical-NIR colour gradients we consider only the galaxies brighter than . Proceding as described in La Barbera et al. (2003c), we estimated that at this limiting magnitude, in the redshift range adopted to select cluster members, only of the galaxies are expected to be field contaminants, proving the reliability of the cluster members selection for the surface photometry analysis.. This value is in good agreement with that predicted from the LF of cluster galaxies, (see Sec. 3.2).
5 Surface photometry
Surface photometry was derived for all the galaxies brighter than in the R and I bands, and for the galaxies brighter than in the K band. These selection criteria were chosen in order to obtain reliable structural parameters from the B photometry, and were the results of numerical simulations performed as described in LBM02. A further selection was performed a posteriori by excluding few faint galaxies in the I and K bands because of the strong contamination from closed stars. The resulting samples include and galaxies for the R, I and K bands, respectively, with objects in common between the R and I bands, and galaxies in common between the R and K bands. Structural parameters for these galaxies are given in the catalogue (see Sec. 2.3).
Galaxy images were fitted with 2D models convolved with the PSF, as detailed in LBM02. As shown in that paper, the 2D approach allows reliable structural parameters to be obtained for galaxies at intermediate redshift () from ground based data taken under ordinary observing conditions (seeing and pixel scale ). Galaxy models were parametrized by the Sersic law:
| (3) |
where r is the equivalent radius, is the effective
(half-light) radius, is the central surface brightness,
is the Sersic index, and b is a constant (, see Caon, Capaccioli and D’Onofrio 1993). For each galaxy, nearby objects were
masked interactively, while overlapping galaxies were fitted
simultaneously. The minimization was performed by the
Levenberg-Marquardt method, deriving a total of six best-fit
parameters: the center coordinates, the effective radius, the central
surface brightness, the position angle and the axis ratio
. The mean surface brightness within , , and the total
magnitude were computed from the fitting parameters by using
the well known properties of the Sersic law (see Ciotti and Bertin 1999). The
typical uncertainties on galaxy parameters were estimated by comparing
structural parameters between different wavebands (see next section).
The PSF models were obtained by a multi-Gaussian expansion of the
images of bright unsaturated stars in the cluster field. For the R
and I bands, all the stars were fitted simultaneously, resulting in a
single PSF model. For the K band, the PSF turned out to vary across
the field, showing significant deviations from the circular shape in
the North-East corner of the frame. Since star images were available
at different positions across the field, with an almost uniform
coverage, we adopted for each galaxy the PSF model obtained from the
closest star. PSF distortions were treated as in LBM03a, by adopting
gaussian functions with elliptical isophotes.
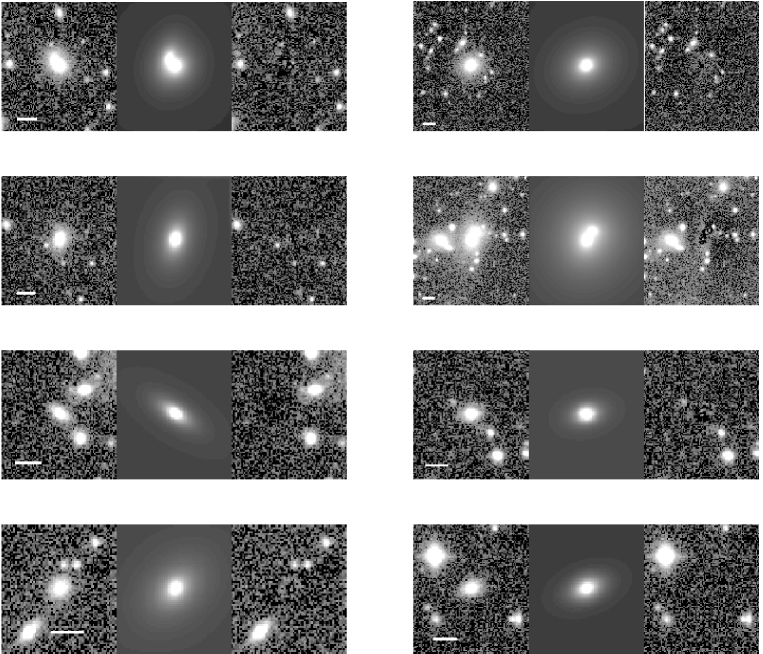
Fig. 6
plots, as an example, the K-band 2D fitting of some galaxies in the
cluster field. The models turned out to give a very good description
of the galaxy images.

6 Optical–NIR internal structure of cluster galaxies
The waveband dependence of the structural parameters carries information on the differential properties of SPs inside galaxies. This subject was investigated in LBM03a, who first attempted to analyze the evolution of the UV–NIR structural properties of both the populations of disk dominated (Sersic index smaller than 2) and spheroidal galaxies up to redshift , by using a large sample of cluster galaxies (). Following that work, we studied the internal optical–NIR structure of galaxies for B by (1) a straight comparison of structural parameters (Sec. 6.1) and (2) estimating the internal colour gradients of galaxies (Sec. 6.2). Since the number of disks in common between the R and K bands turned out to be negligible ( out of 58), we did not attempt121212Disk galaxies are included in the analysis of Sec. 6.1 and 6.2. However, the results are unchanged by excluding these galaxies from the samples. to study the waveband dependence of their structural properties. The following results will refer, therefore, to the spheroidal population of B.

6.1 Comparison of structural parameters
Fig. 7 shows the comparison of structural parameters for the galaxies in common between the R and I bands. Differences are always computed by subtracting the quantities at longer wavelengths from those at shorter wavelengths. The following quantities are considered: effective radii and mean surface brightnesses, Sersic indices, and the combination of and which enters the Fundamental Plane: . We note that the differences of mean surface brightnesses, , were obtained by subtracting the galaxy colours, that is: . The mean value, , and the standard deviation, , of each distribution are shown in the figure, while in the lower right panel we also plot the correlation between and . Optical parameters are in remarkable agreement, with mean differences that are fully consistent with zero for each quantity. This is consistent with the fact that the R and I bands at correspond approximately to V and R restframe, sampling, therefore, a very similar spectral region for early-type galaxies. For this reason, we used the distributions of Fig. 7 to estimate the uncertainties on , and , by computing the covariance matrix of the differences between the R- and I-band parameters. The standard deviations of the distributions amount to in , for and for . We note, however, that due to the well known tight correlation between the uncertainties on the effective parameters (see e.g. Jørgensen, Franx and Kjærgaard 1995), the values have a much smaller dispersion, only .
Differences between R- and K-band structural parameters are shown in Fig. 8. We note that the differences of mean surface brightnesses, , were obtained by subtracting the galaxy colours, that is: . The mean values of the distributions show that cluster galaxies are more concentrated in the NIR than in the optical, having NIR effective radii which are on average smaller than in the R-band (), and Sersic indices slightly larger in the K band, although the last difference is not very significant. The mean difference of can be fully explained by using the definition of total magnitude , and computing the difference between R- and K-band total magnitudes:
| (4) |
Since , we obtain the relation , which, for , gives ,
in very good agreement with the mean value shown in
Fig. 8. The same procedure allows the mean difference of the
variable to be explained.
The dispersion of the distributions in Fig. 8 is due (1) to
the uncertainties on both the R- and K-band parameters, and (2) to
the intrinsic scatter of the optical–NIR properties of galaxies. We
verified by numerical simulations (performed as described in LBM02)
that the uncertainties on the K-band structural parameters are as
large as or smaller than those estimated for the optical wavebands.
This suggests that the dispersions of the histograms in
Fig. 8 have mainly an intrinsic origin. In Secs. 7
and 8, in order to describe the uncertainties on , and , we adopted the same covariance matrix for both the
optical and the NIR data. By looking at Fig. 8, we stress
again the small dispersion in the variable, that amounts to
.
6.2 Colour gradients
The internal colour gradient of galaxies can be computed from the values of the effective radii and of the Sersic indices in the different wavebands, as described in LBM02 (see their Eq. 4).
The distributions of colour gradients for the galaxies of B are shown in Fig. 9, we wrote the and colour gradients as and restframe gradients, respectively. By using different galaxy templates from the GISSEL00 code, we verified, in fact, that the conversion from () at into () at is independent of the spectral type (for ), with variations of and between different spectral models for the optical–optical and the optical–NIR colours, respectively. As expected on the basis of the structural parameters, galaxies show optical–optical colour gradients which are fully consistent with zero, while the V-K colour gradients are negative for most galaxies, implying that their SPs are on average redder in the center. The mean value of the optical–NIR gradient is , which implies that galaxies become bluer per decade of radius toward the periphery. The value of is fully consistent with the colour gradient estimate of LBM03a ().
7 Optical–NIR Kormendy relations

The – diagrams for the galaxies of B are shown in Fig. 10 for the R and K bands. We note that the I-band data provide almost the same spectral information as the R-band photometry, and therefore are not discussed in the following. For each band, we excluded the disks () and the galaxies for which the total magnitude estimated by the structural parameters is fainter than the completeness magnitude. This selection results in and galaxies in the R and K bands, respectively. For what concerns the NIR data, we also excluded two galaxies that have small radii and low surface brightness and for which, therefore, structural parameters are possibly affected by a larger uncertainty. The K-band sample consists of objects. In order to describe the – sequence, we consider the following equation for each waveband :
| (5) |
where is the effective radius in , and are the zeropoint and the slope of the relation. The evolution of the slope, of the zeropoint and of the intrinsic dispersion of the KR has been recently studied in the optical by LBM03b, who showed that these properties do not change significantly over redshift at least up to . They found , an intrinsic dispersion of , and a KR zeropoint of in the R band at . In order to derive the values of and for B, we applied the fitting procedure (see LBM03b), which allows the selection criteria to be taken into account, providing un-biased estimates of the KR coefficients. The fitting results are shown in Fig. 10. For what concerns the dispersion of the KRs, its value turns out to be consistent between the R and K bands, amounting to in and to in . The R-band slope of the – relation is fully consistent with that of LBM03b, in agreement with their finding that this coefficient does not evolve significantly over redshift. By adopting in the fit, we obtain and, therefore, also the R-band zeropoint turns out to be in full agreement with the result of LBM03b, once that measurement errors are taken into account. By subtracting in quadrature from the observed scatter around the KR the amount of dispersion due to the measurement uncertainties131313To this aim, we took into account the correlation of the uncertainties on and . on and , we obtain the following estimate of the intrinsic dispersion of the KR: ( in ). This value is a little larger than, but consistent with the estimate of LBM03b.
In order to compare the coefficients of the optical and NIR – sequences, we have to take into account (1) the variation of the galaxy colour along the sequence due to the colour magnitude relation and (2) the waveband dependence of and due to internal colour gradients of galaxies. By using Eqs. 1, 4 and 5, we obtain the following relation:
where is the mean logarithmic ratio of R- and K-band effective radii, and are the zeropoint and the slope 141414 We note that Eq. LABEL:TRASFEQ was derived assuming that eq. 1 still holds once that aperture colours are replaced by the total galaxy colours, . We verified, in fact, that the values of and do not change significantly by using Kron magnitudes to estimate the galaxy colours. of the vs. colour magnitude relation, , , and . We note that the value of corresponds to the zeropoint of the NIR KR, while is equal to only if the third term of the last member of Eq. LABEL:TRASFEQ vanishes, that is if the ratio of optical to NIR effective radii and, therefore, the internal colour gradient of galaxies does not vary systematically along the – sequence. By using the coefficients of the CM relation derived in Sec.3.1, the mean ratio of optical to NIR effective radii (), and the R-band KR coefficients ( and ), we obtain , and . The value of is in good agreement with that of , while the value of is only marginally consistent with , with a difference of . Since the value of is negative, this difference could be explained if the ratio would become smaller for larger values of , implying that larger galaxies have a less steep colour gradient. Fig. 11 plots and as a function of . Although the figure seems to favor the trend suggested by the difference of and , the error bars do not allow such a trend to be definitively proven. We point out, however, that the previous results are in clear disagreement with a possible steepening of colour gradients with galaxy size, since it would make the discrepancy between and strongly significant. This point will be further addressed in Sec. 9.


8 The NIR Photometric Plane at
Fig. 12 plots different projections of the distribution of
galaxies in the space of the NIR structural parameters151515The
waveband dependence of the Photometric Plane will be investigated in a
forthcoming paper, by using a larger sample of galaxies.. As shown
in Fig 12a, effective radii are correlated with Sersic
indices (e.g. Young and Currie 2001), in the sense that galaxies with a
larger size tend to have a surface brightness profile more peaked in
the center. By looking at Fig. 10, we see that, taking into
account the dispersion of the KR, the completeness magnitude line
begins to intercept the – relation at , implying that galaxies in the shaded area of Fig 12a
start to be lost from the present sample because of the magnitude
selection. We applied a bi-weight least square fit to the data with
, minimizing the rms of the residuals with respect
to . The fit gives , with an rms that amounts to () in and in , which is much larger
with respect to that obtained for the KR ().
We note that the regression is quite insensitive to selection
cuts with respect to , and, in fact, the above coefficients do not
vary significantly including all the galaxies in the fit.
The
other panels of Fig. 12 show different projections of the
so-called Photometric Plane (PHP). For comparison with GRA02, we
adopted the following representation of the PHP:
| (6) |
which is analogous to the usual equation of the Fundamental Plane
(FP), once the velocity dispersion term is replaced with . Following GRA02, the coefficients and
were obtained by a least square fit minimizing the rms of
the residuals to . We also took into account the
correlation of the uncertainties on the structural parameters by using
the MIST algorithm (La Barbera, Busarello and Capaccioli, 2000). The fitting results are , and , with a
residual rms of in . In order to correct
these values for the magnitude cut, we generalized to the 3D case the
procedure adopted in the previous section for the KR fit (see LBM03b
for details). We found that the bias in the coefficient is
negligible, while it amounts to and for the
coefficients and , respectively, and to for
the dispersion in the variable. After correction, the
fitting coefficients become ,
and , with a corrected scatter of , which is smaller by than that of the KR.
The ‘corrected’ values of a, b and c were used to obtain the edge-on
sections (Fig. 12b, c) and the face-on projection
(Fig. 12d) of the PHP.
The slopes and the scatter of the
NIR PHP at turn out to be in remarkable agreement
with those derived by GRA02 for galaxies in the Fornax and Virgo
clusters: , and . We point out that the magnitude
selection significantly affects the coefficient and that,
therefore, it would be very interesting to use a sample of galaxies
spanning a larger magnitude range in order to better constrain this
coefficient. The selection effects can be further illustrated by
looking at the face-on projection of the PHP in Fig. 12d.
Due to the finite dispersion of the galaxies around the PHP, its
intersection with the plane results in a ‘strip’, whose
‘upper’ border marks the limits of the dashed area in
Fig. 12d. As consequence, the distribution of galaxies in
this area is not ’complete’.
In order to estimate the intrinsic
dispersions of the – relation and of the PHP, we
subtracted to the observed dispersion in the amount of scatter
expected from the measurement errors on the observed parameters,
taking into account the covariance terms between the uncertainties on
, and . The intrinsic dispersions of the – relation and of the PHP turn out to be and , respectively. Interestingly, we find that the
measurement errors account only for few percents of the observed
dispersion around the PHP, because, as shown in Fig. 12b,
their correlation is almost parallel to the plane, in the same way as
for the KR.
9 Discussion and conclusions.
We have studied the galaxy population in a field around the X-ray extended source B, at about North the cluster of galaxies (). The BVRIK catalogue is presented, including total magnitudes, colours, photometric redshifts and the RIK structural parameters (effective radius, mean surface brightness and Sersic index).
The K-band luminosity density map of B presents a main central overdensity of radius , and a secondary structure from the center. The colour magnitude diagrams show a sharp red sequence whose slope flattens at longer wavelengths: galaxy colours become bluer by per magnitude in the vs. diagrams, and by into the vs. plane. These values agree with the predictions of a mass-metallicity model of the CM relation (KAB98). By introducing a suitable procedure to account for the Milky Way reddening, we find that the zeropoints of the CM sequence are consistent with those expected for a red galaxy population at redshift , implying that B is a cluster of galaxies likely involved in a merging event with . The value of is also confirmed by the analysis of the K-band LF and by the photometric redshift technique, which is used to select cluster members. The luminosity segregation of B is investigated by means of the K-band LF. The global LF is well described by a single Schecter function with a faint end slope of , in agreement with other studies of the NIR LF both in clusters and in the field (e.g. Andreon 2001, Kochanek et al. 2001). On the other hand, the faint end slope depends on environment, varying from about in the two higher density clumps, to about into the outer region, implying that the population of dwarf galaxies is less abundant into the denser environment. This behaviour of the LF suggests that some mechanism, such as tidal disruption or cannibalism, is working in the higher density environments, decreasing the number of faint galaxies (Haines et al. 2003, submitted).
Surface photometry has been derived in the R, I and K bands for cluster galaxies, and has been used:
- i)
-
to compare galaxy parameters at optical/NIR wavelengths, and to estimate the optical and NIR internal colour gradients;
- ii)
-
to perform a comparative optical/NIR analysis of the KR;
- iii)
-
to derive the PHP of spheroids at in the K band.
The characteristics of the light distribution in galaxies are the same
between the optical wavebands, while a significant difference is found
when comparing optical to NIR parameters. Effective radii become a
factor greater from the K to the R band, implying that
the light profile in galaxies is much more concentrated in the NIR
than in the optical. On the other hand, surface brightnesses show a
waveband dependence that is fully explained by the behaviour of and by the galaxy colours. The value of is consistent with what we found in previous
works on the optical/NIR structural parameters of cluster galaxies at
and (see LBM02 and LBM03a), and is
within the range of results reported in previous works. Nelson et al. (2002)
and Rembold et al. (2002) found by analysing
brightest cluster galaxies at and nearby early-types,
respectively, while a lower value, ,
was found by Pahre, de Carvalho and Djorgovski (1998).
The population of spheroids in B
has null colour gradients at optical wavelengths (
restframe) and optical-NIR gradients that are significantly negative
(), consistently with the quoted
differences among the effective radii. As shown by LBM03a, the
optical-NIR gradients do not evolve significantly with redshift,
amounting to . As detailed in that work, the redshift
dependence of both optical-NIR and UV-optical colour gradients
strongly constrains the age and metallicity of the inner and outer
galaxy stellar populations. Using the colour gradient model of LBM03a
(see model Z1, Tab. 6), the quoted colour gradients imply a
metallicity gradient in spheroids of per decade
of radius. This result is in agreement with that reported from other
studies of colour gradients for both nearby and intermediate redshift
galaxies (Saglia et al. 2000; Idiart, Michard and Pacheco 2002).
Monolithic collapse models predict that early-type galaxies are more metal rich in the center than in the outskirts. During galaxy formation, the gas dissipates its kinetic energy carrying the heavy elements ejected from the evolved stars into the inner region (Larson, 1974). Numerical simulations predict a metal abundance gradient of about (e.g. Carlberg 1984, and Kawata 2001, see their models B1/B2 which correspond to the magnitude range of our samples). This value is not consistent with our results, although some caution is needed due to scatter present both in the observed data and in the simulation results (see Kawata 2001). The difference of observed and predicted metallicity gradients suggests that gas dissipation has a minor role in monolithic collapse models. We note, however, that dissipation is required in order to reproduce the mass-metallicity relation of early-type galaxies and their moderate orbital anisotropies. We argue, therefore, that some tuning of the parameters driving the physics of gas dissipation would be required in order to fit all the observed properties into the monolithic scenario. A likely explanation of the observed metallicity gradients resides in the merging processes, which mix the SPs inside galaxies. It has been shown that both dissipationless merging of spheroidal systems (White, 1980) and dissipative merging of disk galaxies (Bekki & Shioya, 2001) produce more shallow stellar population gradients.
The slope and the zeropoint of the optical – relation are consistent with those obtained in LBM03b. For what concerns the NIR KR, we compared its slope and zeropoint with the optical values by taking into account (i) the colour magnitude relation and (ii) the mean value of the ratio of optical/NIR effective radii. These factors fully explain the difference among the optical and NIR zeropoints. The most interesting result is that the slope of the R-band KR, corrected for the effects (i) and (ii), is lower by than the K-band value. We show that this difference can be explained if the ratio of optical to NIR effective radii (the optical/NIR colour gradient) decreases (flattens) for larger galaxies. A direct inspection of the and the vs. diagrams shows that such trend exists. Our data do not favour a steepening of colour gradients with galaxy size, that would imply a larger discrepancy between the R- and K-band KR slopes. A steepening of colour gradients with galaxy luminosity (size) is a natural expectation of the monolithic collapse model, due to the galactic wind mechanism (Larson, 1974). The galactic wind blows early in less massive galaxies, preventing gas dissipation to carry heavy metals in the center, and producing, therefore, a less steep gradient in these systems. A steepening of colour gradients with galaxy luminosity has been unfruitfully looked for by various studies (e.g. Peletier et al. 1990, Bartholomew et al. 2001). Recently, Tamura and Ohta (2003) measured the optical colour gradients for galaxies at . They found that the optical colour gradient of very bright early-types () can steepen with galaxy luminosity, while an opposite trend was suggested for fainter galaxies. A similar bimodal behaviour was found by (Balcells and Peletier, 1994) for the colour gradients of early-type spiral bulges. We note that our data do not allow us to distinguish the behaviour of colour gradients for the very bright early-types, while they allow a larger magnitude range in both optical and NIR to be analyzed. In hierarchical merging models, more massive galaxies form from larger disk systems, which have stronger internal gradients. Since merging dilutes the stellar population gradients (White, 1980), if galaxies with larger size have experienced a higher merging rate (Capaccioli, Caon and D’Onofrio, 1992), their colour profile can be as flat as or even less steep than those of smaller systems. The data of B seem to favour this interpretation.
Finally, we have analyzed the so-called Photometric Plane (PHP) of spheroids at . We find that galaxies follow a bivariate relation between K-band effective parameters and the logarithm of the Sersic index: . Accounting for the correlations among the uncertainties on structural parameters as well as for the selection effects, we find and , and an observed dispersion of in . These values are consistent with the optical PHP coefficients found by GRA02 for early-types in the Fornax and Coma clusters. We have discussed how the magnitude cut affects the distribution of galaxies in the space of the structural parameters: the term of the PHP turns out to be significantly affected by the magnitude selection, indicating that it would be very interesting to analyze a larger, deeper sample of galaxies to further constrain the coefficients of this relation. Interestingly, we find that the correlation of the uncertainties on the structural parameters is almost parallel to the PHP, analogously to what happens for the KR. This implies that the intrinsic scatter of the PHP amounts to about , which is only few percents smaller than the observed scatter, but lower than that of the KR (). Therefore, although the observed scatter around the plane seems to be similar to that of the spectroscopic Fundamental Plane () as found by GRA02, the present data indicate that its intrinsic dispersion can be significantly larger. This point will have to be further analyzed by studying samples of galaxies for which both velocity dispersions and Sersic indices are available.
Appendix A Data reduction
A.1 BVRI data
Both the images of the first and of the second run were reduced by following the same procedure. After bias subtraction, the images were divided by a flat-field frame obtained by combining twilight sky exposures. Since this procedure did not fully remove low frequency variations of the background across the images (at level of ), we obtained a super–flat correction for each band by median combining the corresponding scientific exposures. A polynomial fit was applied to each super–flat frame and the fitted surfaces were used to correct the scientific exposures. This procedure reduced background variations in the final images at the level of . After flat–field, the cosmic rays in each exposure were detected by using the IRAF task COSMICRAYS, and a mask frame was constructed including hot pixels and the bad columns. The images of each run were then combined by using the IRAF task IMCOMBINE. Since only Run II was photometric, the images of Run I were suitably scaled and combined with those of Run II. The scaling factors were computed from the mean difference of the magnitudes of bright unsaturated stars in the observed field. The seeing FWHM is , , and for the B, V, R, and I bands, respectively. The images were calibrated into the Johnson-Kron-Cousins photometric system by using standard stars from Landolt (1992). Since comparison fields for different airmasses were not available, we adopted the extinction coefficients typical for the site of La Silla: . Instrumental magnitudes for the Landolt stars were computed within an aperture of diameter by means of S-Extractor (Bertin & Arnout, 1996). For each band, in order to obtain the zeropoint and the colour term of the photometric calibration, we performed a robust least square fit. Colour terms were found to be small and were neglected, while the zeropoints turned out to be , , , (scaled to exposure time).
A.2 K-band data
For each dithering sequence, the exposures were dark subtracted and corrected for flat-field, using a super flat frame obtained by median combining all the images taken during the night. After this procedure, the magnitudes of the standard stars showed a rms variation across the chip of . To achieve a better accuracy, we obtained an illumination correction frame by measuring the magnitude of a standard star at different positions in a grid on the frame. All the images were divided by the illumination correction frame, which allowed the low frequency component of the flat-field to be corrected at better than . Since sky subtraction is a very troublesome step for the reduction of NIR data, particularly in high density regions mostly populated by bright early-type galaxies with extended halos, this point was carefully dealt with by a two step procedure. First, each exposure was sky subtracted by computing the sky frame from the median of the six closest frames along the sequence. The images were then registered with integer shifts and combined, with a sigma clipping algorithm for cosmic ray rejection. This procedure, however, overestimate the sky level in the extended halos of galaxies, and therefore, it is not suitable to derive the surface photometry. For this reason, we reiterated the sky subtraction, proceeding as follows. The first step images were used to obtain mask frames for the sources in the field, by running S-Extractor with the checkimage OBJECTS option. For each sequence, the mask was expanded in order to ’cover’ the galaxy halos and was de-registered to each dithered exposure, by including also hot and bad pixels. The sky frames were estimated by an average of the six closest frame for each sequence exposure, rejecting masked pixels. The images were then sky subtracted and combined with IMCOMBINE161616The images taken under non-photometric conditions were suitably scaled to the others. (using the SIGCLIP option), resulting in a final image with a seeing FWHM of . The photometric calibration was performed into the Ks standard filter (Persson et al., 1998), deriving the instrumental magnitudes of the standard stars within an aperture of diameter . The airmass correction was performed by using an extinction coefficient , which was derived by comparing the magnitudes of bright objects in the field for different airmasses. The K-band zeropoint turned out to be (scaled to exposure time).
Appendix B Deriving from the CM relations
The zeropoints of the CM relations (Eq. 1) were fitted with the colours calculated for an old, passively evolving SP, as a function of the redshift and of the reddening . To account for the metallicity change along the CM sequence, we proceeded as follows. As shown by Merluzzi et al. (2003), the CM relation is reproduced by the metallicity–luminosity relation:
where is the absolute V-band magnitude. Using the slope of the CM relation for nearby early-types from Bower et al. (1992), the above relation allows the absolute K-band magnitude to be estimated for a given metallicity . For , we obtain . In order to predict the value of as a function of redshift (), we have to take into account the luminosity distance term, and the K+E corrections. To obtain these corrections, we used galaxy templates from the GISSEL00 code (Bruzual & Charlot 1993), with a Scalo IMF, an exponential star formation rate and solar metallicity. These models were also used to predict (1) the optical–NIR galaxy colours as a function of the redshift , and (2) the absorption coefficients and as a function of and , using the extinction law from SFD98. The values of and were derived by minimizing the following expression:
| (7) |
where are the template colours, and is the formation redshift, which was allowed to vary in the range . The uncertainties on and were obtained by shifting the values of according to the relative uncertainties and re-iterating the minimization. We note that the uncertainties on also include the contribution of the errors in photometric zeropoints, which were added in quadrature to the uncertainties on galaxy magnitudes (see Sec. 2.2). We found that the estimates of and do not change significantly by adopting either , (Simple Stellar Population models), or (models with a more protracted star formation rate).
References
- Andreon (2001) Andreon, S. 2001, ApJ, 547, 623
- Andreon & Pellò (2000) Andreon, S., & Pelló, R. 2000, A&A, 353, 479
- Arnaud et al. (1994) Arnaud, M., Elbaz, D., Bö hringer, H., Soucail, H., & Mathez, G. 1994, in New Horizon of X-Ray Astronomy, ed. F. Makino & T. Ohashi (Tokyo: Universal Academy), 537
- Balcells and Peletier (1994) Balcells, M., & Peletier, R. F. 1994, AJ, 107, 135
- Barger et al. (1998) Barger, A.J., Aragón-Salamanca, A., Smail, I., Ellis, R.S., Couch, W.J., Dressler, A., Oemler, A., Poggianti, B.M., & Sharples, R.M. 1998, ApJ, 501, 522
- Bartholomew et al. (2001) Bartholomew, L.J., Rose, J.A., Gaba, A.E., & Caldwell, N. 2001, AJ, 122, 2913
- Beers, Flynn and Gebhardt (1990) Beers, T.C., Flynn, K., & Gebhardt, K. 1990, AJ, 100, 32
- Bekki & Shioya (2001) Bekki, K., & Shioya, Y. 2001, Ap&SS, 276, 767
- Bertin & Arnout (1996) Bertin, E., & Arnout, S. 1996, A&AS, 117, 393
- Bower, Lucey and Ellis (1992) Bower, R.G., Lucey, J.R., & Ellis, R.S. 1992, MNRAS, 254, 589
- Bruzual & Charlot (1993) Bruzual, G.A., & Charlot, S., 1993, ApJ, 405, 538
- Burstein & Heiles (1984) Burstein, D., & Heiles, C. 1984, ApJS, 54, 33 (BH84)
- Busarello et al. (2002) Busarello, G., Merluzzi, P., La Barbera, F., Massarotti, M., & Capaccioli, M. 2002, A&A, 389, 787
- Caon, Capaccioli and D’Onofrio (1993) Caon, N., Capaccioli, M., & D’Onofrio, M., 1993, MNRAS, 265, 1013
- Capaccioli, Caon and D’Onofrio (1992) Capaccioli, M., Caon, N., & D’Onofrio, M. 1992, MNRAS, 259, 323
- Cardelli, Clayton and Mathis (1989) Cardelli, J.A., Clayton, G.C., & Mathis, J.S. 1989, ApJ, 345, 245
- Carlberg (1984) Carlberg, R.G. 1984, ApJ, 286, 403
- Charlot, Worthey and Bressan (1996) Charlot, S., Worthey, G., & Bressan, A. 1996, ApJ, 457, 625
- Ciotti and Bertin (1999) Ciotti, L., & Bertin, G. 1999, A&A, 352, 447
- de Propris & Pritchet (1998) de Propris, R., & Pritchet, C.J. 1998, AJ, 116, 1118 (dPP98)
- de Propris et al. (1999) de Propris, R., Stanford, S.A., Eisenhardt, P.R., Dickinson, M., & Elston, R. 1999, AJ, 118, 719 (dPS99)
- Elbaz, Arnaud and Böhringer (1995) Elbaz, D., Arnaud, M., & Böhringer, H. 1995, A&A, 293, 337 (EAB95)
- Feretti et al. (2001) Feretti, L., Fusco-Femiano, R., Giovannini, G., & Govoni, F. 2001, A&A, 373, 106 (FFG01)
- Garilli, Maccagni and Andreon (1999) Garilli, B., Maccagni, D., & Andreon, S. 1999, A&A, 342, 408
- Graham (2002) Graham, A. 2002, 334, 859 (GRA02)
- Graham and Guzmàn (2003) Graham, A., & Guzmàn, R. 2003, AJ, 125, 2936
- Haines et al. (2003) Haines, C.P., Mercurio, A., Merluzzi, P., et al. 2003, A&A, submitted
- Huang et al. (2001) Huang, J.-S., Thompson, D., Kümmel, M.W., et al. 2001, A&A, 368, 787
- Idiart, Michard and Pacheco (2002) Idiart, T.P., Michard, R., & de Freitas Pacheco, J.A. 2002, A&A, 383, 30
- Jørgensen, Franx and Kjærgaard (1995) Jørgensen, I., Franx, M., & Kjærgaard, P. 1995, MNRAS, 273, 1097
- Kauffmann (1996) Kauffmann, G. 1996, MNRAS, 281, 475
- Kawata (2001) Kawata, D. 2001, ApJ, 558, 598
- Kochanek et al. (2001) Kochanek, C.S., Pahre, M.A., Falco, E.E., et al. 2001, ApJ, 560, 566
- Kodama et al. (1998) Kodama, T., Arimoto, N., Barger, A.J, & Aragón-Salamanca, A. 1998, A&A, 334, 99 (KAB98)
- Kron (1998) Kron, R.G. 1980, ApJS, 43, 305
- La Barbera, Busarello and Capaccioli (2000) La Barbera, F., Busarello, G., & Capaccioli, M. 2000, A&A, 362, 851
- La Barbera et al. (2002) La Barbera, F., Busarello, G., Merluzzi, P., Massarotti, M., & Capaccioli, M. 2002, ApJ, 571, 790 (LBM02)
- La Barbera et al. (2003a) La Barbera, F., Busarello, G., Massarotti, M., Merluzzi, P., & Mercurio, A. 2003a, A&A, 409, 21 (LBM03a)
- La Barbera et al. (2003b) La Barbera, F., Busarello, G., Massarotti, M., Merluzzi, P., & Capaccioli, M. 2003b, ApJ, 595, 127 (LBM03b)
- La Barbera et al. (2003c) La Barbera, F., Merluzzi, P., Iovino, A., Busarello, G., Massarotti, M., & Capaccioli, M. 2003c, A&A, 399, 899
- Landolt (1992) Landolt, A.U. 1992, AJ, 104, 340
- Larson (1974) Larson, R.B., 1974 MNRAS, 166, 585
- Lubin and Sandage (2001) Lubin, L.M., & Sandage, A. 2001, ApJ, 122, 1084
- Markevitch et al. (1996) Markevitch, M., Mushotzky, R., Inoue, H., et al. 1996, ApJ, 456, 437
- Massarotti, Iovino and Buzzoni (2001) Massarotti, M., Iovino, A., & Buzzoni, A. 2001, A&A, 368, 74
- Massarotti et al. (2001) Massarotti, M., Iovino, A., Buzzoni, A., & Valls-Gabaud 2001, A&A, 380, 425
- Mercurio et al. (2003) Mercurio, A., Massarotti, M., Merluzzi, P., Girardi, M., La Barbera, F., & Busarello, G. 2003, A&A, 408, 57
- Merluzzi et al. (2003) Merluzzi, P., La Barbera, F., Massarotti, M., Busarello, G., & Capaccioli, M. 2003, ApJ, 589, 147
- Nelson et al. (2002) Nelson, A.E., Simard, L., Zaritsky, D., Dalcanton, J.J., & Gonzalez, A.H. 2002, ApJ, 567, 144
- Pahre, de Carvalho and Djorgovski (1998) Pahre, A.M., de Carvalho, R.R., & Djorgovski, S.G. 1998, AJ, 116, 1606
- Pahre, Djorgovski and de Carvalho (1996) Pahre, M.A., Djorgovski, S.G., & de Carvalho, R.R. 1996, 456, 79
- Peletier et al. (1990) Peletier, R.F., Davies, R.L., Illingworth, G.D., Davis, L.E., & Cawson, M. 1990, AJ, 100, 1091
- Peletier, Valentijn and Jameson (1990) Peletier, R.F., Valentijn, E.A., & Jameson, R.F. 1990, A&A, 233, 62
- Persson et al. (1998) Persson, S.E., Murphy, D.C., Krzeminski, W., Roth, M., & Rieke, M.J. 1998, AJ, 116, 2475
- Pozzetti, Bruzual and Zamorani (1996) Pozzetti, L., Bruzual A.G., & Zamorani, G. 1996, MNRAS, 281, 953
- Press & Schechter (1974) Press, W.H., & Schechter, P. 1974, ApJ, 187, 425
- Rembold et al. (2002) Rembold, S.B., Pastorizia, M.G., Dicati, J.R., Rubio, M., & Roth, M. 2002, A&A, 391, 531
- Saglia et al. (2000) Saglia, R.P., Maraston, C., Greggio, L., Bender, R., & Ziegler, B. 2000, A&A, 360, 911
- Sandage and Perelmuter (1991) Sandage, A., & Perelmuter, J.-M. 1991, ApJ, 370, 455
- Sandage and Lubin (2001) Sandage,A., & Lubin, L.M. 2001, ApJ, 121, 2271
- Schlegel, Finkbeiner and Davis (1998) Schlegel, D., Finkbeiner, D.P., & Davis, M. 1998, ApJ, 500, 525 (SFD98)
- Stanford, Eisenhardt and Dickinson (1998) Stanford, S.A., Eisenhardt, P.R.M., & Dickinson, M. 1998, ApJ, 492, 461
- Tamura and Ohta (2000) Tamura, N., & Ohta, K. 2000, AJ, 120, 533
- Tamura and Ohta (2003) Tamura, N., & Ohta, K. 2003, AJ, 126, 596
- Visvanathan & Sandage (1977) Visvanathan, N., & Sandage, A. 1977, ApJ, 216, 21
- Young and Currie (2001) Young, C.K., & Currie, M.J. 2001, A&A, 369, 736
- White (1980) White, S.D. 1980, MNRAS, 191, 1
- Worthey et al. (1996) Worthey, G., Trager, S.C., & Faber, S.M., 1996, in ASP Conf. Ser. 86, Fresh Views of Elliptical Galaxies, ed. A. Buzzoni, A. Renzini, & A. Serrano (San Francisco: ASP), 203
- Ziegler et al. (1999) Ziegler, B.L., Saglia, R.B., Bender, R., et al. 1999, A&A, 346, 13