Indications for grain growth and mass decrease in cold dust disks around Classical T Tauri stars in the MBM 12 young association
Abstract
We report detection of continuum emission at and 450 m from disks around four Classical T Tauri stars in the MBM 12 (L1457) young association. Using a simple model we infer masses of 0.0014–0.012 M⊙ for the disk of LkH 263 ABC, 0.005–0.021 M⊙ for S18 ABab, 0.03–0.18 M⊙ for LkH 264 A, and 0.023–0.23 M⊙ for LkH 262. The disk mass found for LkH 263 ABC is consistent with the 0.0018 M⊙ inferred from the scattered light image of the edge-on disk around component C. Comparison to earlier 13CO line observations indicates CO depletion by up to a factor 300 with respect to dark-cloud values. The spectral energy distributions (SED) suggest grain growth, possibly to sizes of a few hundred m, but our spatially unresolved data cannot rule out opacity as an explanation for the SED shape. Our observations show that these T Tauri stars are still surrounded by significant reservoirs of cold material at an age of 1–5 Myr. We conclude that the observed differences in disk mass are likely explained by binary separation affecting the initial value. With available accretion rate estimates we find that our data are consistent with theoretical expectations for viscously evolving disks having decreased their masses by %.
1 Introduction
The majority of low-mass stars emerge from their parental clouds surrounded by disks of 0.001–0.3 M⊙ (Beckwith & Sargent, 1996). At ages of a few Myr, these disks appear to evolve rapidly from optically thick at near- and mid-infrared and detectable at (sub)millimeter wavelengths, to undetectable at all wavelengths (Robberto et al., 2000; Jayawardhana et al., 1999; Carpenter, 2002; Haisch et al., 2001; Luhman, 2001; Hartmann, 2001; Duvert et al., 2000). The physics behind this transition and its timescale holds clues about the planet formation process (Clarke et al., 2001; Matsuyama et al., 2003a, b; Armitage et al., 2003). The previous references focus on inner disk material traced by infrared excess. Much less is known about colder material further from the star, even though this encompasses the bulk of the mass. This Letter investigates the presence of cold material around several members of the MBM 12 young association.
Judging from the relative occurrences of K- (%) and L- and N-band (%) infrared excess, the MBM 12 (L1457) young association is suspected to be at the very stage where disks start to disappear (Luhman, 2001; Jayawardhana et al., 2001). After several unsuccessful attempts (Pound 1996, Hogerheijde et al. 2002), Itoh et al. (2003) recently reported detection at 1 and 2 mm of continuum emission around two or possibly three Classical T Tauri stars in this 1–5 Myr old association (Luhman, 2001), indicating the presence of M⊙ of cold material around each object. This Letter increases the number of detections of cold dust to four objects (§3), including the recently identified edge-on disk source LkH 263 C (Jayawardhana et al., 2002). By extending the wavelength coverage into the submillimeter we can fit the spectral energy distributions (SEDs), and gain more robust disk-mass estimates and insight into grain growth (§4). The Letter concludes with a discussion of the inferred mass range in terms of multiplicity (Jayawardhana et al., 2002; Chauvin et al., 2002; Brandeker et al., 2003) and disk-dispersal models (§5).
2 Observations
The observations were obtained with the Submillimeter Common User Bolometer Array (SCUBA) (Holland et al., 1999) on the James Clerk Maxwell Telescope111The JCMT is operated by the Joint Astronomy Centre in Hilo, Hawaii, on behalf of the parent organizations PPARC in the United Kingdom, the National Research Council of Canada and The Netherlands Organization for Scientific Research. (JCMT) on 2002 December 12 under excellent weather conditions. Typical opacities at 225 GHz were 0.04–0.06. We obtained photometry of four systems: LkH 262, the triple LkH 263 (ABC), LkH 264 (A), and the triple S18 (ABab); Table 1 lists coordinates and observing details. The employed two-bolometer photometry technique allowed for increased observing efficiency, with a chop throw of in Naysmith coordinates. Individual integrations of 30 s were repeated for the totals listed in the table. To confirm the unresolved nature of the emission we obtained a 64-point jiggle map centered on LkH 262 also containing LkH 263 (ABC). While providing spatial information, the jiggle map is less sensitive than the single-point photometry data.
The standards HL Tau, CRL 618, and Uranus provided focus checks and flux calibrations; the nearby quasar 0235+164 served as pointing source every hours. Pointing accuracy was good with excursions of less than a few arcsec. However, uncorrected pointing errors can still affect the photometry in the beam at 450 m. In spite of a dither included in the photometry, 450 m fluxes of LkH 262 from photometry are lower by 60% than those from the jiggle map (§3). We conclude that uncorrected pointing offsets and calibration uncertainties at short wavelengths due to the imperfect beam shape of the JCMT resulted in 450 m photometry results that are strict lower limits to the actual source flux. We include a +60% error in the uncertainty of the reported 450 m results. The 850 m photometry and the jiggle maps are unaffected.
3 Results
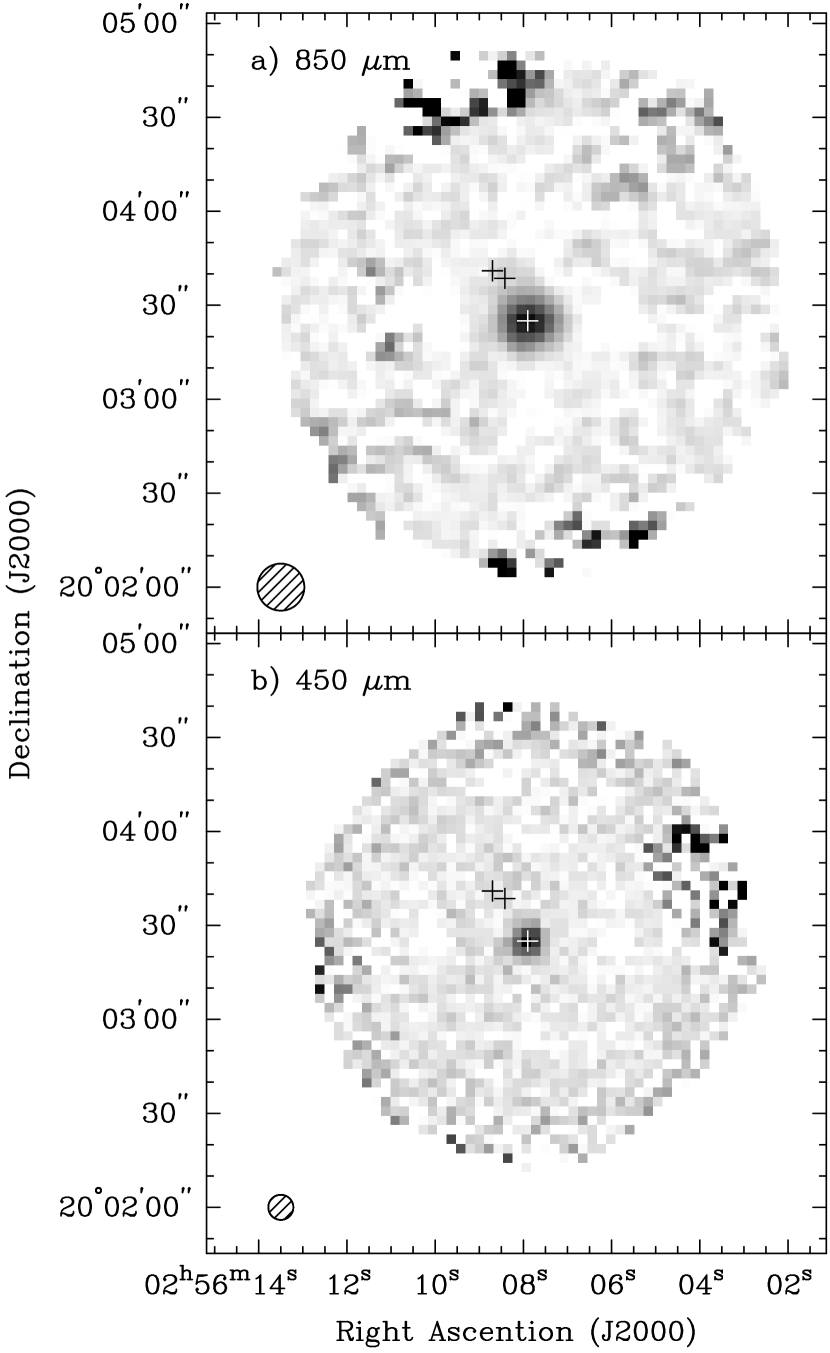
All four objects, containing a total of eight (known) stars, show emission at 850 and 450 m (Table 2). The jiggle map (Fig. Indications for grain growth and mass decrease in cold dust disks around Classical T Tauri stars in the MBM 12 young association) indicates that the emission is unresolved and confined to the source position, and is not structure in the cloud. Because of the higher noise level, only LkH 262 is detected in Fig. Indications for grain growth and mass decrease in cold dust disks around Classical T Tauri stars in the MBM 12 young association while LkH 263 (ABC) remain undetected. The separation of between LkH 262 and 263 (ABC) is large enough that –2 mJy spill over at both wavelengths is expected, based on archival beam profiles.
High signal-to-noise photometry and jiggle-map data of LkH 262 are consistent at 850 m but discrepant at 450 m with respective fluxes of 166.2 mJy and 263.1 mJy. Uncorrected pointing and calibration errors at 450 m are likely to blame (§2); the jiggle-map flux is extracted after Gaussian profile fitting and does not suffer from pointing offsets. The reconcile the measurements, we include a +60% error bar in Table 2 and stress that the 450 m photometry values are strict lower limits. The 850–450 m spectral indices consequently contain a large uncertainty (Table 2). At their high end, corresponding to the high end of allowed 450 m fluxes, the indices (1.5–2.5) are consistent with emission from cool ( K) and coagulated dust grains. The spectral index , where the index of the dust emissivity decreases when grains coagulate (e.g., Ossenkopf & Henning 1994; Pollack et al. 1994) and where the slope of the Planck function falls below the value of 2.0 outside the Rayleigh-Jeans limit when K at 450 m.
4 Disk models and masses
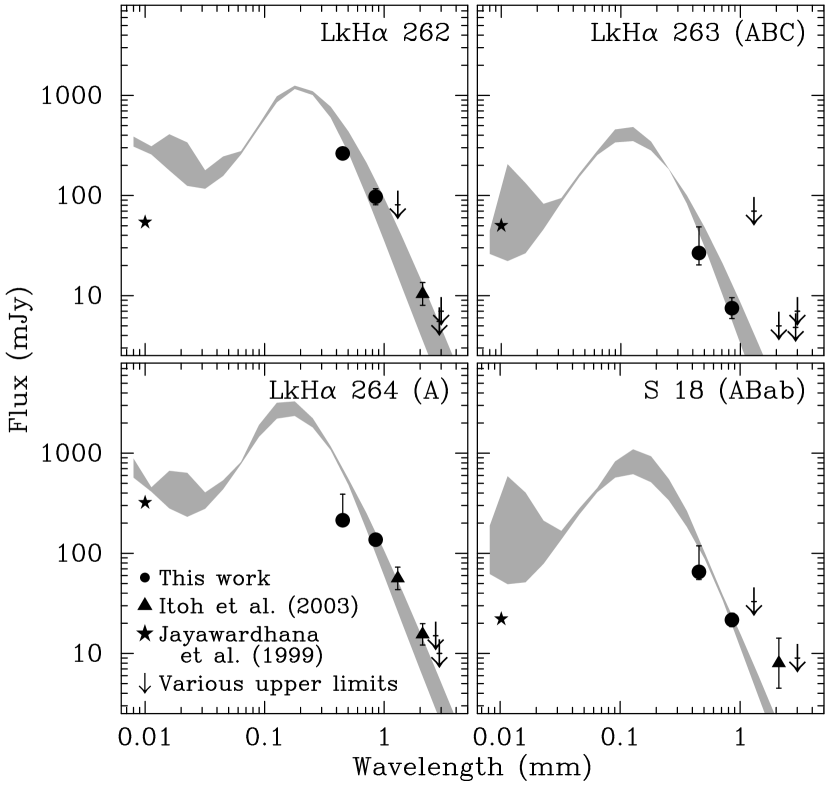
Fig. Indications for grain growth and mass decrease in cold dust disks around Classical T Tauri stars in the MBM 12 young association plots our data and values from Pound (1996), Hogerheijde et al. (2002), and Itoh et al. (2003); the +60% error bars to the 450 m photometry are explicitly included. From these SEDs we can infer the mass of cold material. The 850 m fluxes trace the absolute amount of material, while the SEDs help to constrain important model parameters. We choose the flared-disk model of Chiang & Goldreich (1997) to describe the disks. We use the disk mass as our only free parameter. The disk temperature distribution is fixed by scaling to the stellar luminosity , where L⊙ (Chiang & Goldreich, 1997). Source luminosities are from Luhman (2001). We neglect any changes in disk structure due to changes in mass and temperature. Following recent reassessments of the distance to MBM 12 (Luhman, 2001; Andersson et al., 2002) we adopt pc. We assume an average inclination of . Because most of the flux comes from optically thin regions, only near edge-on orientations would change our results significantly.
The final model parameter is the dust emissivity : its absolute value and its variation with wavelength. Often, is parameterized as with cm2 g-1 (dust) and Hz (Hildebrand, 1983). From disk SED fitting, low values of are commonly found, 0–1 (Beckwith & Sargent, 1991) and interpreted as evidence for grain growth; Beckwith et al. (2000) point out that grain mineralogy can affect and explain the low values. More accurate descriptions of follow from calculations of grain growth in astrophysical environments employing realistic mineralogies (e.g., Ossenkopf & Henning 1994; Pollack et al. 1994; Beckwith et al. 2000). These models circumvent having to choose a value for , but still show show significant variation. We adopt a dual approach: we fit the SEDs with a parameterized to constrain and learn about possible grain growth, and then fit the SEDs with several physical grain-growth models to derive accurate disk masses with realistic uncertainties.
With , minimization of the SED fit yields for LkH 262 and for LkH 264; the error bars for LkH 263 and S18 are too large to constrain . For this fit we have used all detections and upper limits at wavelengths m. At the wavelengths of the infrared N-band and shorter, the flux is dominated by very small amounts of hot material and may contain contributions from silicate emission; both depend strongly on the model parameters. This does not affect our results: % of the 450 m flux originates from the AU region that contributes % of the 10 m emission. The inferred values and are similar to those commonly found in T Tauri disks, and we interpret them as indications for grain growth in the MBM 12 disks.
Few of the grain-growth models of Ossenkopf & Henning (1994) and Pollack et al. (1994) have . Of the models by Ossenkopf & Henning, only strongly coagulated grains without ice mantles show such low . The authors note that such grains are unlikely in disk environments and we follow their advice and avoid this particular class. Of the models by Pollack et al., is only found for average grain sizes cm. Table 2 lists the range of disk masses found by minimization. These vary from 0.0014-0.012 M⊙ for LkH 263 to 0.023–0.23 M⊙ for LkH 262. The allowed range for each source reflects the uncertainty in the dust opacity models. These these ranges overlap, but differences in disk mass between sources are robust if we assume similar dust properties in all objects.
Our modeling makes no assumptions about the opacity. We find that % of the 450 m flux and % at 1.3 mm originates from opaque regions (. Only much smaller disks ( AU) have % of the 450 m flux coming from optically thick regions (45% at 1.3 mm). For such disks the SED slope can be explained by opacity instead of grain growth, and submillimeter fluxes no longer trace mass. Only spatially resolved data can settle this issue.
Jayawardhana et al. (2002) infer 0.0018 M⊙ for LkH 263 C from modeling the scattered light, depending on the assumed dust properties. Our values of 0.0014–0.012 M⊙ are consistent with their findings. An unknown fraction of our inferred mass may reside in disks around the companions A and B. Spatially resolved data and detailed modeling are required to further characterize the disk of LkH 263 C.
13CO 2–1 measurements (Hogerheijde et al., 2002) indicate that CO is depleted with respect to the dark cloud value of CO/H2= by factors up to 300. Large depletion levels are found in disks around T Tauri stars (e.g., Dutrey et al. 1994, 1996) and expected theoretically (e.g., Aikawa & Herbst 1999; Willacy & Langer 2000).
5 Nature or nurture
Although our sample is small, with only eight stars in four unresolved systems, interesting conclusions can be reached about the disk evolution. Our detections show that at least the Classical T Tauri stars in MBM 12 (1–5 Myr) have disks in the same mass range as the younger ( Myr) Taurus and Ophiuchus regions (0.001–0.3 M⊙; Beckwith & Sargent 1996). While Carpenter (2002) shows that 0/95 stars in IC 348 ( Myr) have disk masses M⊙, two out of four of our MBM 12 systems do (or % of all twelve MBM 12 systems); in Taurus, a comparable fraction of 14% of stars have disks M⊙. Luhman (2001) argues that the K- and L-band excess suggest significant disk dispersal in MBM 12. Our sample does not directly address this issue because 3/4 objects have K-band excess (S18 does not).
Jensen et al. (1996) showed that binaries with separations –100 AU have reduced disk mass or no disks, compared to wider binaries and single stars. Our data follow that trend, taking into account that the relative disk masses are robust (§4): LkH 262: AU and 0.023–0.23 M⊙; LkH 264 A: AU and 0.03–0.18 M⊙; S18 ABab: AU (A–B), AU (Ba–Bb) and 0.005–0.025 M⊙; and LkH 263 ABC: AU (AB–C), AU (A–B) and 0.0014–0.012 M⊙ (binary separations from Jayawardhana et al. 2002, Chauvin et al. 2002 and Brandeker et al. 2003). This suggests that the presence of a close binary (environment) determines the total amount of disk material.
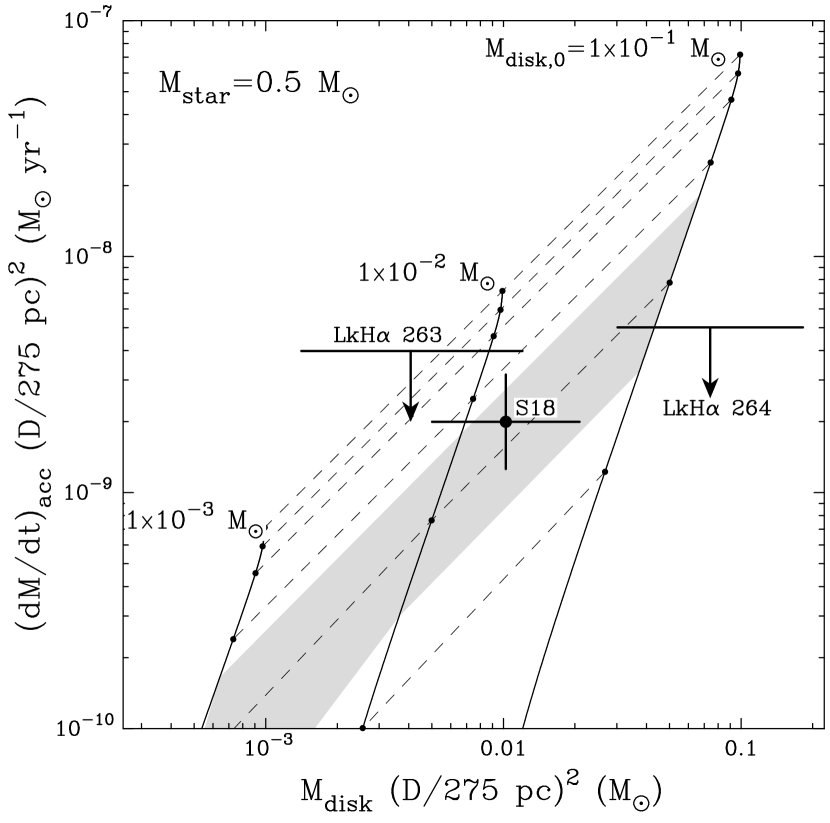
If environment determines (initial) disk mass, can we still infer anything about disk dispersal from the amount of material? In a viscouly evolving disk, disk mass and the accretion rate onto the central star are linked (Clarke et al., 2001; Matsuyama et al., 2003a). Fig. Indications for grain growth and mass decrease in cold dust disks around Classical T Tauri stars in the MBM 12 young association plots ‘evolutionary tracks’ of disks with initial masses of 0.001, 0.01, and 0.1 M⊙ around a 0.5 M⊙ star, following Matsuyama et al. (2003a). This model assumes a standard -disk description with , a central star with M⊙ and R⊙, and a constant ionizing flux from the star with time-dependent contribution from accretion. The disk removal rate only depends weakly on the stellar parameters, and any uncertainties are insignificant compared to our observational error bars.
Muzerolle et al. (in prep.) report estimates of mass accretion rates onto three of our objects from Br line measurements, using the calibration of Muzerolle et al. (1998). They find upper limits of (4–5) M⊙ yr-1 for LkH 263 and 264, and a rate of M⊙ yr-1 for S18. These rates are comparable to those inferred for IC 348 (Liu et al., 2003) and at the low end of the range found in Taurus, which has a median of M⊙ yr-1. The errors include uncertainties in the observations and the stellar mass, assumed to be 0.5 M⊙, but not the distance. Because both accretion rate and disk mass depend on the distance squared, its uncertainty does not enter into the values of Fig. Indications for grain growth and mass decrease in cold dust disks around Classical T Tauri stars in the MBM 12 young association; also depends on , which we assume constant.
The disk mass and accretion rate of S18 are consistent with the dispersal model for the age range of MBM 12 (1–5 Myr; shaded in Fig. Indications for grain growth and mass decrease in cold dust disks around Classical T Tauri stars in the MBM 12 young association), suggesting that the object has lost one-third of its initial disk mass of M⊙. The upper limit on the accretion rate of LkH 264 also agrees with the model at 1–5 Myr. The agreement improves if the disk mass is decreased somewhat, which is expected when dust grains have indeed grown to a few hundred m as suggested by the SED. Grain sizes comparable to observing wavelength are efficient emitters, reducing the required mass to fit the observed flux. The limits on LkH 263 do not provide useful constraints.
In summary, we conclude that the Classical T Tauri stars in MBM 12 still have significant reservoirs of cold dust in circumstellar disk. There are indications for grain growth up to several hundred m in these disks, but spatially resolved observations are required to rule out opacity as an explanation for the flat spectral slopes. And while differences in disk mass are likely dominated by environment (binary separation; ‘nature’), available accretion rates and detected disk masses are consistent with a disk dispersal scenario (‘nurture’) with one-third of the mass already lost.
References
- Aikawa & Herbst (1999) Aikawa, Y. & Herbst, E. 1999, A&A, 351, 233
- Andersson et al. (2002) Andersson, B.-G., Idzi, R., Uomoto, A., Wannier, P. G., Chen, B., & Jorgensen, A. M. 2002, AJ, 124, 2164
- Armitage et al. (2003) Armitage, P. J., Clarke, C. J., & Palla, F. 2003, MNRAS, in press
- Beckwith et al. (2000) Beckwith, S. V. W., Henning, T., & Nakagawa, Y. 2000, Protostars and Planets IV, 533
- Beckwith & Sargent (1991) Beckwith, S. V. W. & Sargent, A. I. 1991, ApJ, 381, 250
- Beckwith & Sargent (1996) —. 1996, Nature, 383, 139
- Brandeker et al. (2003) Brandeker, A., Jayawardhana, R., & Najita, J. 2003, AJ, submitted
- Carpenter (2002) Carpenter, J. M. 2002, AJ, 124, 1593
- Chauvin et al. (2002) Chauvin, G., Ménard, F., Fusco, T., Lagrange, A.-M., Beuzit, J.-L., Mouillet, D., & Augereau, J.-C. 2002, A&A, 394, 949
- Chiang & Goldreich (1997) Chiang, E. I. & Goldreich, P. 1997, ApJ, 490, 368
- Clarke et al. (2001) Clarke, C. J., Gendrin, A., & Sotomayor, M. 2001, MNRAS, 328, 485
- Dutrey et al. (1996) Dutrey, A., Guilloteau, S., Duvert, G., Prato, L., Simon, M., Schuster, K., & Ménard, F. 1996, A&A, 309, 493
- Dutrey et al. (1994) Dutrey, A., Guilloteau, S., & Simon, M. 1994, A&A, 286, 149
- Duvert et al. (2000) Duvert, G., Guilloteau, S., Ménard, F., Simon, M., & Dutrey, A. 2000, A&A, 355, 165
- Haisch et al. (2001) Haisch, K. E., Lada, E. A., & Lada, C. J. 2001, ApJ, 553, L153
- Hartmann (2001) Hartmann, L. 2001, AJ, 121, 1030
- Hildebrand (1983) Hildebrand, R. H. 1983, QJRAS, 24, 267
- Hogerheijde et al. (2002) Hogerheijde, M. R., Jayawardhana, R., Johnstone, D., Blake, G. A., & Kessler, J. E. 2002, AJ, 124, 3387
- Holland et al. (1999) Holland, W. S., Robson, E. I., Gear, W. K., Cunningham, C. R., Lightfoot, J. F., Jenness, T., Ivison, R. J., Stevens, J. A., Ade, P. A. R., Griffin, M. J., Duncan, W. D., Murphy, J. A., & Naylor, D. A. 1999, MNRAS, 303, 659
- Itoh et al. (2003) Itoh, Y., Sugitani, K., Fukuda, N., Nakanishi, K., Ogura, K., Tamura, M., Marui, K., Fujita, K., Oasa, Y., & Fukagawa, M. 2003, ApJ, 586, L141
- Jayawardhana et al. (1999) Jayawardhana, R., Hartmann, L., Fazio, G., Fisher, R. S., Telesco, C. M., & Piña, R. K. 1999, ApJ, 521, L129
- Jayawardhana et al. (2002) Jayawardhana, R., Luhman, K. L., D’Alessio, P., & Stauffer, J. R. 2002, ApJ, 571, L51
- Jayawardhana et al. (2001) Jayawardhana, R., Wolk, S. J., Barrado y Navascués, D., Telesco, C. M., & Hearty, T. J. 2001, ApJ, 550, L197
- Jensen et al. (1996) Jensen, E. L. N., Mathieu, R. D., & Fuller, G. A. 1996, ApJ, 458, 312
- Liu et al. (2003) Liu, M. C., Najita, J., & Tokunaga, A. T. 2003, ApJ, 585, 372
- Luhman (2001) Luhman, K. L. 2001, ApJ, 560, 287
- Matsuyama et al. (2003a) Matsuyama, I., Johnstone, D., & Hartmann, L. 2003a, ApJ, 582, 893
- Matsuyama et al. (2003b) Matsuyama, I., Johnstone, D., & Murray, N. 2003b, ApJ, 585, L143
- Muzerolle et al. (1998) Muzerolle, J., Hartmann, L., & Calvet, N. 1998, AJ, 116, 2965
- Ossenkopf & Henning (1994) Ossenkopf, V. & Henning, T. 1994, A&A, 291, 943
- Pollack et al. (1994) Pollack, J. B., Hollenbach, D., Beckwith, S. V. W., Simonelli, D. P., Roush, T., & Fong, W. 1994, ApJ, 421, 615
- Pound (1996) Pound, M. W. 1996, ApJ, 457, L35
- Robberto et al. (2000) Robberto, M., Beckwith, S. V. W., & Herbst, T. M. 2000, in Star Formation 1999, ed. T. Nakamoto (Nobeyama: Nobeyama Radio Observatory), 231
- Willacy & Langer (2000) Willacy, K. & Langer, W. D. 2000, ApJ, 544, 903
Jiggle maps at (a) 850 m and (b) 450 m containing four (known) young stars indicated by symbols: LkH 263 C, LkH 263 A+B, and LkH 262 (left to right). The emission around LkH 262 is unresolved. Emission from LkH 263 ABC is undetected at the noise level of 7 mJy beam-1 (850 m) and 22 mJy beam-1 (450 m).
Spectral energy distributions (SEDs) of the four sources detected with SCUBA. Filled symbols are SCUBA data, open symbols data from Itoh et al. (2003), star symbols show N-band excess (Jayawardhana et al., 2002), and upper limits are from Pound (1996), Hogerheijde et al. (2002), and Itoh et al. (2003). The broad shaded curves show the model SEDs and their uncertainty due to variations in adopted dust emissivities. Emission at m originates from small amount of warm dust and is highly model dependent.
‘Evolutionary tracks’ of viscous accretion disks from Matsuyama et al. (2003a) (solid curves), for a stellar mass of 0.5 M⊙ and initial disk masses of 0.1, 0.01, and 0.001 M⊙. Dashed lines are isochrones at , , , … yr. At these ages, the disks are reduced to 99%, 97%, 91%, 75%, 50%, and 27% of their initial mass. The shaded area is the inferred age range of 1–5 Myr of MBM 12. Upper limits are values.
| (2000) | (2000) | Observing | Integration | |
|---|---|---|---|---|
| Source | (h m s) | (∘ ′ ′′) | Mode | Time (s) |
| LkH262 | 02 56 07.9 | 20 03 25 | photom | 1200 |
| jiggle | 4800 | |||
| LkH263 ABCaaCentered on LkH263 C, from AB. | 02 56 08.7 | 20 03 41 | photom | 4800 |
| LkH264 A | 02 56 37.5 | 20 05 38 | photom | 1200 |
| S18 ABab | 03 02 21.1 | 17 10 35 | photom | 1200 |
| F(850 m) | F(450 m) | Spectral | Disk Mass | |
|---|---|---|---|---|
| Source | (mJy) | (mJy) | Index | ( M⊙) |
| LkH 262 (photom) | 0.67–1.64 | 0.023–0.23aaThe lower mass limits corresponds to dust opacities from Ossenkopf & Henning (1994) with ice mantles and yr of grain growth; the upper mass limits to opacities from Pollack et al. (1994) with grain sizes cm. | ||
| LkH 262 (jiggle) | 1.35–1.84 | |||
| LkH 263ABC | 1.16–3.17 | 0.0014–0.012aaThe lower mass limits corresponds to dust opacities from Ossenkopf & Henning (1994) with ice mantles and yr of grain growth; the upper mass limits to opacities from Pollack et al. (1994) with grain sizes cm. | ||
| LkH 264A | 0.58–1.48 | 0.03–0.18aaThe lower mass limits corresponds to dust opacities from Ossenkopf & Henning (1994) with ice mantles and yr of grain growth; the upper mass limits to opacities from Pollack et al. (1994) with grain sizes cm. | ||
| S18 ABab | 1.20–2.74 | 0.005–0.025aaThe lower mass limits corresponds to dust opacities from Ossenkopf & Henning (1994) with ice mantles and yr of grain growth; the upper mass limits to opacities from Pollack et al. (1994) with grain sizes cm. |