The tidal perturbation of the low-mass globular cluster NGC 5466
Abstract
The distribution of stars in the outer part of the sparse globular cluster NGC 5466 provides evidence for possible tidal mass loss after a recent disk-shock near the solar circle.
MPI für Astronomie, Königstuhl 17, D-69117 Heidelberg, Germany
1. Introduction
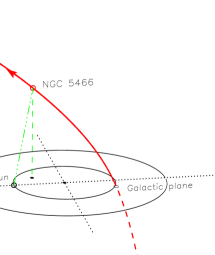
NGC 5466 is a metal-poor halo cluster located at kpc from the
Sun (Cassisi et al. 2001) and kpc above the Galactic plane
(see Fig.1). It is one of the less luminous clusters in the globular cluster
system of our Galaxy.
It has a low central velocity dispersion of only 1.5 km s-1 (Pryor
& Meylan 1993) and a relatively large core radius ( pc, Lehmann
& Scholz 1997). This implies a dynamical mass of about (Pryor et al. 1991).
The internal properties of NGC 5466 are thus similar to - though less
extreme than - those of the low-mass halo cluster Palomar 5, which was
recently found to have long tails of tidal debris (Odenkirchen et al. 2001,
2003) that reveal ongoing tidal disruption.
Existing measurements of the proper motion of NGC 5466
(see Odenkirchen et al. 1997) allow us to assess its local Galactic orbit.
We took the available kinematic data for NGC 5466 and a model of the Galactic
potential developed by Allen & Santillan (1991) and integrated the equations
of motion to Myr from present. The resulting orbit is plotted
in Fig.1. It demonstrates that NGC 5466 is on a highly eccentric orbit with
kpc, but has crossed the Galactic disk about 50 Myr ago at a
distance of about 8 kpc from the Galactic center.
This suggests that NGC 5466 has recently undergone a tidal shock, which -
due to the low mass and low concentration of this cluster - might
lead to a significant loss of stars.
2. Analysis of APM data
We analysed the spatial distribution of stars in the outer parts of NGC 5466
using data from the APM catalogue111data available at
www.ast.cam.ac.uk/~apmcat/. This catalogue is based on
scans of the first Palomar Sky Survey (POSS-I) O and E plates.
We extracted a field centered on the cluster and
selected all sources classified as “starlike”.
To weed out stars that are most likely not associated with the cluster we
restricted the sample to the color-magnitude box defined by and .
This selects stars on the upper main sequence and near the main-sequence
turn-off of NGC 5466. Since the photometry obtained from the POSS-I plates
is of moderate accuracy, the selection necessarily is rather coarse.
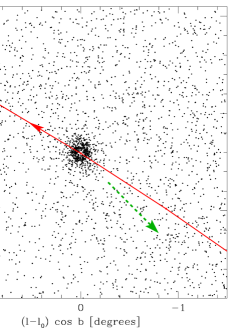
Fig.2 shows the distribution of the selected cluster member candidates on
the sky. While the inner part of the cluster appears spherical, there is
a stellar halo around it, which has a non-spherical shape.
This halo appears elongated towards the south-west and the north-east, i.e.,
stars are seen preferentially near the directions towards the Galactic center
(see dashed line in Fig.1) and anticenter. The orientation of this cluster
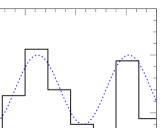
halo is further analysed in Fig.3, where we plot star counts in the range
as a function of position angle. The position angle
of the major-axis of the cluster’s halo is about +30 ∘while the position
angle of the Galactic center-anticenter line is +43 ∘.
This provides first evidence for a possible tidal perturbation of the cluster
and eventual mass loss because the Galactic tidal field will drag
stars away from the cluster along the center-anticenter line (see, e.g., the
example of Pal 5 in Odenkirchen et al. 2003).
However, the APM data do not allow to trace cluster members to more than
from the center of NGC 5466. Thus deeper and more accurate photometry
is needed to explore the distribution of cluster stars in more detail.
3. Comparison to simulated tidal debris
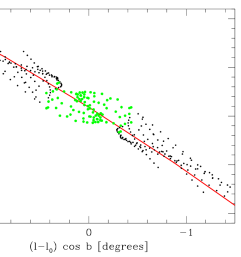
Fig.4 shows a prediction of the spread of tidal debris from NGC 5466. We simulated tidal mass loss from the cluster by releasing particles from the Lagrange points located on the Galactic centre - anticenter line in time steps of 10 Myr. The particles were assumed to have peculiar velocities of size 1.5 km s-1 (equal to the measured velocity dispersion of the cluster). The dots show the present location of particles released Myrs ago. Stars lost during the last 50 Myrs, i.e., after the cluster’s recent disk crossing, are highlighted as fat dots. The distribution of the fat dots is similar to the observed halo of cluster member candidates around NGC 5466. The orientation of the observed halo is compatible with a transition from the center-anticenter line towards alignment with the cluster’s orbit. Deeper and cleaner data might allow to resolve the sharp bending near the Lagrange points suggested by the simulation.
References
Allen C., & Santillan A. 1991, Rev. Mex. Astron. Astrofis., 22, 255
Cassisi S., De Santis R., & Piersimoni A. M. 2001, MNRAS, 326, 342
Lehmann I., & Scholz R.D. 1997, A&A320, 776
Odenkirchen M., Brosche P., Geffert M., & Tucholke H.-J. 1997, NewA 2, 477
Odenkirchen M., Grebel E.K., Rockosi C.M., et al. 2001, ApJ, 548, L165
Odenkirchen M., Grebel E.K., Dehnen W., Rix H.W., et al. 2003, AJ, accepted
Pryor C., Mc Clure R.D., Fletcher J.M., & Hesser J.E. 1991, AJ, 102, 1026
Pryor C., & Meylan G. 1993, in ASP Conf. Ser. Vol. 50, Structure and Dynamics of Globular Clusters, eds. S.G. Djorgovski & G. Meylan, p.357