The spectrum of the roAp star HD 101065 (Przybylski’s star) in the Li I 6708 Å spectral region ††thanks: Based on observations collected at the European Southern Observatory, La Silla, Chile (programme 56.E-0640).
We carried out a detailed analysis of spectra of the unique roAp star HD 101065 (Przybylski’s star) near the resonance doublet Li I 6708 Å, using a most complete line list including all possible transitions between REE levels of NIST database. Our model calculations were performed under two assumptions: blend of Li and REE lines, and blend of REE lines only. They prove that Li lines are present in the range Å and that the resulting Li abundance is 3.1 dex (in the scale N(H) = 12.0), while the isotopic ratio is near to 0.3.
Key Words.:
stars – chemically peculiar – individual: HD 1010651 Introduction
Among the rapidly oscillating Ap (roAp hereafter) stars, HD 101065 is the most unusual (Przybylski Prz61 (1961), Prz66 (1966)). The report of Przybylski in 1976 at the IAU Symposium No 32, showing the very specific properties of the spectrum of HD 101065, made a very strong impression on specialists of Ap stars and at once attracted much attention to this star. Significant difference between the spectrum of this star and the spectra of other Ap stars were pointed out by Przybylski : first, the absence or extreme weakness of lines of elements that appear generally normal or close to normal in other Ap stars, like iron and some other iron group elements, then the abnormal strengthening of Rare Earth Elements (REE hereafter) lines. Przybylski predicted the presence of a magnetic field for this star. He proposed to explain the observed anomalies of elemental abundances by the stability of the upper atmosphere due a strong magnetic field, which would favour radiative diffusion. Wolff and Hagen (Wolff76 (1976)) did find a magnetic field of about 2.5 KG in this mysterious star. Kurtz and Wegner (Kurtz79 (1979)) began photometric observations of HD 101065 in the seventies and detected well-defined pulsations with a peak-to-peak amplitude of about 0.012 mag and a period of 12.14 minutes.
It was the first Ap star in which pulsations were found. Now this phenomenon is known to be typical of other Ap stars, which form the group of roAp stars. The first attempts to identify the lines in the spectrum of HD 101065 were made by Przybylski (Prz61 (1961), Prz66 (1966)), and Warner (Warner66 (1966)). These papers mention for the first time the possible presence of the resonance lithium doublet. In the subsequent study of this star, Wegner and Petford (Wegner74 (1974)) have proposed that it is the coolest of Ap stars. They considered the very strange spectrum to be the combined result of low temperature and high surface REE abundances (the abundance excess is about 4 dex). Beginning with Przybylski, investigators suggested that heavy line blanketing changes the atmosphere structure very strongly, and that the computation of a realistic model atmosphere for this star is complicated by the necessity to take REE lines blanketing into account. Cowley at al. (Cow98 (1998), Cow00 (2000)) examined in detail the problem of effective temperature to define the model atmosphere of HD 101065, and have carried out a thorough quantitative analysis (abundances of 54 elements) of the spectrum in the range 3959-6652 Å. Cowley and Mathys (Cow98 (1998)) have noted in their conclusion that the presence of the third spectrum REE (Pr III, Nd III, Ce III…) is evidence for the unusual structure of the atmosphere of this star, which includes a very thin surface convective zone typical of stars of spectral type F2. One possible explanation of these extreme abundance anomalies is radiative diffusion, allowed by the stabilization of the atmosphere by a strong magnetic field. Cowley et al. (Cow98 (1998), Cow00 (2000)) did not address the question of the lithium abundance in the atmosphere of this star. The present work is a further investigation of the spectrum of HD 101065 in the region 6675-6735 Å; the main goal is the analysis of the lithium blend 6708 Å and estimation of the atmospheric lithium abundance.
The very complicated spectral feature at 6708 Å in the observed spectra raises the problem of correct line identification, especially REE lines, in this region. A comprehensive analysis of REE lines with latest atomic data was performed, and we show that the resonance doublet of lithium is the main contributor to the 6708 Å feature.
2 Lithium in the spectrum HD 101065
The presence of lithium in the spectrum of this unique star was first mentioned by Przybylski (Prz61 (1961)), and this remark was noticed by Warner (Warner66 (1966)), who made additional observations of this star in Radcliffe Observatory, using the 74” reflector, in the spectral range 3770 – 6880 Å (dispersion 6 Å/mm). He found very strong lines of singly ionized REE in the region 5500 – 6880 Å, the relative intensities of which are similar to laboratory intensities from the tables of Meggers et al. (Meggers (1961)). However, as mentioned by Przybylski (Prz66 (1966)),the line Sm II 6707.45 Å can be considered only as part of the lithium blend, and the main contribution to this blend remains the resonant lithium doublet Li I 6708 Å. The first estimation of the lithium abundance relative to the solar value was made by Warner (Warner66 (1966)): [Li] = 2.4 dex. This author also mentioned the probable presence of .
3 Observations and reduction
The observations were made by one of us (PN) with the 1.4m CAT at ESO La Silla in March 1996, in the framework of the International Project “Lithium in magnetic CP stars”. The Coudé Échelle Spectrograph was used with resolving power and S/N 100. The usual data reduction (bias and dark subtraction, division by flat-field, extraction and wavelength calibration) was done by PN during the observing run, using the old IHAP system of ESO (see North et al. North98 (1998) for more details). In Table 1 we give the epoch, exposure time and wavelength coverage of our observations.
| Date | UT | Exp. | HJD | Range | |
|---|---|---|---|---|---|
| # | d.m.y | h m | [m] | 2450000+ | |
| 04 | 11.3.96 | 5 11 | 20 | 153.726 | 6675–6735 Å |
| 26 | 10.3.96 | 4 41 | 20 | 152.705 | 6120–6180 Å |
4 Model Atmosphere
We have computed a model atmosphere with K, and abundances of most (54) elements from Cowley et al. (Cow00 (2000)). The other element abundances were adopted from Kurucz (Kurucz99 (1999)). A detailed discussion of model atmosphere parameters for HD 101065 can be found in the above mentioned paper, as well as in the paper by Piskunov and Kupka (PK01 (2001)).
The most recent method for determining fundamental stellar parameters through pulsation analysis was applied by Matthews et al. (Matthews99 (1999)) to some roAp stars, including HD 101065. But it needs a photometric calibration. calibration results in K, which is too high, as confirmed by detailed spectral analysis (see Cowley et al. Cow00 (2000)). We used the SAM12 program (see Pavlenko 2003a , 2003b ), a modified version of Kurucz’s code ATLAS12 (Kurucz Kurucz99 (1999)). The essential changes were made in the subroutines accounting for opacities. Namely, the opacity caused by absorption of atomic lines was taken into account with the Opacity Sampling (OS) technique (Sneden et al. Sneden76 (1976)). Then, bound-free absorption cross-section of C I, N I and O I atoms in the wide spectral region 30-8880 nm were calculated by us, Pavlenko & Zhukovskaya Pav02 (2003), using the data of the TOPBASE project (Seaton Seaton92 (1992)). New opacity tables of the bound-free absorption of C I, N I, O I atoms, reduced to the format of Hofsaess (Hof79 (1979)) opacity tables, are available on the web site of Ya.P.(2003c ). The importance of bf absorption for formation of spectra of different stars are discussed elsewhere (Pavlenko Pav99 (1999); 2003a , Asplund et al. Asp2000 (2000)).
The basic advantage of the SAM12 code is the possibility to calculate model atmospheres for stars with chemical composition different from the solar one, as well as in ATLAS12. Abundances of elements were set as input data which do not change with depth. The microturbulence velocity was set constant with depth.
The profile of the line absorption coefficient was defined by a Voigt function ; the damping constants were taken from line databases or calculated within the frame of the Unsöld approximation (Unsöld Unsold55 (1955)). The list of absorption lines of atoms and ions for the range nm was compiled using the VALD database (Kupka et al. vald (1999)); the REE lines data, calculated with Cowan’s code (Quinet et al. Qui99 (1999)), are taken from the DREAM database (http://www.umh.ac.be/astro/dream.shtml ). Unfortunately, this database contains lines of only about one quarter of all rare earth ions. Therefore, in the opacity sampling calculation we consider two samples of REE lines. In the first we calculated the absorption provided by the VALD and DREAM lines. Then, we amplified the absorption of DREAM lines by a factor of 10 (in addition to the VALD lines) to compensate for the incompleteness of the REE line list. The comparison of these two cases shows that REE lines opacity does not affect significantly the temperature distribution in our model atmospheres.
Kurucz’s models with K, (Kurucz Kurucz99 (1999)) and abundances of Cowley et al. (Cow00 (2000)) were also used in calculations of synthetic spectra. We calculated 6750/4.0/[M] = 6750/4.0/0 model with solar abundances, as described previously, and compared them with Kurucz models (Kurucz Kurucz93 (1993)). Comparison of temperature structures and corresponding synthetic spectra shows their similarity. As far as our model atmosphere is rather iron deficient, the increase of opacity due to the REE elements may be compensated by the weakness of iron lines.

Cowley et al. analysed the spectrum of HD 101065 with ATLAS-9 model with Opacity Distribution Function (ODF) tables, calculated by the authors on the basis of scaled solar abundances to fit better the observed color indices, in particular the unusually low c1 index. The model atmosphere for this star was also computed by Piskunov and Kupka (PK01 (2001)), also through ODF method, with a 2.25 dex Fe overabundance and a 2.49 dex Ca excess to simulate unknown opacity in ODF tables. These authors used the abundances of Cowley et al.(Cow00 (2000)) for model computation with these ODF. We have followed this approach for OS method, by computing line opacity due Fe I and Ca I lines with factors for gf- values of 177.8 (2.25 dex) and 308 (2.49 dex) respectively. In Fig. 1 we compare the T-P relation for model atmospheres with and of Kurucz (solar abundance and ) and ours with Cowley’s abundances, calculated in two ways – one OS model, similar to the ODF model of Piskunov & Kupka (SAM12:6750/4.0/0, analogue PK2000), and our two OS model atmospheres for and 6600 K and , with gf(REE) lines enhanced by a factor of 10(SAM12:6750/4.0/0/Cowley 2000, *10 and SAM12:6600/4.2/0/Cowley 2000, *10). In general, the photospheres of models with higher opacities are shifted upwards, into the layers of lower pressure; however, the differences in the T-P relation are rather small.
It is worth noting, that our OS model atmospheres 6750/4.0/0 and 6750/4.0/+1 agree with corresponding Kurucz’s ODF models within 50 K in the line forming regions. Therefore, our OS model atmosphere with “metal rich” opacities should follow the Piskunov & Kupka (PK01 (2001)) ODF model.
To analyze the Li blend, we used an atmosphere model with , . The resulting abundances were compared for this model and for the OS model, which is similar to that of Piskunov & Kupka for the same parameters, both for Cowley’s abundances, and for Kurucz’s model for solar abundances. They are cited and discussed in the next section.
5 Li blend analysis and REE lines contribution to the 6705.75-6708.75 Å spectral region
We calculated the synthetic spectra in the range 6705.75-6708.75 Å with the help of the STARSP ( Tsymbal Tsymb96 (1996)) and ROTATE codes (see Shavrina et al. Shavr00 (2000)), both developed by V. Tsymbal, and of the URAN code (Yushchenko Yu97 (1997)). All cited codes are based on Kurucz’ modules for synthetic spectra ( ”SYNTHE”, Kurucz93 (1993)). The URAN program allows to select the elemental abundances automatically, and applying it to the available spectral ranges (6120-6180, 6675-6735 A), one obtains results which are close to those of Cowley et al.(Cow00 (2000)).
| el | ,Å | E” | source | el | ,Å | E” | source | |||
|---|---|---|---|---|---|---|---|---|---|---|
| *Dy II | 6705.727 | 2.078 | -2.68 | * Gd II | 6707.462 | 3.270 | -1.98 | |||
| Nd II | 6705.891 | 3.269 | -2.70 | Sm II | 6707.473 | 0.930 | -1.48 | VALD | ||
| Yb II | 6705.965 | 5.856 | -3.04 | DREAM | Yb II | 6707.603 | 6.651 | -1.38 | DREAM | |
| Ce II | 6706.051 | 1.840 | -0.95 | DREAM | * Sm II | 6707.648 | 1.746 | -1.27 | ||
| Tm II | 6706.150 | 5.322 | -1.07 | DREAM | Nd II | 6707.755 | 0.170 | -3.55 | DREAM[Quinet] | |
| Tm II | 6706.262 | 3.955 | -2.36 | DREAM | 7Li I | 6707.756 | 0.000 | -0.427 | [Smith et al.] | |
| Ce II | 6706.307 | 3.195 | -2.40 | DREAM | 7Li I | 6707.768 | 0.000 | -0.206 | -”- | |
| Pr III | 6706.492 | 3.104 | -1.28 | *Sm II | 6707.779 | 2.037 | -2.68 | |||
| Pr III | 6706.705 | 0.550 | -1.64 | DREAM | 7Li I | 6707.907 | 0.000 | -0.932 | [Smith et al.] | |
| Nd II | 6706.738 | 2.868 | -2.48 | 7Li I | 6707.908 | 0.000 | -1.161 | -”- | ||
| Sm II | 6706.789 | 1.586 | -2.00 | 7Li I | 6707.919 | 0.000 | -0.712 | -”- | ||
| Sm II | 6706.807 | 1.874 | -1.78 | 6Li I | 6707.920 | 0.000 | -0.478 | -”- | ||
| Tm II | 6706.906 | 4.908 | -2.47 | DREAM | 7Li I | 6707.920 | 0.000 | -0.931 | -”- | |
| Nd II | 6706.922 | 3.211 | -0.88 | 6Li I | 6707.923 | 0.000 | -0.179 | -”- | ||
| Nd II | 6707.015 | 1.490 | -1.88 | Nd II | 6708.030 | 1.522 | -1.13 | DREAM[Quinet] | ||
| Nd II | 6707.033 | 2.222 | -3.68 | 6Li I | 6708.073 | 0.000 | -0.304 | [Smith et al.] | ||
| Ce II | 6707.121 | 1.255 | -3.76 | DREAM | Ce II | 6708.077 | 2.250 | -2.57 | DREAM | |
| Dy II | 6707.153 | 3.292 | -1.27 | *Er II | 6708.088 | 3.155 | -2.58 | |||
| Dy II | 6707.266 | 2.890 | -1.28 | Ce II | 6708.099 | 0.701 | -2.12 | DREAM | ||
| Sm II | 6707.342 | 0.884 | -2.00 | *Nd II | 6708.400 | 3.192 | -2.48 | |||
| Er II | 6707.418 | 3.482 | -1.44 | *Nd II | 6708.458 | 3.536 | -1.08 | |||
| Nd II | 6707.433 | 1.499 | -2.17 | *Nd II | 6708.629 | 0.746 | -4.58 | |||
| Nd II | 6707.453 | 2.880 | -3.18 |
-values were estimated by us from best fitting with observed spectrum.
The line list for spectra calculations was compiled from DREAM database (http://www.umh.ac.be/astro/dream.shtml ) and VALD (Kupka et al. vald (1999)). When there was a choice, the preference was given to values from DREAM. The wavelength and gf-values for lithium lines (7Li and 6Li) were taken from the paper of Smith et al. (Smith98 (1998)). In addition, we have calculated wavelengths of REE lines, singly and doubly ionised, using the data of REE energy levels from the NIST database (nist (2001)) according to selection rules ( = 0, 1) and combining even and odd levels of energy (odd-even or even-odd). All possible transition between REE energy levels of NIST were included in the line list for synthetic spectra calculations. For additional to VALD and DREAM lines which are rather distant from Li lines and do not contribute noticeably to the 6708 Å blend ( see Table 4), -values were matched for better agreement of observed and calculated spectra.
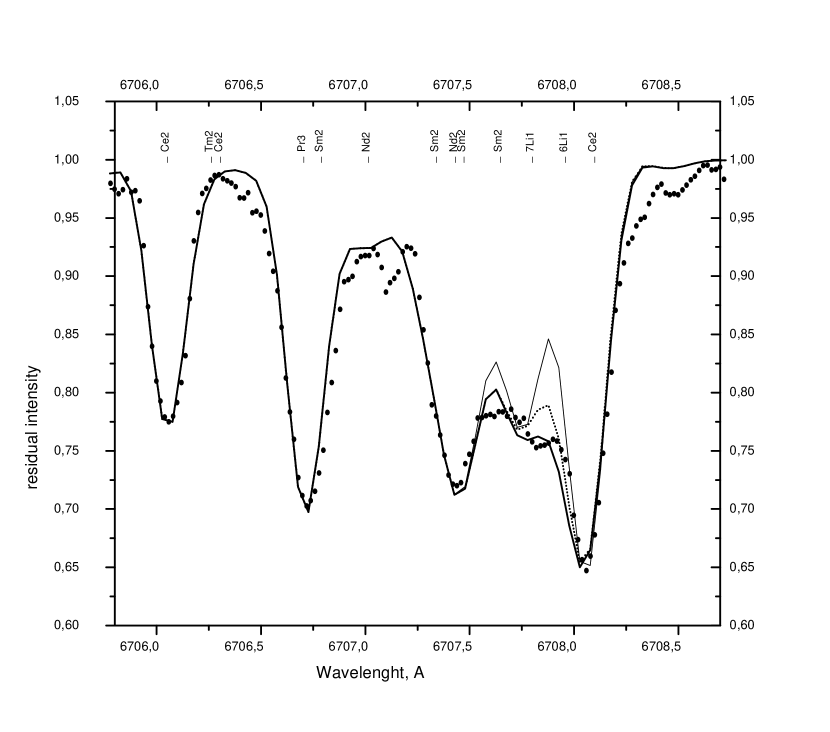
-values for the two lines nearest to the lithium lines (Tables 2, 4), Nd II 6707.755 Å and Nd II 6708.030 Å, were estimated by P. Quinet with Cowan’s code using for the second line the trial identification of the top level, which was unspecified in the NIST list of REE energy levels. This line, Nd II 6708.030 Å forms a blend with the strong line Ce II 6708.099 Å, whose value is contained in the DREAM database. In the region studied, there is a rather pure line Ce II 6706.051 Å . DREAM value of = -0.95 for this line provides Ce abundance N(Ce)= -7.63, which almost coincides with the estimate of Cowley et al. (Cow00 (2000)), N(Ce) = -7.60. This Ce abundance value results in estimate N(Nd) = -7.97 from the line Nd II 6708.030 Å with . This estimate differs from the value of Cowley et al. (Cow00 (2000)) N = -7.65 (0.28) by 0.32 dex, but it only slightly exceeds the error value. Therefore, Quinet’s estimate for the gf value of Nd II 6708.030 seems a reasonable one. However, its blending with the 6Li lines leads to some uncertainty in the estimation of the lithium isotopic ratio. The line of Sm II, 6707.779, almost coincides with the centre of the lithium blend, but unfortunately, the calculations for Sm II are not possible because the energy matrix dimensions exceed the permitted sizes for Cowan’s code. We tried to calculate the blend 6708 Å with Sm II line absorption 6707.779, instead of Li lines, adjusting the value for better agreement with the observed blend. In this way we could estimate an upper limit to for this line, . The resulting fit was bad (see Fig. 2). Only the inclusion of 7Li and 6Li lines (see Table 2) with the ratio allowed us to represent the observed profile of blend rather well (see Fig.2). Our estimate of for Sm II line 6707.779 in this case is equal to -2.68. We should repeat, that our estimate of lithium isotopic ratio is influenced by blending with the Nd II line 6708.030 Å.
Table 2 contains the line list used in model calculations. The wavelengths of lines marked by asterisk were calculated on the basis of NIST energy levels (nist (2001)). Corresponding -values were estimated by us using element abundances from Cowley et al. (Cow00 (2000)), corrected for some REE elements (see Table 3) on the basis of lines with known -values (from DREAM and VALD lists). We used a value of microturbulent velocity Vt = 2 km/s to compensate for magnetic line broadening. This value was selected by us for better agreement of computed and observed line profiles.
In Table 3 we present our results for Kurucz’s and our models with gf(REE)*10 and OS model (PK in the table) which is similar to that of Piskunov and Kupka (PK01 (2001)), and compare them with data of Cowley et al.( Cow00 (2000)) for Vt = 2 km/s. A better agreement was achieved for Ce II on the basis of several Ce II lines with DREAM gf-values, the lithium abundances being almost the same for all models used in this work. We were forced to reduce the Nd II and Sm II abundances taken from Cowley et al. ( Cow00 (2000)) when we fitted the observed line profiles with theoretical ones. These values (see Table 3), based only on one line of each element, 6708.030 Å of Nd II and 6707.473 Å of Sm II, can not be considered as reliable abundance estimates.
We should note that the distinctive feature of this star among other roAp stars is the predominance of numerous strong Ce II lines in the spectrum, which betrays the extreme overabundance of this ion. Not accounting for DREAM line list of Ce II can result in overabundances for some REE and other elements.
| el | 7Li only | = 0.33 | |||
|---|---|---|---|---|---|
| 6600/4.2 | 6600/4.2 | 6750/4.0 | 6600/4.2(PK) | 6600/4.2(Cowley et al.(Cow00 (2000)) | |
| Li I | -8.90 | -8.90 | -8.80 | -8.83 | - |
| Ce II | -7.63 | -7.63 | -7.65 | -7.63 | -7.60+-0.26 |
| Pr III | -7.55 | -7.55 | -7.60 | -7.65 | -7.46+-0.16 |
| Nd II | -7.97 | -8.07 | -7.87 | -8.07 | -7.65+-0.28 |
| Sm II | -8.32 | -8.32 | -8.25 | -8.42 | -7.75+-0.19 |
| ,Å | .60 | .62 | .64 | .66 | .68 | .70 | .72 | .74 | .76 | .78 | .80 | .82 | .84 | .86 | .88 | .90 | .92 | .94 | .96 | .98 | .00 | .02 | .04 | .06 | .08 | .10 | .12 | .14 | .16 | |
|---|---|---|---|---|---|---|---|---|---|---|---|---|---|---|---|---|---|---|---|---|---|---|---|---|---|---|---|---|---|---|
| Sm ii | 6707.648 | 6 | 21 | 20 | 20 | 12 | 6 | 2 | 1 | |||||||||||||||||||||
| Nd ii | 6707.755 | 1 | 1 | 2 | 2 | 1 | 1 | |||||||||||||||||||||||
| 7Li i | 6707.756 | 1 | 2 | 3 | 3 | 4 | 5 | 6 | 7 | 7 | 6 | 6 | 5 | 4 | 2 | 1 | 1 | 1 | ||||||||||||
| 7Li i | 6707.768 | 1 | 3 | 4 | 4 | 5 | 7 | 9 | 11 | 11 | 11 | 10 | 9 | 7 | 4 | 3 | 2 | 2 | 1 | |||||||||||
| 7Li i | 6707.907 | 1 | 1 | 1 | 1 | 2 | 2 | 2 | 2 | 2 | 1 | 1 | 1 | |||||||||||||||||
| 7Li i | 6707.908 | 1 | 1 | 1 | 1 | 1 | 1 | 1 | 1 | 1 | 1 | 1 | ||||||||||||||||||
| 6Li i | 6707.919 | 1 | 1 | 1 | 2 | 2 | 3 | 3 | 3 | 3 | 3 | 3 | 2 | 1 | 1 | |||||||||||||||
| 7Li i | 6707.920 | 1 | 1 | 1 | 1 | 1 | 2 | 2 | 2 | 2 | 2 | 1 | 1 | |||||||||||||||||
| 6Li i | 6707.920 | 1 | 1 | 1 | 1 | 2 | 2 | 2 | 2 | 2 | 2 | 1 | 1 | |||||||||||||||||
| 6Li i | 6707.923 | 1 | 2 | 2 | 2 | 3 | 3 | 3 | 4 | 3 | 3 | 3 | 1 | 1 | 1 | |||||||||||||||
| Nd ii | 6708.029 | 2 | 8 | 26 | 62 | 75 | 71 | 55 | 31 | 12 | 3 | |||||||||||||||||||
| 6Li i | 6708.073 | 1 | 1 | 2 | 2 | 2 | 3 | 3 | 4 | 4 | 3 | 2 | 1 | |||||||||||||||||
| Ce ii | 6708.077 | 1 | 1 | 1 | ||||||||||||||||||||||||||
| Ce ii | 6708.099 | 1 | 3 | 8 | 21 | 37 | 46 | 28 | 13 | 5 |
In Table 4 we show the shares of the main contributors in total absorption (in percent) in each wavelength with a 0.02 Å step, as they are calculated by the STARSP code, for the lithium doublet range Å without instrumental smoothing, for the model atmosphere 6600/4.2 with and = 0.3.
Reyniers et al. (reyn02 (2002)) draw attention to a possible error in Li line identification (instead of Ce II line 6708.03) in the spectra of s-process enriched post-AGB stars. In our high resolution spectra, these two lines are sufficiently far apart to be distinguished, as can be seen in Figure 2 and Table 4.
6 Discussion of the results
Since the discovery of the star HD 101065 by Przybylski, the debates relating to the effective temperature of this star have not settled yet. Apparently, the reason lies in the large blanketing effect due to strong absorption in REE lines, identified and unidentified. Incompleteness of data for these lines does not allow to take into account correctly this effect in model atmosphere calculations. Cowley et al. (Cow00 (2000)) have clearly shown a large excess of REE abundances ( 4 dex ) and deficiency of iron peak elements ( Fe, Ni ), while Co has appeared in excess of 1.5 dex. The list of REE lines in this work included new identified lines in the spectral range bf 3959-6652 Å. Our results include the range 6670 – 6735 Å where lies the remarkable feature with the resonant lithium doublet line 6708 Å.
We have carried out detailed calculations of the blend 6708 Å(6705.75 - 6708.75 Å), using the REE list of atomic data from the DREAM and VALD databases. The evidence for presence of lithium in the spectrum of HD 101065 is most probable, as shown by the excellent fit of synthetic spectra which include the Li lines, while the synthetic spectra without lithium (only REE lines, Sm II 6707.799) clearly fail to achieve a good match. All possible transitions between REE energy levels of NIST were included in the line list for synthetic spectra calculations. The presence of other REE lines near 6708 Å, that would not be included in our list remains improbable. All transitions near 6708 Å are due low energy levels, and low energy REE levels that would not belong to NIST are unlikely. The only line which might mimick the Li lines is Sm II 6707.799 Å . But we showed that absorption in this line is not large enough to account for the observed spectral feature, while a perfect fit is obtained when accounting for the Li line components, which are distributed on a rather wide range (see Tables 2 and 4).
In our work the choice of parameters of synthetic spectrum near the line Li I 6708 Å is described in detail taking into account the REE lines with known and unknown values. The variants of the calculations, with and without lithium lines, are considered, which prove the presence of a lithium doublet 6708 Å in the spectrum of HD 101065 with a lithium abundance of 3.1 dex ( in the scale N(H) = 12.0 ). The observed blend is best represented at the isotopic ratio = 0.3. The latter value can be considered as an upper limit in the current state of atomic data; more accurate estimation of the lithium isotopic ratio would require better spectral resolution and better -values for REE lines.
We carried out the calculations with Zeeman and Paschen-Back splitting of the Li line. For H=2300 G, the Paschen-Back effect is negligible (this is common for magnetic fields lower than 4000 G – see Shavrina et al. Shavr00 (2000)) and can not induce any additional asymmetry. Zeeman broadening is also unimportant, due to the significant separation (0.15 Å) of the components of the Li doublet. On the basis of our spectra calculations in two wider spectral ranges, Å and Å, the value V km/s was adopted, which must compensate for the magnetic broadening of other lines. We have also considered the possible binarity of HD 101065. This problem was discussed by Hubrig et al. (Hubr00 (2000)). They noticed that none of the 14 roAp considered, including HD 101065, is known to be a spectroscopic binary (although several are members of wide visual binary systems); therefore the 6708 Å feature cannot be due to a secondary component of this star .
Warner’s (Warner66 (1966)) estimate of the lithium abundance for this star from a spectrum with 0.3 Å resolution was 2.4 dex relative to the solar value, that is, 3.3 dex relative to hydrogen. He also assumed the presence of 6Li on the surface of the star. The good agreement between our results and those of Warner (Warner66 (1966)) is encouraging. Warner had tried to explain the large excess of rare earth elements and the peculiar structure of the atmosphere by dragging out r-process elements from deeper to surface layers of the star. However, the high lithium content observed, 3.1 dex ( on the scale where ), is not unexpected for normal F stars, which are separated on high and low Li abundances (Chen et al., Chen01 (2001)), while Warner’s assumption would imply complete mixing and, therefore, complete lithium destruction. Thus the radiative diffusion mechanism seems a much more promising explanation, especially as the magnetic field, reaching 2300 G (Cowley et al., Cow00 (2000)), would make it easier. On the other hand, the isotopic ratio Li = 0.3 might be considered as indicating spallation reactions on the stellar surface, though a combination of radiative and ambipolar diffusion might perhaps lead to the same result.
The Hipparcos measurements have confirmed that the star is a dwarf or a subgiant: using its parallax ( mas) and the adopted K, we obtain by interpolation in evolutionary tracks, assuming a normal evolution and a solar global composition. However, its spectrum is reminiscent of S-stars (except for Li !), whose atmospheres are enriched by fresh synthesized material from deep layers. Whether the extreme anomaly of the spectrum of this interesting star is just another case of radiative diffusion, or requires a completely new explanation, remains to be seen.
Acknowledgements.
The data from Kurucz’s CDROM 23, NASA ADC, VALD2, NIST and DREAM, were used and we thank the administrations of these databases, provided access to data through INTERNET.N.S. Polosukhina thanks the Consortium of Physics of the Trieste University for financial support. A.Yushchenko was supported by the grant of Post-Doc Program, Chonbuk National University (2002). We thank our referee, Dr. M. Gerbaldi, for valuable critical comments that have helped us /bf to improve the paper.
References
- (1) Asplund M., Gustafsson B., Lambert D.L., Rao N.K., 2000, A&A, 353, 287
- (2) Bi’emont E., Palmeri P. and Quinet P., D.R.E.A.M. Database on Rare Earth at Mons.Univ., http://www.umh.ac.be/astro/dream.shtml
- (3) Chen Y.Q., Nissen P.E., Benoni T. and Zhao G., 2001, A&A 371, 943
- (4) Cowley C.R. and Mathys G., 1998, A&A 339, 165
- (5) Cowley C.R., Ryabchikova T., Kupka F., Bord J.D., Mathys G., Bidelman W.P.: 2000, MNRAS 317, 299
- (6) Hofsaess D. 1979, Atom.data.Nucl.data Tab.,24, 285
- (7) Hubrig S., Kharchenko N., Mathys G.and North P., 2000, A&A 355, 1031
- (8) Kupka F., Piskunov N.E., Ryabchikova T.A., Stempels H.C., Weiss W.W., 1999, A&AS 138, 119
- (9) Kurtz D., Wegner G., 1979, ApJ 232, 510
- (10) Kurucz R. L., 1993, CD ROM N 1-23, Cambridge, MA: Smithsonian Astrophys. Obs.
- (11) Kurucz R. L., 1970, Smithsonian Astrophys. Obs. Spec. Rept. N 309, 1
- (12) Kurucz R. L., 1999, http://cfaku5.harvard.edu/
- (13) Matthews J.M., Kurtz D.V. and Martinez P., 1999, ApJ 511, 422
- (14) Meggers W. F., Corliss C.H., Seribnez B.F., 1961, Nat. Bur. Stand., Mon.32
- (15) North P., Polosukhina N., Malanushenko V., Hack M., 1998, A&A 333, 644
- (16) Martin W.C., Sugar J., Musgrove A., 2001, Energy Levels Database, http://physics.nist.gov/cgi-bin/AtData
- (17) Pavlenko Ya. V., 1999, Astron. Rept. 43, 94
- (18) Pavlenko Ya.V, Zhukovskaya S., 2003, Kinematics and Physics of Celestial bodies. 19, 29.
- (19) Pavlenko Ya.V., 2003a, Proc. of IAU210, Uppsala, ed. N. Piskunov, in press (astro-ph 0209022)
- (20) Pavlenko Ya. V., 2003b, Astron. Rept., 47, 59
- (21) Pavlenko Ya. V., 2003c, (http://www.mao.kiev.ua/staff/yp/Results).
- (22) Piskunov N. and Kupka F., 2001, A&A 547, 1040
- (23) Przybylski A., 1961, Nat 189, 739
- (24) Przybylski A., 1966, Nat 210, 20
- (25) Quinet P., Palmeri P., Bi’emont E., 1999, JQSRT 62, p. 625
- (26) Reyniers M., Van Winckel H., Bi’emont E., Quinet P., 2002, A&A, 395L
- (27) Seaton M.J., 1992, Rev. Mex. Astron. Ap. 23, 180
- (28) Shavrina A.V., Polosukhina N.S., Tsymbal T., Khalack V.R., 2000, Astron. Rept. 44, 235
- (29) Shavrina A.V., Polosukhina N.S., Zverko J., Mashonkina L.I., Khalack V., Ziznovski J., Hack M., Tsymbal V., North P., Vygonec V.V., 2001, A&A 372, 571
- (30) Smith V.V., Lambert D.L., Nissen P.E., 1998, ApJ 506, 405
- (31) C. Sneden, H. Johnson, B. Krupp, 1976, ApJ 204, 281
- (32) Tsymbal V., 1996, M.A.S.S., ASP Conf.Ser., vol. 108, ed. S. Adelman et al., p. 198
- (33) Unsold A., 1955, Physics der Sternatmospharen, 2nd ed., (Springer: Berlin)
- (34) Yushchenko A.V., 1997, Proceedings of the 20th Stellar Conference of the Czech and Slovak Astronomical Institutes, Brno, Czech Republic. ed. J. Dusek. ISBN 80-85882-08-6. Brno 1998, p. 201
- (35) Warner B., 1966, Nat 211, 55
- (36) Wegner G., Petford A.D., 1974, MNRAS 168, 575
- (37) Wolff S.C., Hagen W., 1976, PASP 88, 119