XMM-Newton RGS spectroscopy of LMC X-3
Abstract
We present soft X-ray spectroscopy of the black hole binary LMC X-3 from the XMM-Newton Reflection Grating Spectrometer. The observations span the full range of spectral states seen in LMC X-3. The spectra are completely dominated by continuum emission, and the neutral absorbing column measured from the O I edge ( cm-2) is consistent with the Galactic interstellar column density towards LMC X-3. We find no evidence for variability of the neutral absorbing column. We also constrain the ionized column density using the upper limits to the equivalent width of the O II – O VIII K-shell resonance lines: we find that the equivalent hydrogen column density of gas in which O is partially ionized is cm-2. From this upper limit we can rule out a line driven stellar wind as the power source for the X-ray emission of LMC X-3 except when it is faint. At wavelengths longward of the peak emission the spectral shape is well described by a multi-temperature disk-blackbody spectrum; the powerlaw component which dominates at shorter wavelengths does not continue longward of the disk-blackbody peak. This implies that the multi-temperature disk-blackbody component supplies the seed photons which are Compton upscattered in the hot corona, consistent with the standard paradigm for black hole X-ray binary spectral states.
keywords:
accretion, accretion disks – black hole physics – galaxies: Seyfert – binaries: general – stars: early type – stars: winds1 Introduction
The X-ray properties of accreting black hole candidates (BHCs) lead naturally to classification into different spectral states (e.g. Van der Klis 1994). In their “high/soft” state, their X-ray spectra are dominated below 10 keV by a thermal blackbody-like component with temperature keV. In their “low/hard” state, this thermal component is absent, and BHCs have powerlaw X-ray spectra. An “intermediate” state is also seen, in which the thermal component is weaker. Individual BHCs can exhibit all spectral states, but the fraction of time spent in the different states varies considerably between objects: for example LMC X-1 has only been observed in the high/soft state, while Cyg X-1 spends the majority of its time in the low/hard state.
Of all the persistent BHCs known, LMC X-3 is viewed through the smallest Galactic column density. Until recently LMC X-3 was thought to be permanently in a high/soft state, but observations with the Rossi X-ray Timing Explorer (RXTE) have shown that LMC X-3 changes to a low/hard state during periods of low count rate (Wilms et al. 2001). The existence of state transitions in LMC X-3 has now been confirmed by further RXTE observations (Boyd et al. 2000) and XMM-Newton observations (Wu et al. 2001). Wilms et al. (2001) argue that the long term variability and consequent state changes could be due to an accretion disk wind-driven limit cycle (Shields et al. 1986).
Because of the small column density in the direction of LMC X-3, it is the best persistent BHC in which to study the soft X-ray spectrum at a variety of spectral states. The soft X-ray spectral region is particularly important for understanding the accretion and mass transfer processes, because winds from the accretion disk, or from the companion star will imprint the soft X-ray spectrum with emission and absorption lines and edges. Furthermore, the standard paradigm for the thermal component seen in the high and intermediate states of BHCs (namely that it is the multi-temperature blackbody spectrum of an optically thick, gemoetrically thin, accretion disk) has been poorly tested at soft X-ray energies. This is because almost all instruments on the previous generation of X-ray observatories (i.e. before the launches of Chandra and XMM-Newton) had poor spectral resolution below 2 keV, leading to degeneracies between different spectral shapes and different amounts of absorption in spectral modelling.
In this paper we present soft X-ray spectra of LMC X-3 from the XMM-Newton Reflection Grating Spectrometer (RGS). The spectra, which have a resolution of 70 mÅ, cover the full range of observed spectral states in this source.
2 Observations and data reduction
Table 1 lists the XMM-Newton observations of LMC X-3 that will be used in this analysis, and in Fig. 1 the observation times are marked on the RXTE All-Sky Monitor lightcurve for LMC X-3 during 2000. LMC X-3 was also observed by XMM-Newton in revolution 0028 on the 2nd February 2000, but we have excluded this observation from the present analysis because we are unable to produce a satisfactory effective area calibration for rev. 0028, in which the source is off-axis. Over the ten months spanned by these observations LMC X-3 varied by more than a factor of 1000 in RGS count rate.

| Date | XMM | Instrument | Exposure∗ | Count rate∗ |
|---|---|---|---|---|
| (2000) | Orbit | (ks) | (count s-1) | |
| 07 Feb | 0030 | RGS1 | 12.1 | 7.1 |
| 08 Mar | 0045 | RGS1+2 | 20.8 | 5.9 |
| 19 Apr | 0066 | RGS1+2 | 44.3 | 0.013 |
| 09 Jun | 0092 | RGS1+2 | 77.5 | 2.2 |
| 24 Nov | 0176 | RGS1+2 | 20.9 | 18.0 |
| ∗ Where applicable this is the mean of RGS1 and RGS2 | ||||

The data were initially processed using the public release XMM-Newton SAS version 5.2. First and second order spectra from both RGS were extracted (except for revolution 0030 in which only RGS1 was operating) and response matrices were generated using the latest version of the SAS task RGSRMFGEN (corresponding to SAS version 5.3.3). To correct for residual artifacts in the effective area calibration (see den Herder 2002), the effective area of each response matrix was then divided by the ratio of a powerlaw + Galactic column fit to the XMM-Newton rev 0084 RGS spectra of the continuum source Mrk 421 (Brinkmann et al. 2001). LMC X-3 was on-axis for all of the observations listed in Table 1, as was Mrk 421 in revolution 0084. The data/model ratio of the Mrk 421 RGS spectrum is shown in Fig. 2; for most of the RGS wavelength range the effective area correction is only a few percent. The statistical errors on effective area correction were added in quadrature to the statistical errors on the data. Finally, for each revolution, spectra and response matrices were resampled and coadded to produce a single spectrum per observation. To improve signal to noise, spectra from the February, March, June and November observations were grouped by a factor of 3, resulting in spectra with channels mÅ wide, well sampled with respect to the RGS resolution of mÅ FWHM. The flux level of the April spectrum is extremely low, neccessitating very heavy binning before a respectable signal to noise ratio is achieved; we have grouped this spectrum by a factor of 64. The resultant spectra were then analysed using the XSPEC software package version 11.2.0 (Arnaud 1996).
3 Results

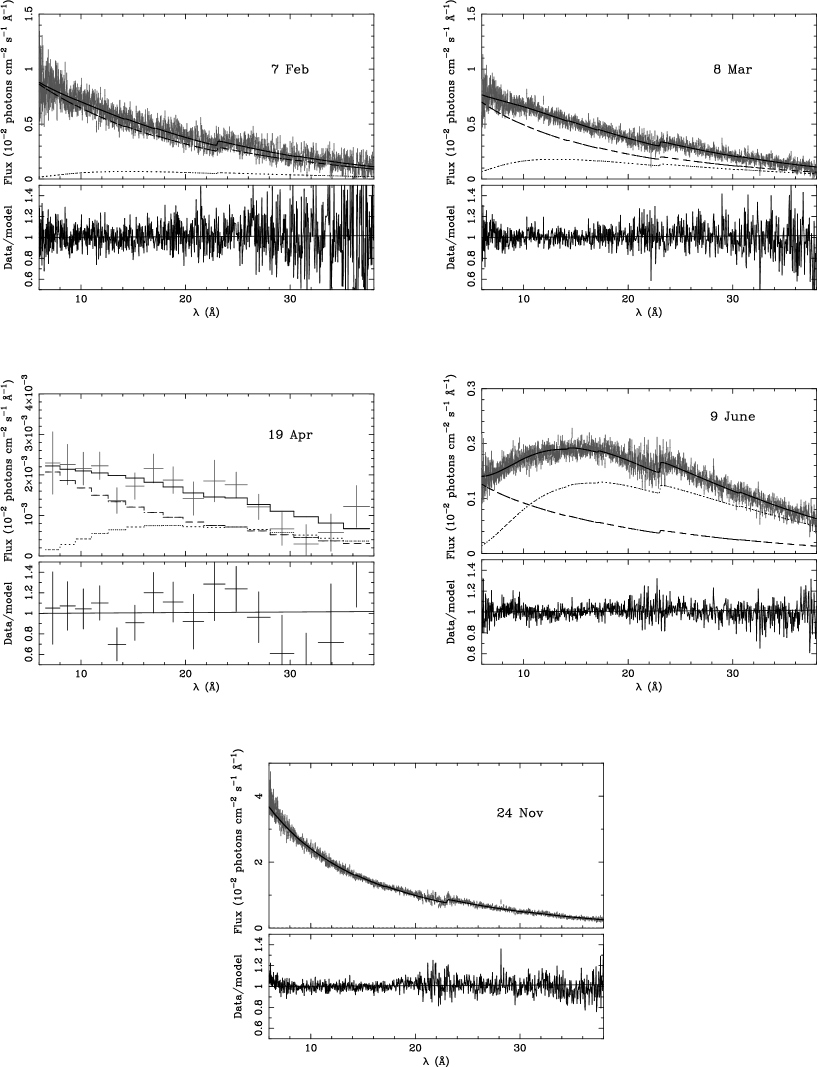
Fig. 3 shows the flux calibrated spectra from all five observations. The four brightest spectra are shown at full resolution in Figs 4 - 7. The spectra appear to be continuum dominated without prominent absorption or emission lines; this is particularly clear in the 24th November spectrum, which has the highest signal to noise ratio and shows no significant spectral features except for the interstellar O I edge at 23Å.
3.1 X-ray absorption in LMC X-3
The degeneracy between absorption and the intrinsic spectral shape has been a major source of uncertainty in attempts to model relatively low resolution soft X-ray spectra of BHCs (e.g. Haardt et al. 2001). The excellent combination of sensitivity and resolution afforded by the XMM-Newton RGS allows individual absorption edges and lines to be measured more or less independently of the underlying continuum shape, allowing a far more reliable determination of the amount of soft X-ray absorption.
3.1.1 Cold material
Cold material (either interstellar or local to the source) imprints a well known sequence of absorption edges on X-ray spectra. For cosmic abundances, oxygen produces by far the strongest absorption edge in the RGS energy range, at 23 Å, and inspection of Fig. 3 shows that this is consistently the strongest feature observed in the RGS spectra of LMC X-3. We have therefore used the depth of the 23 Å O I K edge to determine the cold absorbing column for each of the spectra. By studying a small spectral region (3Å to either side of the edge) we ensure that our column density determination is essentially independent of the overall continuum shape. The confidence intervals for the position of the edge and its optical depth are shown in Fig. 8 for all the observations excluding the very faint April observation. We have also fit the four observations simultaneously with a single set of edge parameters but with the continuum slope and normalisation allowed to vary independently for each observation. The best fit value for the simultaneous fit is shown as a cross on the confidence intervals in Fig. 8. The edge parameters derived from each of the observations independently are consistent with the best fit edge parameters from the simultaneous fit; there is no significant change in the column density of cold material from one observation to the next. The wavelength of the edge from the simultaneous fit is Å where the confidence interval is 95%. This is consistent with the wavelength of the edge calculated by Verner et al. (1996) , which is the edge wavelength used in the XSPEC ‘tbabs’ model (Wilms, Allen & McCray 2000). To determine the equivalent H I column density we substituted the ‘tbabs’ model for the edge and performed another simultaneous fit to the four spectra. This results in cm-2, which is consistent with the H I column density in the direction of LMC X-3 as determined from radio observations ( cm-2; Nowak et al. 2001).


3.1.2 Ionized material
Although the column density of cold absorbing material is consistent with the interstellar medium of the Galaxy, absorbing material associated with a wind from the accretion disk or the secondary star may be highly ionized by the intense X-ray and ultraviolet radiation. Absorption and emission lines from warm, ionized material have now been detected in the soft X-ray band from a number of AGN and X-ray binaries (e.g. Kaastra et al. 2000, Brandt & Schultz 2000).
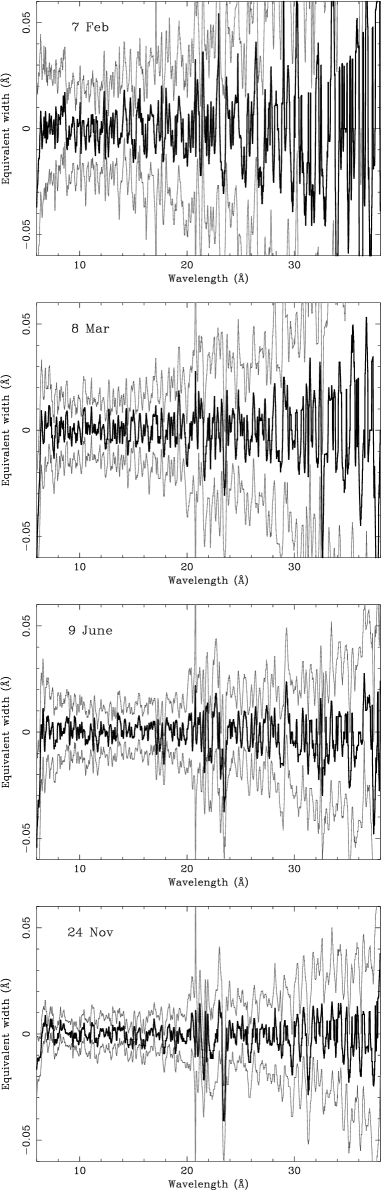
There are no obvious emission or absorption lines present in the RGS spectra of LMC X-3 (Figs 4, 5, 6 and 7) and so we have attempted a sensitive search for their presence. The interstellar medium and the Local-Group intergalactic medium have imprinted absorption lines of O I at 23.52Å and O VII at 21.60Å on the spectrum of Mrk 421 (Paerels et al. 2003), which we have used to correct residual artifacts in the effective area calibration. Therefore we performed the absorption line search on spectra which have no effective area correction. First, we calculated the transmission through the interstellar medium as a function of energy using ‘tbabs’ with cm-2. We then corrected the spectra for interstellar absorption by dividing the effective area of the response matrix by the transmission. We then produced continuum spectra by smoothing our RGS spectra with a sliding box 30 pixels (Å) wide. We rejected any points more than 2 deviant from the resulting smooth curve (i.e. potential emission/absorption features), and repeated the smoothing. This smoothing/rejection process was iterated several times to ensure that even marginally significant discrete features do not influence its shape. We then performed a grid search for emission and absorption lines where the grid was defined in terms of central wavelength, FWHM and equivalent width. The grid values of central wavelength were chosen to oversample the wavelength bins of the data, FWHM was stepped between 0 and 1000 km s-1, with a stepsize of 200 km s-1 (well sampled at the RGS resolution), and the stepsize of the equivalent width was matched to the statistical uncertainty on the data. At each point in the grid, we formed a model spectrum by adding a gaussian emission/absorption line to the smooth continuum spectrum, and we computed the goodness of fit of this model to the real (unsmoothed) spectrum using the poisson errors on the data points and the statistic. The significance of any features, and limits on the equivalent width were determined using . Since we search for lines in either emission or absorption, we expect to give an approximate measure of the significance of any lines (see Protassov et al. 2002). The grid search was performed using our own software which propogates the model through the response matrix in an identical fashion to XSPEC.
The results of this line search are shown in Fig. 9. There are 1000 channels in each spectrum, and therefore we expect spurious feature at the level in each spectrum. The spectra from the 7th February and 8th March each contain one significant absorption feature, at 36.18Å and 32.61Å respectively. These do not correspond to the wavelengths of strong transitions in abundant elements, and are therefore probably spurious. In the spectrum from 9th June, there are three significant absorption features, at 17.86Å, 21.62Å and 37.38Å, and one significant feature at 23.51Å. The features at 17.86Å and 37.38Ådo not correspond to the wavelengths of any expected absorption line and are again probably spurious. The 21.62Å feature has an equivalent width of 19mÅ and is consistent with the transition in O VII, while the 23.51Å feature is the transition of O I. In the spectrum from 24th November, the most significant feature () is again the transition in O I. In addition, there are three and one significant absorption features in this spectrum. Two of the features, at 14.94Å and 31.30Å do not correspond to strong transitions in abundant elements and are therefore probably spurious. The other line, at Å, corresponds to O VIII Ly, while the line is found at Å, and corresponds to O VII He-. The 18.93Å and 21.58Å have equivalent widths of mÅ and mÅ respectively.
The O VII lines detected on the 9th June and 24th November have similar equivalent widths of 20mÅ, which implies an O VII column density between 3 cm-2 and 5 cm-2. Intervening material associated with the halo of our Galaxy is likely to make a significant contribution to (and may dominate) this line, because Galactic O VII absorption is seen with a similar equivalent width in the blazars observed during RGS calibration (Paerels et al. 2003). It is notable that if we apply the Mrk 421 effective area correction before performing the line search on LMC X-3, the OVII absorption lines are not detected in any of the spectra. The equivalent width of the O VIII Ly absorption observed on the 24th November implies an O VIII column density of between 4 cm-2 and 1.4 cm-2. This absorption line is seen in two out of three RGS calibration blazars (Paerels et al. 2003) with a similar equivalent width, and so the line in LMC X-3 may or may not arise in the Galactic halo. The observed wavelength is consistent with an outflow from LMC X-3, but is not well enough constrained to rule out a Galactic origin.
We can place very firm upper limits on the column density of an ionized wind by using the 3 upper limits on the equivalent widths of absorption lines from O II – O VIII obtained from Fig. 9 and assuming that there is no interstellar component to these lines. The spectra from 9th June and 24th November both have sufficient signal to noise ratios to provide useful limits. These limits are given in Table 2, along with the limits on column density assuming a velocity width . The inferred total column density for O II – O VIII is on the 9th June and on the 24th November.
| — 9 Jun — | — 24 Nov — | ||||
|---|---|---|---|---|---|
| Ion | EW | EW | |||
| (Å) | (mÅ) | (cm-2) | (mÅ) | (cm-2) | |
| O VIII | 18.97 | ||||
| O VII | 21.60 | ||||
| O VI | 22.01 | ||||
| O V | 22.33 | ||||
| O IV | 22.78 | ||||
| O III | 23.11 | ||||
| O II | 23.30 | ||||
3.2 Continuum shape
Having established that the soft X-ray spectrum of LMC X-3 is essentially free of discrete emission and absorption features except for the interstellar absorption, we now consider the shape of the continuum. For all the fits performed in this section we include a cold absorbing column fixed at our measured value of cm-2, and all the results are tabulated in Table 3.
We started by fitting a disk-blackbody model to our spectra. Only the very faint spectrum from 19th April is acceptably fitted by this model, which falls off too rapidly below 10Å to fit the other spectra. At shorter wavelengths, BHC spectra typically require a powerlaw component in addition to (or instead of) a disk blackbody (e.g. Ebisawa et al. 1996). We therefore added a powerlaw to the model, with the photon index constrained to lie within the range of photon indices seen at higher energy in LMC X-3: (Wilms et al. 2001, Wu et al. 2001). This resulted in statistically acceptable fits to the February, March and April observations, but not to the higher signal to noise June and November spectra. In all cases the best fit photon index converged to the minimum of the acceptable range, indicating that the powerlaw produces too many photons at long wavelength, where the data are already quite well reproduced by the disk-blackbody component. Therefore we substituted the powerlaw component for Compton scattered emission from a hot corona, making use of the THCOMPDS111THCOMPDS was provided by Piotr Życki, and is available from http://www.camk.edu.pl/ptz/relrepr.html model (Życki, Done & Smith 2001). This model upscatters photons to produce a power-law shape; the seed photons for the Compton scattered component were assumed to come from the disk blackbody, and the electron temperature of the scatterer was fixed to 100 keV (the RGS energy range is too limited for the fit to be sensitive to this parameter). This model produced better fits to all the spectra, and all of the fits are acceptable at the 3 confidence level; Fig. 10 shows RGS spectra compared to the best fit model components.
| Disk blackbody | ||||||
| Observation | Flux (disk) | - | - | Prob | ||
| (keV) | ( erg s-1 cm-2) | |||||
| 07 Feb | - | - | 1169/986 | |||
| 08 Mar | - | - | 1161/997 | |||
| 19 Apr | - | - | 15/16 | 0.53 | ||
| 09 Jun | - | - | 2872/998 | 0 | ||
| 24 Nov | - | - | 1344/1001 | |||
| Disk blackbody + powerlaw | ||||||
| Observation | Flux (disk) | Flux (powerlaw) | Prob | |||
| (keV) | ( erg s-1 cm-2) | ( erg s-1 cm-2) | ||||
| 07 Feb | 1045/984 | 0.085 | ||||
| 08 Mar | 954/995 | 0.82 | ||||
| 19 Apr | 13/14 | 0.54 | ||||
| 09 Jun | 1132/996 | |||||
| 24 Nov | 1210/999 | |||||
| Disk blackbody + Comptonised disk (thcompds) | ||||||
| Observation | Flux (disk) | Flux (Comptonised) | Prob | |||
| (keV) | ( erg s-1 cm-2) | ( erg s-1 cm-2) | ||||
| 07 Feb | 1024/984 | 0.18 | ||||
| 08 Mar | 902/995 | 0.98 | ||||
| 19 Apr | 12/14 | 0.59 | ||||
| 09 Jun | 1079/996 | 0.034 | ||||
| 24 Nov | 1127/999 | |||||
4 Discussion
In the preliminary analysis of XMM-Newton EPIC and RGS spectra, Wu et al. (2001) argued that mass transfer mainly occurs in LMC X-3 by Roche lobe overflow rather than via a strong stellar wind because the line of sight absorption is small ( cm-2). With the more detailed analysis presented here we can rule out accretion from a stellar wind with much higher confidence.
For a continuous spherical wind leaving a body of mass and radius at the escape velocity, the hydrogen column density is related to the mass-loss rate by:
| (1) |
where is the mass of a proton. This expression can be used to obtain a conservative upper limit to the wind mass-loss rate, because if we assumed a -law velocity profile (), as used to model the line-driven winds from hot stars (Pauldrach, Puls & Kudritzki 1986), instead of a constant velocity wind, the mass-loss rate for a given column density would be lower than that given in equation (1). In Section 3.1.1 we obtained an upper limit of cm-2 for the hydrogen column density intrinsic to LMC X-3, based on the neutral O edge and assuming Solar metallicity. If we instead assume a metal abundance of 0.4 Solar as expected in the LMC (Caputo et al. 1999), we find an upper limit of cm-2. We can also estimate the hydrogen column density associated with O II – O VIII using the limits obtained in Section 3.1.2 from the 24th November spectrum. Assuming 0.4 Solar abundance, we obtain cm-2. Summing these two upper limits to obtain the total hydrogen column density associated with O I – O VIII, we find cm-2. Assuming that the companion star has mass and radius (Soria et al. 2001) and substituting into equation (1), we find that g s-1. This is insufficient to power the X-ray emission except when LMC X-3 is in its very weakest state (e.g. April 2000).
However, we have so far neglected wind material in which O is completely ionized. When the luminosity of the system is as high as erg s-1, the ionization parameter () at the base of a homogeneous, constant-velocity wind from the secondary star is where is luminosity in erg s-1, is the ion density in cm-3, and is the binary separation, cm. Thus for mass-loss rates g s-1 we expect erg cm s-1, implying that the majority of O in the wind is completely ionized (Kallman & McCray 1982), and therefore undetectable by X-ray absorption line spectroscopy. For a wind with a -law velocity profile the wind is much denser near the base, but at a distance of from the stellar photosphere, when the wind has only achieved about a fifth of its terminal velocity (assuming ), reaches . A stellar wind cannot be driven by line-pressure at such a high ionization state, because the ions that provide most of the acceleration (Abbot 1982) will not be present (McCray & Hatchett 1975). On the other hand, we can rule out a mass-loss rate of g s-1, because the column density would be high enough, (and low enough) that absorption lines from O would be very apparent in the RGS spectra. Thus the lack of absorption lines in the RGS spectra implies that a line-driven stellar wind is not the primary source of accretion material for LMC X-3 except, possibly, when it is in a faint state. By comparing the variability properties of LMC X-3 to LMC X-1, Nowak et al. (2001) also conclude that LMC X-3 is not accreting from a stellar wind. Roche lobe overflow is therefore the most likely mode of mass transfer in LMC X-3.
In order to explain the state changes observed in LMC X-3 along with the long term day periodic variability, Wilms et al. (2001) propose that the accretion rate could be controlled by an accretion disk wind-driven limit cycle as discussed by Shields et al. (1986). The optical photometric variability presented by Brocksopp et al. (2001) is also consistent with this hypothesis. In this scenario, the central X-ray source in LMC X-3 drives a Compton heated wind from the accretion disk that is sufficiently strong that it interrupts its flow of fuel. For such an instability to take place, the mass loss in the wind must exceed the accretion rate by a considerable factor (e.g. , Shields et al. 1986). At distances from the central source greater than the outer radius of the accretion disk, the Compton heated wind is approximately spherical (Begelman & McKee 1983) and so we can use equation 1 to relate the mass loss rate of an accretion disk wind to the column density. Taking the radius of the accretion disk to be cm, and the mass of the primary to be (Soria et al. 2001), we find that an accretion disk wind capable of driving the long-term variability will have cm-2 when the luminosity of the source is erg s-1. If we assume a wind temperature of K (Begelman, McKee & Shields 1983), more than of O is in the form of O IX, and the column density of O VIII can therefore be cm-2, consistent with the upper limits given in Table 2. Thus we cannot rule out that the periodic variability in LMC X-3 is driven by an accretion disk wind. However the column density in any accretion disk wind must be small enough that that it is transparent to scattering: thermal emission from a wind with column density cm-2 would dominate the X-ray luminosity of the system, giving rise to prominent K lines from Fe XXV and Fe XXVI. This is not observed in LMC X-3 (Wu et al. 2001). Thus even if there is an accretion disk wind, it imparts no significant features or distortions on the X-ray spectrum of LMC X-3.
The resolution and throughput of the RGS coupled with the lack of X-ray absorption in LMC X-3 provide a clearer picture of the soft X-ray continuum spectral shape than has ever been possible before. Excluding the very faint April spectrum, the spectral fitting performed in Section 3.2 demonstrates that a single disk blackbody is unable to describe the 0.3-2 keV spectral shape even when LMC X-3 is in the high/soft state, mainly because the model falls off too fast at short wavelength. Adding a powerlaw component results in much improved (though for the 24th November still unacceptable) fits. However, the fitted powerlaw slopes consistently bottom out at the hardest allowed values in the fitting () and are considerably harder than the powerlaw slopes found over the 0.3-12 keV energy range with XMM-Newton EPIC (Wu et al. 2001), even when the EPIC and RGS data were obtained simultaneously.
A visual inspection of Fig. 3 offers some insight into the reason for the discrepant powerlaw parameters: longward of 23 Å the spectra have almost the same shape, running approximately straight and parallel as expected from a disk blackbody with a varying inner temperature. However, a powerlaw, even with a photon index as hard as , has a softer spectral shape than a disk blackbody longward of the peak. Thus for a powerlaw with to make a significant contribution at Å it would have to make a larger contribution at longer wavelength, and therefore the spectra should deviate significantly from the disk blackbody shape at Å. Therefore the straight parallel spectra at Å, and the low best-fit photon indices, imply that the component which is observed to have a powerlaw shape at Å (i.e. at E keV) does not continue with the same powerlaw shape through the soft X-ray band.
The powerlaw component is normally assumed to be the Compton upscattered emission from a hot corona (Sunyaev & Titarchuk 1980). The Compton scattered spectrum is expected to deviate from a powerlaw shape close to the energy of the seed photons. Thus the absence of the powerlaw component in the soft X-ray is consistent with the seed photons for the Comptonisation coming from the disk blackbody component. This is predicted by successful models for black hole binary spectral states (e.g. Haardt & Maraschi 1991, Haardt & Maraschi 1993, Chakrabarti & Titarchuk 1995, Haardt et al. 1997), in which the temperature and optical depth of the corona depend on the amount of cooling via Compton scattering off soft X-ray photons from the disk. This result is borne out by the improved fits which are obtained when the powerlaw is exchanged for a Comptonised disk blackbody. However, even with this model, the photon index which describes the Comptonised spectrum towards shorter wavelengths is lower than the photon indices obtained over a larger energy range using EPIC. Furthermore, for the brightest spectra the soft X-ray flux from the Comptonised component dominates the flux directly emerging from the disk. This suggests some further complexity in the spectral shape at the short wavelength end of the spectra (the disk blackbody and Comptonised components have a similar spectral shape at the long wavelength end). One possible explanation could be that in the soft state, the soft component in LMC X-3 falls off slower than a disk blackbody towards short wavelengths due to electon scattering near the surface of the disk. Such a broadening of the soft component spectral shape has been observed in the soft X-ray transients (e.g. GS 2000+25, GRO 165540) studied by Życki et al. (2001) using Ginga and RXTE spectra. However, the RGS does not extend to short enough wavelengths for a proper investigation of this, which we defer to a future study using the EPIC instruments which cover a wider energy range.
5 Conclusions
We have presented XMM-Newton RGS spectra of LMC X-3 covering the full range of spectral states observed in this source (more than 3 orders of magnitude in RGS count rate). The spectra are completely dominated by continuum emission, and are devoid of notable spectral features except for the interstellar O I edge. The depth of the edge is consistent between the different observations, and is consistent with the Galactic interstellar column density of in the direction of LMC X-3. The upper limit to the edge depth implies associated with neutral O, intrinsic to LMC X-3. Upper limits on the equivalent widths of resonant absorption lines from O II – O VIII imply for gas associated with partially ionized O. This implies that a line-driven stellar wind off the companion star can not supply a significant fraction of the accreting material except during the very low luminosity states. Therefore the majority of accretion in LMC X-3 probably takes place through Roche Lobe overflow.
A multi temperature disk blackbody is a good representation of the soft X-ray spectrum of LMC X-3 longward of the disk blackbody peak. Thus the powerlaw component which dominates at higher energies does not continue through the soft X-ray range with a powerlaw shape. This suggests that the disk blackbody component supplies the seed photons which are Compton upscattered to form the powerlaw at higher energies, as in conventional models for BHC spectral states.
6 Acknowledgements
This work is based on observations obtained with XMM-Newton, an ESA science mission with instruments and contributions directly funded by ESA Member States and the USA (NASA). This work makes use of results provided by the ASM/RXTE teams at MIT and at the RXTE SOF and GOF at NASA’s GSFC.
References
- [1982] Abbot D.C., 1982, ApJ, 259, 282
- [1996] Arnaud, K.A., 1996, in Astronomical Data Analysis Software and Systems V, eds. Jacoby G. and Barnes J., p17, ASP Conf. Series volume 101
- [1983] Begelman M.C., McKee C.F., & Shields 1983, ApJ, 271, 70
- [1983] Begelman M.C., McKee C.F., 1983, ApJ, 271, 89
- [2000] Brandt W.N., Schulz N.S., 2000, ApJ, 544, L123
- [2001] Brinkmann W., et al. , 2001, A&A, 365, L162
- [2001] Brocksopp C., Groot P.J., Wilms J., 2001, MNRAS, 328, 139
- [2000] Boyd P.T., Smale A.P., Homan J., Jonker P.G., van der Klis M., Kuulkers E., 2000, ApJ, 542, L127
- [1999] Caputo M., Marconi G., Ripepi V., 1999, ApJ, 525, 784
- [1995] Chakrabarti S.K., Titarchuk L.G., 1995, ApJ, 455, 623
- [2002] den Herder J.W., 2003, Proceedings of “High Resolution X-ray Spectroscopy with XMM-Newton and Chandra”, Ed. G. Branduardi-Raymont, available at http://www.mssl.ucl.ac.uk/gbr/rgs_workshop/papers/
- [1996] Ebisawa K., Titarchuk L., & Chakrabarti S.K., 1996, PASJ, 48, 59
- [1991] Haardt F., Maraschi L., 1991, ApJ, 380, L51
- [1993] Haardt F., Maraschi L., 1993, ApJ, 413, 507
- [1997] Haardt F., Maraschi L., Ghisellini G., 1997, ApJ, 476, 620
- [2001] Haardt F., Galli M.R., Treves A., Chiappetti L., Dal Fiume D., Corongiu A., Belloni T., Frontera F., KuulkersE., Stella L., 2001, ApJS, 133, 187
- [2000] Kaastra J.S., Mewe R., Liedahl D.A., Komossa S., Brinkman A.C., 2000, A&A, 354, L83
- [1982] Kallman T.R. & McCray R., 1982, ApJS, 50, 263
- [1975] McCray R., & Hatchett S., 1975, ApJ, 199, 196
- [2001] Nowak M.A., Wilms J., Heindl W.A., Pottschmidt K., Dove J.B., Begelman M.C., 2001, MNRAS, 320, 316
- [2003] Paerels F., Rasmussen A., Kahn S.M., den Herder J.W., de Vries C., 2003, Proceedings of the Workshop: “XEUS - studying the evolution of the hot universe”, eds. G. Hasinger, Th. Boller, and A. Parmar, MPE report 281, 57
- [1986] Pauldrach A., Puls J., Kudritzki R.P., 1986, A&A, 164, 86
- [2002] Protassov R., van Dyk D.A., Connors A., Kashyap V.L., Siemiginowska A., 2002, ApJ, 571, 545
- [1986] Shields G.A., McKee C.F., Lin D.N.C., Begelman M.C., 1986, ApJ, 306, 90
- [2001] Soria R., Wu K., Page M.J., Sakelliou I., 2001, A&A, 365, L273
- [1980] Sunyaev R.A., Titarchuk L.G., 1980, A&A, 86, 121
- [1994] van der Klis M., 1994, ApJS, 92, 511
- [1996] Verner D.A., Ferland G.J., Korista K.T., Yakovlev D.G., 1996, ApJ, 465, 487
- [2000] Wilms J., Allen A., McCray R., 2000, ApJ, 542, 914
- [2001] Wilms J., Nowak, M.A., Pottschmidt K., Heindl W.A., Dove J.B., Begelman M.C., 2001, MNRAS, 320, 327
- [2001] Wu K., Soria R., Page M.J., Sakelliou I., Kahn S.M., de Vries C.P., 2001, A&A, 365, L267
- [2001] Życki P.T., Done C., Smith D.A., 2001, MNRAS, 326, 1367