2. National Astronomical Observatories, Chinese Academy of Sciences, Beijing 100012, China
wuxb@bac.pku.edu.cn
Color-redshift relations and photometric redshift estimations of quasars in large sky surveys
Abstract
With a recently constructed composite quasar spectrum and the minimization technique, we demonstrated a general method to estimate the photometric redshifts of a large sample of quasars by deriving the theoretical color-redshift relations and comparing the theoretical colors with the observed ones. We estimated the photometric redshifts from the 5-band SDSS photometric data of 18678 quasars in the first major data release of SDSS and compare them with the spectroscopic redshifts. The redshift difference is smaller than 0.1 for 47 of quasars and 0.2 for 68 of them. Based on the calculation of the theoretical color-color diagrams of stars, galaxies and quasars in both the SDSS and BATC systems, we expected that with BATC intermediate band photometric system we would be able to select candidates of high redshift quasars more efficiently than in the SDSS, provided the BATC survey could detect objects with magnitude fainter than 21.
keywords:
galaxies: photometry — quasars: general — quasars: emission lines — surveys1 Introduction
Quasars are intrinsically very luminous objects with absolute magnitude brighter than , but many of them looks very faint because they are usually very far away from us. The morphology of quasars looks like stars on the photographic and CCD plates and we can not identify them directly from the images. However, the spectrum of a typical quasar usually consists of strong broad emission lines and a power law continuum (Francis et al. 1992; Vanden Berk et al. 2001), which is quite different from stars. Therefore it is relatively easier to separate quasars from stars with the spectroscopic observations. In recent years, more and more quasars have been discovered along with the ongoing projects of large sky surveys such as SDSS ( Sloan Digital Sky Survey), 2dF (2 degree Fields) and BATC (Beijing-Arizona-Taipei-Connecticut). Many of these quasars have large redshift and therefore are very much helpful in studying the structure and evolution of the early universe.
Astronomical photometry can be used as low-resolution spectroscopy (Bessell 1990). Photometric observation has its advantage of surveying a large sample of objects in large sky areas. It can be used to identify much fainter objects than the spectroscopic observations at the same exposure time. The practice of measuring redshift of galaxies and quasars using multi-color photometry has become both very popular and powerful in recent years (Brunner et al. 1997; Connolly et al. 1999; Xia et al. 2002). Among many current sky survey programs with multi-color photometry, SDSS is a joint project which aims to discover more than galaxies and quasars (York et al. 2000). The photometric survey in SDSS is being done with 5 passbands( u’, g’, r’, i’, z’) covering from from to (Fukugita et al. 1996). Such a 5-band photometry can be treated as an objective-prism survey (Richards et al. 2001). With these photometric data, quasar candidates can be efficiently selected with some criteria (Fan 1999; Newberg et al. 1999; Richards et al. 2002). Subsequent spectroscopic observations of these candidates have revealed 18678 quasars in the first major data release of SDSS (Abazajian et al. 2003). Discovery of several quasars with redshift larger than 6 in the SDSS project has given us important information about the reionization epoch of our universe (Becker et al. 2001; Fan et al. 2002).
In China, we have also developed a program of multi-color photometric survey, namely the BATC project (Chen 1998; Zhou et al. 2001; Zhou et al. 2003). This is being done with a 60/90cm Schmidt telescope at the National Astronomical Observatories of Chinese Academy of Sciences. A Ford Aerospace CCD with pixels and 15 intermediate-band filters covering from 3200Å to 10000Å were used in the Survey. The field of view of the telescope is about 1 deg2 and the limit magnitude for photometry reaches 21 mag approximately in V band. Because the number of intermediate-band filters of this system is much more than others, theoretically it can obtain much more accurate photometric data such as the spectral energy distributions (SED) of many different types of objects. The survey started to work in 1995 and has so far surveyed about 100 deg2 sky region at high galactic latitudes. It has got many important results on star clusters, nearby galaxies and galaxy clusters (Kong et al. 2000; Yuan et al. 2001; Ma et al. 2001; Xia et al. 2002).
With the 15-band photometric data from the BATC survey, it could be more efficient to select quasar candidates than in other broad band surveys. In this paper, we first derive the theoretical color-redshift relations for quasars based on the composite spectrum obtained in the SDSS, and then use them to estimate the photometric redshifts of a large sample of quasars and compare them with the spectroscopic redshifts. Furthermore, we give the theoretical color-color relations of stars, galaxies and quasars in both the SDSS and BATC surveys, and demonstrate that the BATC system should be more efficient in selecting candidates of high redshift quasars than the SDSS, provided it can reach the magnitude fainter than 21.
2 Color-redshift relations of quasars in the SDSS system

Using the spectra for more than 2200 quasars in the early data release, the SDSS team has derived a composite spectrum for quasars (Vanden Berk et al. 2001). The wavelength range of this spectrum covers from 800 to 8550 and is much broader than any previous composite spectra of quasars (Francis et al. 1991; Zheng et al. 1997). Assuming that this composite spectrum is the best representative for all quasars, we can calculate the color-redshift relations for quasars in different photometric systems. This means, however, that we have to omit other types of quasars such as quasars with broad absorption lines and redder colors in our calculations.
Under these assumptions, we can estimate the magnitude of quasars in every passband at different redshift theoretically. If we define as the transmission efficiency of the filter at frequency , as the flux of the quasar at the same frequency. The flux of the quasar in this passband is expressed as:
| (1) |
Because SDSS system is an AB photometry system (Fukugita et al. 1996), then the magnitude in this passband is:
| (2) |
Then the color of this quasar can be expressed as (Richards et al. 2001):
| (3) |
With the transmission curves of SDSS filters and the composite quasar spectrum, we calculated the magnitudes in 5 SDSS photometric bands at different redshift , with a redshift bin of 0.05. From these magnitudes we can get 4 theoretical color-redshift relations of quasars in SDSS survey (shown as solid lines in Figure 1). We noted that we can not get reasonable value of the color at larger redshift. This is because Ly emission line moves out of the response of filter when redshift is larger than 3.6. In addition, we found that our color-redshift relations are very similar as those obtained in Fan (1999) by assuming a power law continuum and the typical emission line ratios of quasars. However, the method we adopted to derive these relations is more straightforward than the previous one.
We also compared the theoretical color-redshift relations with the observational data of 18678 quasars in the first major data release of SDSS (Abazajian et al. 2003). The points in Figure 1 represent the observation data of quasars. It is clear that our theoretical results are well consistent with the observed ones.
3 Estimation of the photometric redshifts of quasars
The photometric redshifts of quasars can be estimated by comparing the observed colors with the theoretical color-redshift relations. A standard minimization method is used here to estimate the most possible photometric redshifts of quasars. If we write the theoretical color as , the observed color as and the uncertainties of observed magnitudes in and band as , , the is then defined as:
| (4) |
Because SDSS photometric data have uncertainties in 5 filter bands so we perform the minimization for all 4 colors. For a quasar we can get a sequence of for every different redshift between 0 and 5. If we further consider that all the quasars should have absolute magnitude brighter than -23, this requirement will help us to exclude some results with extremely lower redshifts.
Following these steps, we can get the smallest and the corresponding photometric redshift for a quasar with 5-band photometric data. With this method we have calculated the photometric redshifts for all 18678 quasars in the first major data release of SDSS. We noted that Ly emission line moves out of the response of filter when redshift is larger than 3.6, so we would get unreasonable value of the color at larger redshift. This means that we can only use 3 of 4 colors if the trying redshift is larger than 3.6. However, we still used 4 colors to estimate the photometric redshift if the trying redshift is smaller than 3.6 in order to get more accurate .
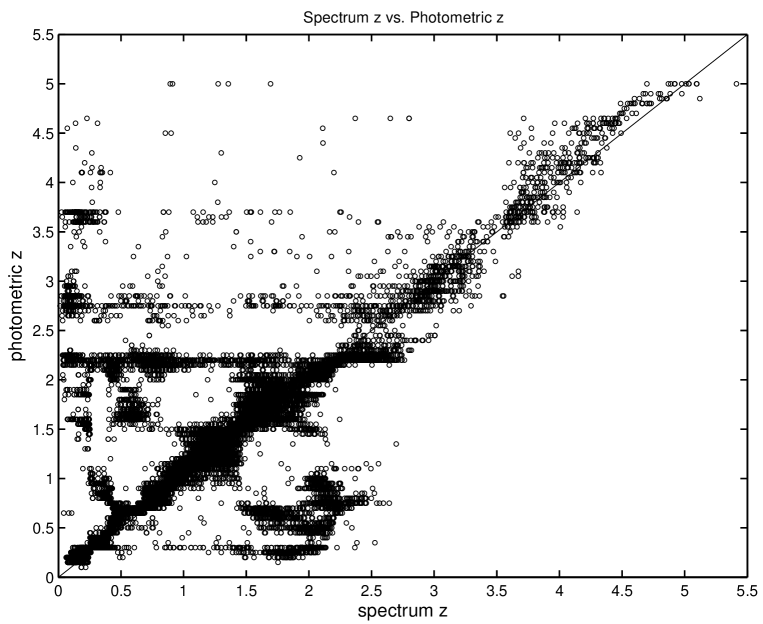
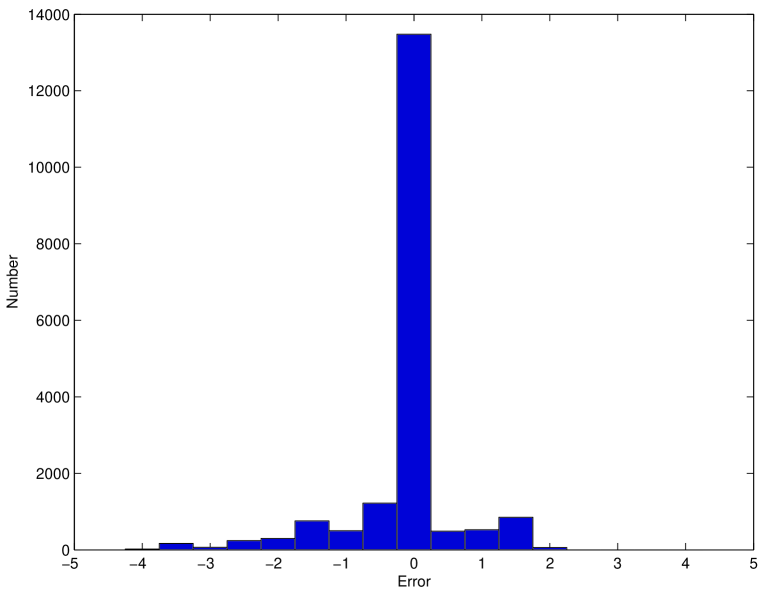
In the first major data release of SDSS, the spectroscopic redshift of all the 18678 quasars have been given (Abazajian et al. 2003). With these redshifts, we can check the efficiency of our method. The comparison of the photometric redshifts and the spectroscopic redshifts is shown in Figure 2. We found that the difference between photometric redshift and spectral redshift is smaller than 0.1 for 46.62% of quasars and is smaller than 0.2 for 67.87% of quasars. The histogram of these differences is shown in Figure 3. From it we can clearly see that the photometric redshifts estimate by us are quite accurate within for most of quasars.
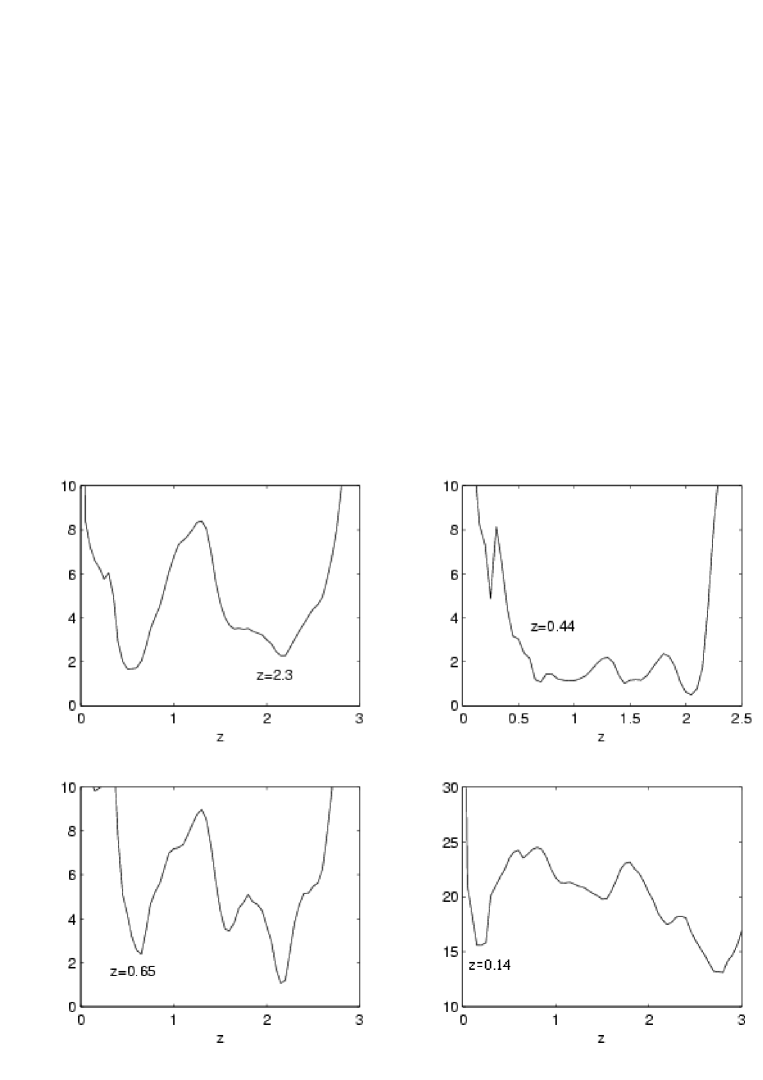
However, using the minimization method to estimate the photometric redshift can also lead wrong results for some quasars. If the real spectra of quasars are substantially different from the composite spectrum or the uncertainties of photometric magnitudes are larger, our calculated might reach the minimum at a wrong redshift. Some examples of these cases are shown in Figure 4. From them we can clearly see that the gets minimum value at wrong photometric redshift. Such a problem could be alleviated if more composite spectra of different types of quasars were adopted to calculate the theoretical color-redshift relations.
We noticed that the SDSS team has also made the estimations of photometric redshift of 2625 quasars in the early data release of SDSS (Richards et al. 2001). However, they adopted a different method from that adopted by us to derive the color-redshift relation. As described in Richards et al. (2001), their color-redshift relation was the median of 2200 quasars in the early data release of SDSS They calculated the photometric redshift for these 2625 quasars by using the minimization method with these median color-redshift relations and the observational colors. The difference between their photometric redshift and spectral redshift is smaller than 0.1 for 55% of quasars and is smaller than 0.2 for 70% of them. Although the efficiency of our method for photometric redshift estimation is slightly lower than that adopted by the SDSS team, the major advantage of our method is that it can be easily adapted to any other photometric systems. With our method, the theoretical color-redshift relation of quasars in other photometric systems can be easily obtained as long as the transmission curves of the filters are given. In contrary, the median color-redshift relation for quasars got by the SDSS team can only be used for the SDSS photometric data. In addition, we also noted that the efficiency of our photometric redshift estimation is comparable to that in some other groups such as Hatziminaoglou et al. (2000) and Wolf et al. (2001), who estimated the photometric redshifts of smaller samples of quasars with different methods.
4 Color-color diagrams of quasars, stars and galaxies
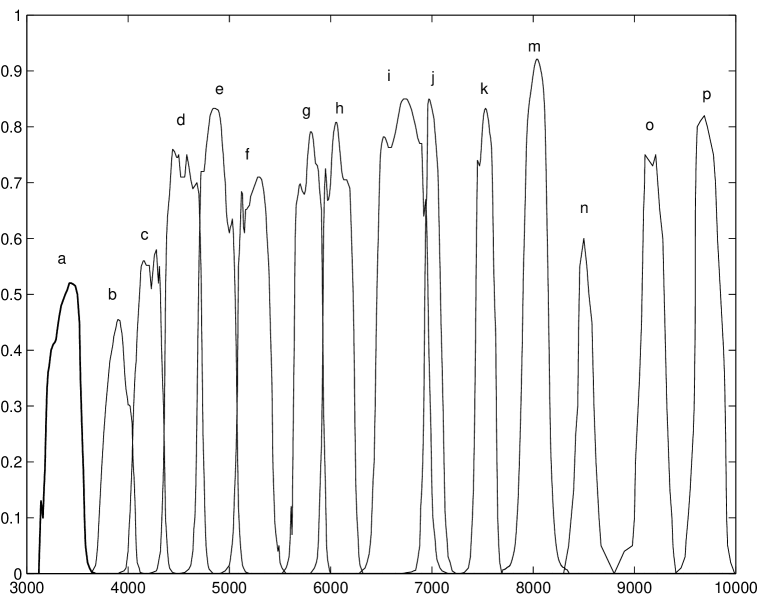

We used the method described above to calculate the theoretical colors of quasars, stars and galaxies in the BATC system in order to find some criteria for selecting quasar candidates from the survey data. The transmission curves of BATC 15 intermediate filters (named from to except ) are shown in Figure 5 (see also Xia et al 2002). We did the calculation of 14 color-redshift relations of quasars in the BATC system using the composite quasar spectrum obtained by the SDSS. The results are shown in Figure 6. For stars, we used the stellar spectral library given by Pickles et al. (1998), which consist 130 template spectra of stars with different spectral types from O to M. For galaxies, we used the template spectra of 12 types of galaxies (Kinney et al. 1996). We calculated the colors of each type of galaxy at different redshift from 0 to 5 with a bin of 0.05.


We have plotted stars, galaxies and quasars on 13 color-color diagrams and found that it is not easy to use a simple criterion to separate quasars from stars in many of these diagrams. But it is still possible to separate quasars (especially high redshift ones) from stars and galaxies on 4 of the color-color diagrams (shown in Figure 7). We noted that most stars lie in a narrow belt on the color-color diagrams, while galaxies with different redshifts distribute much diversely. However, it is clear that the right upper regions in these diagrams are dominated by high redshift quasars. Therefore the dashed lines in these 4 diagrams can be used as the simple criteria to select candidates of quasars with redshift larger than 3.5 from the photometric data in the BATC survey. These criteria are:
In addition, we note that quasars are mostly point sources while many of galaxies are extended objects. Therefore we can further exclude some galaxies using morphology information. After these checks, candidates of high redshift quasars can be then selected from these color-color diagrams for further spectroscopic identifications. We also noted that quasar candidates selected in this way may be still contaminated with some brown dwarfs and some other kind of AGNs (Fan et al. 2002). Further detailed studies on the differences of brown dwarfs and high redshift quasars in the color-color diagrams may help us to solve this problem.
We note that with our selection criteria we will still miss a lot of quasars , especially those with lower redshift because they locate at the same places as stars in the color-color diagrams. But higher efficiency of selecting high redshift quasars from these color-color diagrams is much more attractive and this could be an advantage of BATC photometric system because it has 15 intermediate filters and is able to identify the main emission lines more accurately than in other broad band photometric surveys.
Following the same method as above, we also calculated the color-color diagrams of stars, galaxies and quasars in SDSS system. The results are shown in Figure 8, which is also similiar as those got by Fan (1999). Comparing with those in the BATC system, we found that the separation of quasars from stars and galaxies on the diagrams in the SDSS system is not so well as in the BATC system. Although the candidates of high redshift quasars can be possibly selected only from the vs and the vs diagrams, the contaminations of stars and galaxies to the selection of quasar candidates are much more serious than in the BATC system. This is understandable because of the broader filter bands of SDSS photometric system. Therefore, with the BATC photometric data we could be able to find candidates of high redshift quasars more efficiently than in the SDSS survey.
5 Discussions
In this paper we demonstrated a method to derive the color-redshift relations of quasars from the composite quasar spectrum and applied this method to SDSS and BATC systems. Our estimated photometric redshifts of 18687 quasars are well consistent with the spectroscopic redshifts given in the first major data release of SDSS. This method can be easily adapted to other multi-color survey system because it only needs the transmission functions of the filters and the photometric data. By comparing the theoretical color-color diagrams of stars, galaxies and quasars in the SDSS and BATC systems, we found the BATC system would be better than SDSS in selecting high redshift quasar candidates provided the BATC survey could go as deeper as SDSS to detect objects fainter than 21 magnitude. A detailed comparison of photometric redshifts, estimated from both the SDSS and BATC photometric data, for quasars in several common sky fields in both surveys will be given in another paper.
We noted that all the calculations of photometric redshifts in this paper is based on the composite spectrum of SDSS quasars. However, when we use this composite spectrum for all quasars, there must be big errors. In fact, the spectra of quasars are much diverse. For example, the continuum and emission line intensity of radio loud quasars are different from those of radio quite ones (Francis et al. 1993; Zheng et al. 1997). The quasars with broad absorption lines and redder quasars have very different spectra from normal ones(Sprayberry & Foltz 1992; Richards et al. 2003). These differences should be considered in estimating the photometric redshift of quasars. In our future work we will use more composite spectra of different types of quasars. In addition, we note that the calculation of minimum could be further improved with the ASQ method developed recently by the SDSS team to give more accurate photometric redshift of quasars (Budavari et al. 2001).
Large sky area surveys have become very popular in recent years. The huge amount of data obtained from these surveys such as SDSS and 2DF already provided us much information about the structure and evolution of the universe. Comparison with the spectroscopic survey, multi-color photometric survey over large sky areas can obtain the spectral energy distributions of much more fainter objects. With the technique of photometric redshift determination, we can construct large samples of objects with estimated redshifts and make many interesting studies on galaxies and quasars. The multi-color photometric data can be also used to estimate the spectral types of numerous stars. Therefore, from the multi-color photometric observations, we can efficiently select candidates of galaxies, quasars and some specific stars and prepare the input catalog for the further spectroscopic surveys. This is very important especially for LAMOST, a future spectrocopic survey project in China (Luo & Zhao 2001).
Acknowledgements.
This work is supported by the National Key Project on Fundamental Researches (TG 1999075403) and the National Science Fundation (No. 10173001) of China.References
- [1] Abazajian, K. & SDSS collaboration, 2003, AJ, submitted (astro-ph/0305492)
- [2] Becker, R.H., et al., 2001, AJ, 122, 2850
- [3] Bessell, M.S. 1990, PASP, 102, 1181
- [4] Brunner, R.J., Connolly, A.J., Szalay, A.S., & Bershady, M.A. 1997, ApJ, 482, L21
- [5] Budavari, T. et al. 2001, AJ, 122:1163
- [6] Chen, J.-S., 1998, Proceedings of the 179th IAU Symposium, 123
- [7] Connolly, A. J., et al. 1999, in ASP Conf. Ser. 191, 13
- [8] Fan, X. 1999, AJ, 117, 2528
- [9] Fan, X., et al. 2002, AJ, 123, 1247
- [10] Francis,P.J., et al. 1991, ApJ, 373, 465
- [11] Francis,P.J., Hewett, P.C., Foltz, C.B., & Chaffee, F.H. 1992, ApJ, 398, 476
- [12] Francis,P.J.,Hooper, E.J., Impey, C.D., 1993, AJ, 106, 417
- [13] Fukugita, M., et al., 1996, AJ, 111, 1748
- [14] Hatziminaoglou, E., Mathez, G., & Pello, R. 2000, A&A, 359: 9
- [15] Kinney, A.L., et al. 1996, AJ, 467,38
- [16] Kong, X., et al., 2000, AJ, 119, 2745
- [17] Luo, A.-L., & Zhao, Y.-H. 2001, ChJAA, 1, 563
- [18] Ma, J., et al. 2001, AJ, 122, 1796
- [19] Newberg, H. J. et al. 1999, AJ,123, 337
- [20] Pickles, A. J., 1998, PASP, 110, 863
- [21] Richards, G.T., et al. 2001, AJ,122,1151
- [22] Richards, G.T., et al. 2002, AJ,123,2945
- [23] Richards, G.T., et al. 2003, AJ,in press
- [24] Sprayberry, D. & Foltz, C.B., 1992, APJ, 390, 39
- [25] Vanden Berk, D.E., et al. 2001, AJ,122, 549
- [26] Wolf, C., et al. 2001, A&A, 365: 681
- [27] Xia, L.F. et al. 2002, PASP, 144,1349
- [28] York, D.G., et al. 2000, AJ, 120, 1579
- [29] Yuan, Q., et al., 2001, AJ, 122, 1718
- [30] Zheng, W., et al. 1997, ApJ,475,469
- [31] Zhou, X. et al, 1999, PASP, 111, 909
- [32] Zhou, X., et al. 2001, ChJAA, 1, 372
- [33] Zhou, X., et al. 2003, A&A, 397, 361