UBRI Photometry of Globular Clusters in the Leo Group Galaxy NGC 3379
Abstract
We present wide area UBRI photometry for globular clusters around the Leo group galaxy NGC 3379. Globular cluster candidates are selected from their B-band magnitudes and their (U–B)o vs (B–I)o colours. A colour-colour selection region was defined from photometry of the Milky Way and M31 globular cluster systems. We detect 133 globular cluster candidates which, supports previous claims of a low specific frequency for NGC 3379.
The Milky Way and M31 reveal blue and red subpopulations, with (U–B)o and (B–I)o colours indicating mean metallicities similar to those expected based on previous spectroscopic work. The stellar population models of Maraston (2003) and Brocato et al. (2000) are consistent with both subpopulations being old, and with metallicities of [Fe/H] –1.5 and –0.6 for the blue and red subpopulations respectively. The models of Worthey (1994) do not reproduce the (U–B)o colours of the red (metal-rich) subpopulation for any modelled age.
For NGC 3379 we detect a blue subpopulation with similar colours and presumably age/metallicity, to that of the Milky Way and M31 globular cluster systems. The red subpopulation is less well defined, perhaps due to increased photometric errors, but indicates a mean metallicity of [Fe/H] –0.6.
keywords:
globular clusters: general – galaxies: individual: NGC 3379 – galaxies: star clusters.1 Introduction
In the last few years, it has become clear that globular cluster (GC)
systems have complex colour distributions, indicating two or more
subpopulations within a single elliptical galaxy (Ashman & Zepf
1992; Secker et al. 1995; Whitmore et al. 1995; Geisler et al. 1996;
Forbes, Brodie & Huchra 1997; Bridges et al. 1997; Kissler-Patig
& Gebhardt 1998; Kundu & Whitmore 2001; Larsen et al. 2001).
The subpopulations have different metallicities and possibly ages,
indicating multiple epochs or mechanisms of formation. As GCs
are thought to
trace the star formation and chemical enrichment episodes of
their host galaxy (e.g. Forbes & Forte 2001),
understanding how they formed will provide important constraints
on the process of galaxy formation and evolution. The main
scenarios for GC formation include:
The merger
of two gas–rich (spiral) galaxies may lead to the formation of an
elliptical galaxy and create an additional population of GCs in
the process (Ashman & Zepf 1992). Since the GCs
produced in the merger formed from
enriched gas they should be of higher metallicity and
thus redder than the indigenous (metal-poor) GC population.
Thus we expect a metal-poor old population (13 Gyrs)
plus a metal-rich young
population with an age similar to that of the merger itself.
A
multi–phase collapse (Forbes, Brodie & Grillmair 1997)
can also produce two distinct GC populations. Here the blue GCs
formed in an early chaotic phase of galaxy formation from metal-poor gas
and the red GCs later from enriched gas
in the same
phase that produces the bulk of the galaxy starlight.
A multi–phase collapse also predicts an old metal-poor subpopulation and
one a slightly younger ( age 2–4 Gyr) metal-rich one.
Coté,
Marzke & West (1998) describe the build-up of the GC systems of bright
ellipticals via the accretion of mostly metal-poor GCs from dwarf
galaxies. In this picture the metal-rich GCs are indigenous and
the metal-poor ones are acquired. Here both the GC subpopulations
will be about the same age (i.e. old) but with different metallicities.
Formation of GC systems
in hierarchical merging is described
in Beasley et al. (2002). In this prescription blue GCs form in
pre-galactic clumps. These gaseous clumps merge generating a
second generation of red GCs, along with galactic star
formation. Late stage mergers of more stellar
clumps may include accreted GCs. Thus the hierarchical picture
contains elements of the other three. In a hierarchical Universe,
the metal-poor GCs will
be old with the metal-rich GCs having a mean age that
depends on galaxy mass and environment.
Perhaps the best direct test of these competing GC formation models is to determine the mean age and metallicity of the GC subpopulations for a large number of galaxies. In principle, the best way to do this is from GC spectra. Indeed this is an active area of research using the world largest telescopes, and is returning exciting new results (e.g. Kissler-Patig et al. 1998; Forbes et al. 2001; Larsen et al. 2002; Beasley et al. 2003). However it is also very time consuming. Photometry is more efficient, but optical colours suffer from the well-known age-metallicity degeneracy. This situation can be improved by extending photometry to the near-infrared (e.g. Puzia et al. 2002) or ultra-violet. Photometry in the U (3600Å) band is very rare for GC systems beyond the Local Group (the 70 GCs in NGC 5128 with U-band photometry from Rejkuba 2001 is one exception). This is largely due to the poor blue response of most CCDs in use today and the low fraction of U-band light emitted by old stellar populations such as GCs.
Here we present UBRI photometry of GCs associated with the Leo Group galaxy NGC 3379, obtained with the blue sensitive CCDs of the Isaac Newton Telescope 2.5 m Wide Field Camera. By extending the traditional optical photometry to bluer U-band wavelengths, we can better probe the metallicity distribution of the GC system in NGC 3379. We also utilise some smaller field-of-view images taken with the Gemini North 8m telescope to aid in the selection of GC candidates.
NGC 3379 (M105) is a moderate luminosity E1 galaxy in the nearby (D = 11.5 Mpc, m–M = 30.30) Leo Group. In a photographic study of NGC 3379, Harris & van den Bergh (1981) estimated a total GC population of 290 150. This translates into a low specific frequency SN of 1.1 0.6 (assuming MV = –21.06). Ajhar et al. (1994) obtained VRI CCD images of NGC 3379 detecting some 60 GCs. However, they did not detect any obvious bimodality in the GC colour distribution. The first clear detection of bimodality came from the HST study by Larsen et al. (2001). They found peaks at (V–I)o = 0.96 and 1.17 for the blue and red subpopulations respectively. Throughout this paper we adopt .
2 Observations and data reduction
Broadband UBRI images covering the Leo galaxies NGC 3379, NGC 3384 and NGC 3389 were obtained using the 2.5 m Isaac Newton Telescope (INT) on 2000 February 6th and 8th. The Wide Field Camera (WFC) comprises 4 thinned EEV 4096x2048 CCDs, with pixels of 0.33 and provides a field-of-view of approximately 30 30 arcmin. Observing conditions were photometric over the two nights with seeing of 1.5 in U and I bands and 2.2 in B and R bands. The total exposure times were roughly 2000 s (U), 3000 s (B), 1500 s (R) and 1000 s (I). In addition to the galaxy observations, several standard star fields from Landolt (1992) were obtained over both nights which bracket the galaxy observations.
Basic data reduction was performed using IRAF and specially written software by A. Terlevich. This consisted of master bias subtraction, non-linear correction, flat-fielding using combined sky flats, alignment and co-addition of individual frames. The galaxy frames and standard stars were reduced in an identical manner. Raw magnitudes of between 10 and 30 stars were obtained for each filter using the IRAF task QPHOT, after determining the optimal aperture size. The zero point for each filter was determined by a simple linear fit to the stellar raw magnitudes versus stellar colour and a correction for airmass. The airmass extinction coefficients of KU = 0.46, KB = 0.22, KR = 0.08 and KI = 0.04 mag/airmass have been taken from the INT WFC web page. The final airmass corrected, one second zero points are ZU = 22.98 0.01, ZB = 24.84 0.02, ZR = 24.65 0.02 and ZI = 23.96 0.01. The BRI zero points compare well with those determined by Mills et al. (2003) from the same observing run and the zero points listed on the INT/WFC web page. An independent estimate of the U band zero point (ZU = 22.98 0.05) was made by F. Reda (2002, priv. comm.) by comparing various aperture magnitudes for NGC 3379 to that listed in Hypercat (http://www-obs.univ-lyon1.fr/hypercat/). Finally, we adjusted these zero points for Galactic extinction using values from the NASA Extragalactic Database (http://ned.ipac.caltech.edu), i.e. AU = 0.132, AB = 0.105, AR = 0.065, AI = 0.047.
3 Galaxy Modelling
In order to better reveal the inner GCs, we subtracted a model of NGC 3379. Galaxy subtraction was performed using the STSDAS ISOPHOTE package (see Forbes & Thomson 1992). A galaxy model, with a varying centre, ellipticity and position angle, was fit in all four filters. Isophotes were modelled out to 350 (20 kpc). A 3 sigma-clip criterion over 5 iterations was used to remove deviant pixels (e.g. bright objects) from the fit. The model-subtracted images were visually inspected and iterated if necessary to provide a smooth transition from the background level to the model-subtracted region. The resulting residual images made it easier to identify the inner GCs.


4 Initial Object Finding and Selection
The four filter (i.e. UBRI) images of the Leo galaxy triplet were aligned to within a fraction of a pixel and trimmed using the IMALIGN task. We then used DAOFIND to select GC candidates in each filter independently. Selection criteria consisted of a S/N threshold of 6 and PSF FWHM adjusted to the seeing conditions in each filter. Additionally, roundness criteria ranging between values of -1.0 and 1.0, and a sharpness range of 0 to 1.0 provided good exclusion of extended objects. The resulting database of GC candidates consisted of over 3,000 objects for each filter. The PHOT task was used to measure the magnitude and error of each object in all four bands as found by DAOFIND. A simple script was written to perform the first stage of filtering and reduce the number of candidates to only those detected in all four bands. This spatial coordinate matching reduced the dataset to 1,200 objects with measured UBRI magnitudes. The same script determined galactocentric coordinates for each object based on the galaxy centre taken from the galaxy model (with the centre position constant within a fraction of a pixel). The reduced candidate list was then visually inspected to eliminate the small number of remaining galaxy-like extended objects or CCD artifacts.
5 Milky Way and M31 Globular Cluster Colours
To aid in the selection and interpretation of Leo group GCs, we use observations of Milky Way and M31 GCs (essentially the only two galaxies that have well-studied GC systems in the U-band). Data for the Milky Way GC system comes from the compilation of Harris (1996). From this list de-reddened U, B, and I-band photometry exists for 95 GCs. Data for the M31 GC system come from Barmby et al. (2000). De-reddened magnitudes for 148 GCs were supplied by Barmby (2003, priv. comm.). In Fig. 1 we show the (U–B)o vs (B–I)o colour distribution for the Milky Way and M31 GC systems. To our knowledge this is the first time the (U–B)o vs (B–I)o colour distribution for the GCs of these galaxies have been examined together.

The data define a relatively tight distribution in this plot covering a range of 1.5 mags in each colour, with the M31 GCs extending to slightly redder colours. In general, the distributions for the two galaxies are qualitatively similar. However we do note that the slope of the Milky Way distribution (U–B)o = 0.725(B–I)o–1.047 (rms = 0.088), is somewhat flatter than that for M31 (U–B)o = 1.202(B–I)o–1.850 (rms = 0.122). This may represent intrinsic differences in the GC systems of the two galaxies, but is more likely to be due to the uncertain reddening corrections that have been applied. Both galaxies reveal a dominant grouping of blue GCs, with a less well-defined tail to redder colours. We associate the former with the metal-poor GC subpopulation and the latter with the metal-rich GC subpopulation in these galaxies. The location of these subpopulations in colour space will be discussed in more detail below. Noting the general similarities of the two distributions, we have combined the Milky Way and M31 GC samples to define a mean GC colour-colour distribution. This is shown in Fig. 2. A least squares fit to the combined sample is also shown. The best fit line is of the form (U–B)o = 0.94 (B–I)o - 1.39, with an rms spread about the best fit of 0.12 mag. We use this colour-colour relation and spread to help us define the colours expected for GCs in NGC 3379.

6 Globular Clusters in the Central Region of NGC 3379
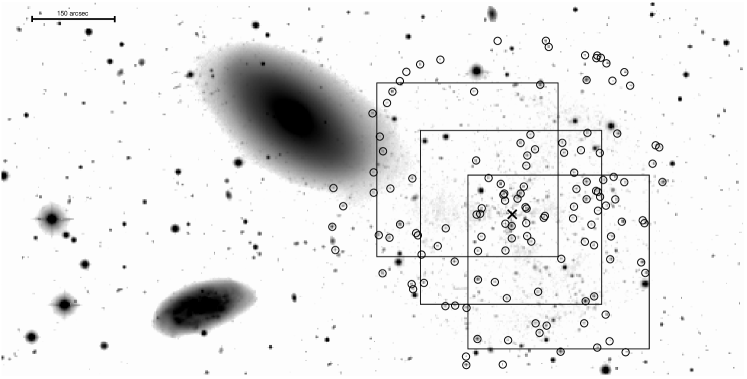
Images of the central regions of NGC 3379 have been taken with the GMOS instrument on the Gemini North Telescope in 2003 February. Three fields, each covering 5 arcminutes near the galaxy centre, were observed as shown in Fig. 3. These images, in Sloan filters g, r and i, form the pre-acquisition imaging for an upcoming spectroscopic run. As they were obtained under excellent seeing conditions (0.7) the expected contamination rates for candidate GCs based on the Gemini data will be significantly less than for the INT data (obtained under 2 seeing). Candidate GCs from the Gemini data have been selected on the basis of their size (i.e. compactness) and colour ( and ) by Faifer & Forte (2003, priv. comm.).
By spatially matching the Gemini object list with the initial INT object list (described above), we identified 125 matches. In Fig. 4 we show a colour-magnitude diagram for these Gemini-selected objects, with magnitudes taken from our INT photometry. Next we restricted the object list in B magnitude. An upper limit of B = 19 was chosen to exclude bright stars and/or compact dwarf galaxies. This limit is 4 brighter than the expected GC turnover magnitude for NGC 3379, and corresponds to MB = –11.3. We also imposed a lower magnitude cutoff of B = 23, to avoid any colour bias in the sample. These selection criteria are also shown in Fig. 4.

The resulting subset in a (U–B)o vs (B–I)o colour-colour diagram is shown in Fig.5. This figure also shows the region of expected colours for GCs. The region ranges from 1.0 (B–I)o 2.4, and within 0.7 magnitudes in (U–B)o of the mean Milky Way plus M31 fit. The (B–I)o range was chosen to be similar to that of the Milky Way and M31, i.e. covering the full metallicity range expected of GCs but allowing for an additional 0.25 mag in AV reddening. The range in (U–B)o corresponds to the scatter seen in the combined Milky Way and M31 datasets of 0.12 mag, added in quadrature with our typical (U–B)o photometric error. Most of the data lie in the defined region, indicating that the contamination in the Gemini data is indeed low. The data show a group of blue GCs with values (U–B)o 0.1 and (B–I)o 1.65. A second, red subpopulation is difficult to clearly identify.
If we examine only the (B–I)o colours of the objects within the colour selected region, we then obtain the histogram shown in Fig. 6. Visually, and via a KMM statistical test (Ashman, Bird & Zepf 1994), the Gemini GC candidates are clearly bimodal. The peaks are located at (B–I)o = 1.65 and 1.90.
7 Large Area Study of the NGC 3379 Globular Cluster System


In order to extend our study beyond the central few arcminutes of NGC 3379 (i.e. that covered by the Gemini imaging), we now return to the INT imaging. We restrict candidate GCs to lie within 5.5 (18 kpc) in galactocentric radius, as beyond this radius we no longer witness a decline in the surface density of detected objects (see Fig. 7). Thus the majority of objects interior to this radius appear to be associated with NGC 3379. This radial selection also ensures there are very few, if any GCs associated with NGC 3384 (projected separation of 7.2) in our final object list.

We then applied the same B magnitude selection (i.e. 19 Bo 23) as above. The resulting GC candidates in (U–B)o vs (B–I)o colour space are shown in Fig. 8. Like the Gemini-selected objects, our large area sample reveals a small number of blue GCs with colours at (U–B)o 0.1, (B–I)o 1.65, but no strong red grouping.
We find 133 candidate GCs within the colour selected region. The measured magnitudes and positions of these objects are listed in Appendix A. How does this final number compare with the total number of GCs estimated by Harris & van den Bergh (1981) of 290 150 ? Our data have complete radial coverage (with the possibility of missing a few GCs in the very inner regions) but clearly under-sample the GC luminosity function. We reach magnitudes similar to, or slightly brighter than, the expected turnover magnitude. Thus crudely we expect a factor of 2–2.5 more GCs than we detected, i.e. 266–333.
Examination of the colour selected region however suggests that it contains a number of background objects, i.e. objects with a wide range of (B–I)o colours and a mean (U–B)o colour of about –0.5. These were not generally seen in the Gemini-selected data, and are presumably not GCs but background galaxies. So the total number of GCs in NGC 3379 may be closer to 250 than 300. Both values are consistent with the low GC specific frequency found by Harris & van den Bergh (1981).

In order to further investigate this issue we have defined a background region of the same central area as studied above but located at a galactocentric radius of more than 13.3 (44 kpc). The background objects, after B magnitude selection, are shown in Fig. 9. Indeed these background objects cover a range in (B–I)o with a mean (U–B)o of about –0.5. In Fig. 10 we show the (B–I)o colour distribution for GC candidates before and after statistical background subtraction. Two GC subpopulations are revealed with peaks around (B–I)o 1.65 and 1.90. As with the Gemini-selected data, the blue subpopulation is easily identified in both colour-colour space and in the (B–I)o distribution. However, the red subpopulation is only clearly identified in the (B–I)o distribution.
8 Globular Cluster Mean Ages and Metallicities
In order to interpret our data on NGC 3379 we compare it to similar data for the Milky Way and M31 GC systems. To aid in this interpretation we have created smoothed colour density plots using a Gaussian smoothing kernel. In Fig. 11 we show the density plots for the MW and M31 (i.e. a smoothed version of Fig. 1), with a background-subtracted density plot from the large area coverage of NGC 3379 (i.e. Fig. 7 minus Fig. 8).
We first discuss the Milky Way and M31 GC systems. For the Milky Way, the data reveals the dominant blue subpopulation at (U–B)o = 0.04 and (B–I)o = 1.51, with an uncertainty in the peak location of 0.05. The red subpopulation is harder to define as it contains fewer GCs. However a small enhancement can be seen at (U–B)o 0.35 and (B–I)o 1.81. The distribution for M31 is similar to the Milky Way. We estimate the dominant blue subpopulation to be at (U–B)o = 0.12 and (B–I)o = 1.62 0.05. The red subpopulation appears to have a centre around (U–B)o = 0.45 and (B–I)o = 1.90 0.05.
An empirical transformation between (U–B)o and (B–I)o to [Fe/H] is given by Barmby et al. (2000). Barmby et al. calculated these transformations based on spectroscopic metallicities for 80 Milky Way GCs. Using these transformations we can calculate ‘photometric metallicities’ based on our colour estimates. These are summarised in Table 1. The mean metallicity of the two subpopulations from spectroscopy are [Fe/H] = –1.59, –0.55 and –1.40, –0.58 for the Milky Way and M31 respectively (Forbes et al. 2000). Table 1 shows a good correspondence between our photometric and the spectroscopic metallicities.
We find that the mean colours (metallicities) of the M31 GC system are redder (more metal-rich) than that of the Milky Way’s GC system. This is also the situation for the spectroscopically-defined metallicities. This is consistent with the mass (luminosity) of the Milky Way being less than that for M31, as per the galaxy luminosity - GC metallicity relation (Forbes & Forte 2001; Larsen et al. 2001).
| Table 1. Globular Cluster Metallicities | |||
|---|---|---|---|
| Spectra | (U–B)o | (B–I)o | |
| Milky Way | |||
| Metal-poor | –1.59 | –1.75 | –1.73 |
| Metal-rich | –0.55 | –0.89 | –0.89 |
| M31 | |||
| Metal-poor | –1.40 | –1.53 | –1.42 |
| Metal-rich | –0.58 | –0.62 | –0.64 |
| NGC 3379 | |||
| Metal-poor | – | –1.64 | –1.36 |
| Metal-rich | – | – | –0.6 |
Fig. 11 also includes model tracks from Brocato et al. (2000) and Maraston (2003, priv. comm.) for a 15 Gyr old single stellar population (SSP). We find that the 15 Gyr old tracks are closer to the location of the metal-rich subpopulation than say the 12 Gyr, or younger, model tracks (the metal-poor subpopulation is equally well fit by a 15 or 12 Gyr old track). Assuming the difference is purely in the U–B colour, the models are too blue by 0.1–0.15 magnitudes. Given a mean age for Milky Way GCs from colour-magnitude diagrams of around 12 Gyrs (e.g. Salaris & Weiss 2002), it suggests that these SSP models are not yet on the correct absolute age scale. The tracks show a range of metallicities for a 15 Gyr old population. The Milky Way blue subpopulation has a peak close to a metallicity of [Fe/H] = –1.5, with the M31 blue GCs between [Fe/H] = –1.5 and –1.0. For both galaxies, the red subpopulation lies between [Fe/H] = –0.3 and –1.3.
We have also compared the SSP models of Worthey (1994) with our data and find that the Worthey models fall well below the location of the metal-rich subpopulation for any age. A detailed comparison between the various stellar population models is beyond the scope of this paper. However, the origin of the large differences between the U–B colours of the Worthey models, and those of Brocato et al. and Maraston, seem to lie in a combination of the theoretical isochrones adopted (those from Vandenberg 1985; Green et al. 1987 in the case of the Worthey models) and the conversion between luminosity/temperature to magnitude/colour in the observational plane. The Worthey models achieved this by multiplying observed stellar fluxes by empirical filter transmission functions, whilst Maraston employ a combination of empirical and theoretical colour-temperature relations (see Maraston 1998). As discussed by Brocato et al. (2000), variations in other model ingredients such as the IMF slope and low-mass cut-off do not significantly affect the predicted integrated colours. In any event, regardless of the specific origin of these discrepancies, we conclude that the U–B colours of the Worthey models do not accurately reflect the colours of globular clusters.
Turning now to NGC 3379. The colour density plot for NGC 3379 clearly shows a blue GC subpopulation near (U–B)o = 0.08 0.05 and (B–I)o = 1.64 0.05. The plot also shows some remaining galaxy contamination with (U–B)o –0.3. The colours of these objects are consistent with late-type spirals and blue compact dwarfs (Schroeder & Visvanathan 1996). A red GC subpopulation is not obvious; it is only revealed when the distribution in (B–I)o colour only is examined (see also Figures 5 and 9). We believe this is due to the larger mean error in our U–B colours for the metal-rich subpopulation (although the presence of an intermediate-aged population could also contribute). From the colour-magnitude diagram (Fig. 4), it can be seen that the red subpopulation is fainter on average by about half a magnitude than the blue one (this is presumably due to additional line blanketing in the more metal-rich GCs). Larsen et al. (2001) also found evidence for the red GCs being systematically fainter than the blue ones. For their small sample of 21 blue and 24 red GCs, they estimated V-band turnover magnitudes of 22.57 for the blue GCs and 23.02 for the red GCs. For NGC 3379, this results in an additional colour error of 0.3 mags for the metal-rich subpopulation. This effect may be spreading out the (fainter) metal-rich subpopulation. Our B–I colour errors are generally half those in U–B, and hence are less affected. If we consider (B–I)o colour only, i.e. the histograms of Figures 6 (Gemini selected) and 10 (INT selected), then we estimate that the red subpopulation has a mean colour of (B–I)o 1.9.
The intrinsic U–B and B–I colours of the blue subpopulation in NGC 3379 are intermediate between those of the Milky Way and M31 GC systems. The Barmby et al. (2000) transformation leads to a photometric metallicity of [Fe/H] = –1.64 0.14 from (U–B)o and –1.36 0.14 from (B–I)o for the blue subpopulation. This is consistent with the metallicity indicated by the Maraston ([Fe/H] –1.35) and Brocato et al. ([Fe/H] –1.5) 15 Gyr SSP tracks. The photometric metallicity for the red subpopulation, based on (B–I)o colour only, is estimated to be [Fe/H] –0.6. These values are summarised in Table 1.
The ages of the GC subpopulations in NGC 3379 are less well constrained by our data. However, similarities between NGC 3379 and the Milky Way and M31 GC colours suggests that the blue subpopulation in all three galaxies has a similar, old age. From the colour-magnitude diagram of Fig. 4, the red subpopulation in NGC 3379 is fainter in the mean than the blue GCs. This effectively rules out a young (i.e. 3 Gyr) age.
9 Conclusions
Magnitudes and colours, from the Isaac Newton Telescope, for 133 candidate globular clusters around NGC 3379 are presented. Our detection rate is consistent with a low specific frequency. These candidates, and a subsample selected from imaging with the Gemini North Telescope, reveal evidence for a blue and red subpopulation.
We have compared the (U–B)o vs (B–I)o colours of the NGC 3379 globular cluster system with that for the Milky Way and M31. The Milky Way and M31 reveal similar GC colour distributions, although with slightly different slopes (which may simply be the result of uncertain reddening corrections). The metal-poor and metal-rich subpopulations can be seen as a dominant blue and a less well-defined red peak. Using the single stellar population models of Maraston (2003, priv. comm.) and Brocato et al. (2000), we find that the mean colours of both subpopulations are best reproduced by their 15 Gyr old tracks. Even so, small colour differences between the model and the measurements exist. As the mean age of the Milky Way globular clusters is thought to be closer to 12 Gyrs, it suggests that these model require a relative age adjustment. The estimated mean metallicities of the two subpopulations are very similar to those measured previously from spectroscopy. We also investigated the models of Worthey (1994), and found they were unable to reproduce the (U–B)o colour of the metal-rich subpopulation in M31 and the Milky Way for any age.
For NGC 3379 we detect a blue subpopulation with very similar (U–B)o and (B–I)o colours, and presumably age/metallicity, to that of the Milky Way and M31 globular cluster systems. Thus the blue GCs in NGC 3379 are consistent with being very old and with a mean metallicity of [Fe/H] –1.5. The red subpopulation is less well-defined, perhaps due to increased photometric errors, but has a similar mean (B–I)o colour to the Milky Way and M31 globular cluster systems. This implies a mean photometric metallicity of [Fe/H] –0.6.
10 Acknowledgments
We thank M. Pierce and J. Strader for useful comments. We also
thank A. Terlevich for his help in observing and
the initial data reduction. The data used in this project were
obtained with Isaac Newton Telescope at La Palma Observatory and
the Gemini North Telescope.
This research has made use of the NASA/IPAC Extragalactic
Database (NED) which is operated by the Jet Propulsion
Laboratory, California Institute of Technology, under contract
with the National Aeronautics and Space Administration.
References
- [1]
- [2] Ashman, K. A., Bird, C. M., Zepf, S. E., 1994, AJ, 108, 2348
- [3]
- [4] Ashman, K. M., Zepf S. E., 1992, ApJ, 384, 50
- [5]
- [6] Ajhar, E. A., Blakeslee, J. P., Tonry, J. L., 1994, AJ, 108, 2087
- [7]
- [8] Barmby, P., Huchra J. P., Brodie, J. P., Forbes, D. A., Schroder, L. L., Grillmair, C. J., 2000, AJ, 119, 727
- [9]
- [10] Beasley, M. A., Baugh, C. M., Forbes, D. A., Sharples, R. M., Frenk, C. S., 2002, MNRAS, 333, 383
- [11]
- [12] Beasley, M. A., Forbes, D., Brodie, J., Kissler-Patig, M., 2003, MNRAS, submitted
- [13]
- [14] Bridges, T. J., Ashman, K. M., Zepf, S. E., Carter, D., Hanes, D. A., Sharples, R. M., Kavelaars, J. J., 1997, MNRAS, 284, 376
- [15]
- [16] Brocato, E., Castellani, V., Poli, F., Raimondo, G., 2000, A&AS, 146, 91
- [17]
- [18] Cote, P., Marzke, R. O., West, M. J., 1998, ApJ, 501, 554
- [19]
- [20] Forbes, D. A., Thomson, R. C., 1992, MNRAS, 254, 723
- [21]
- [22] Forbes, D. A., Brodie, J. P., Huchra, J., 1997, AJ, 113, 887
- [23]
- [24] Forbes, D. A., Brodie, J. P., Grillmair, C. J., 1997, AJ, 113, 1652
- [25]
- [26] Forbes, D. A., Grillmair, C. J., Williger, G. M., Elson, R. A. W., Brodie, J. P., 1998, MNRAS, 293, 325
- [27]
- [28] Forbes, D. A., Masters, K. L., Minniti, D., Barmby, P., 2000, A&A, 358, 471
- [29]
- [30] Forbes, D. A., Forte J. C., 2001, MNRAS, 322, 257
- [31]
- [32] Forbes, D. A., Beasley, M. A., Brodie, J. P., Kissler-Patig, M., 2001, ApJ Lett., 563, 143
- [33]
- [34] Geisler, D., Lee, M. G., Kim, E., 1996, AJ, 111, 1529
- [35]
- [36] Green, E. M., Demarque, P., King, C. R., 1987, The Revised Yale isochrones and Luminosity Functions, New Haven: Yale Observatory.
- [37]
- [38] Harris, W. E., van den Bergh, S., 1981, AJ, 86, 1981
- [39]
- [40] Harris, W. E., 1996, AJ, 112, 1487
- [41]
- [42] Kundu, A., Whitmore, B. C., 2001, AJ, 122, 1251
- [43]
- [44] Kissler-Patig, M., Gebhardt, K., 1998, AJ, 116, 2237
- [45]
- [46] Landolt, A. U., 1992, PASP, 104, 336
- [47]
- [48] Larsen, S. S., Brodie, J. P., Huchra, J. P., Forbes, D. A., Grillmair, C. J., 2001, AJ, 121, 2974
- [49]
- [50] Larsen, S. S., Brodie, J. P., Beasley, M. A., Forbes, D. A., 2002, AJ, 124, 828
- [51]
- [52] Maraston, C., 1998, MNRAS, 300, 872
- [53]
- [54] Puzia, T. H., Zepf, S. E., Kissler-Patig, M., Hilker, M., Minniti, D., Goudfrooij, P., 2002, A&A, 391, 453
- [55]
- [56] Rejkuba, M., 2001, A&A, 369, 812
- [57]
- [58] Salaris, M., Weiss, A., 2002, A&A, 388, 492
- [59]
- [60] Secker, J., Geisler, D., McLauglin, D. E., Harris, W. E., 1995, AJ, 109, 1019
- [61]
- [62] Schroeder, A., Visvanathan, N. 1996, A&AS, 1181, 441
- [63]
- [64] Schlegel, D. J., Finkbeiner, D. P., Davis, M., 1998, ApJ, 500, 525
- [65]
- [66] Vandenberg, D. A., Bell, R. A., 1985, ApJS, 58, 561
- [67]
- [68] Worthey, G., 1994, ApJS, 95, 107
- [69]
- [70] Whitmore, B. C., Sparks, W. B., Lucas, R. A., Macchetto, F. D., Biretta, J. A., 1995, ApJ Lett., 454, 73
- [71]
| Table A1. Candidate Globular Clusters around NGC 3379 | |||||||
|---|---|---|---|---|---|---|---|
| ID | RA | Dec. | U | B | R | I | B–I |
| (J2000) | (J2000) | (mag) | (mag) | (mag) | (mag) | (mag) | |
| 001 | 10:48:11.36 | +12:34:32.14 | 20.18 | 20.17 | 18.79 | 18.16 | 2.00 |
| 002 | 10:48:11.22 | +12:35:42.37 | 21.93 | 22.30 | 20.96 | 20.46 | 1.84 |
| 003 | 10:48:10.99 | +12:33:50.10 | 20.92 | 21.29 | 20.02 | 19.41 | 1.89 |
| 004 | 10:48:10.04 | +12:35:09.40 | 21.28 | 21.66 | 20.65 | 19.94 | 1.73 |
| 005 | 10:48:06.50 | +12:37:57.63 | 22.36 | 21.68 | 20.25 | 19.43 | 2.25 |
| 006 | 10:48:06.36 | +12:36:10.70 | 22.18 | 22.58 | 21.42 | 20.84 | 1.74 |
| 007 | 10:48:06.35 | +12:35:33.91 | 22.33 | 22.66 | 21.29 | 20.86 | 1.80 |
| 008 | 10:48:05.74 | +12:34:17.05 | 21.34 | 21.65 | 20.43 | 19.73 | 1.92 |
| 009 | 10:48:05.61 | +12:37:15.56 | 23.08 | 22.98 | 21.13 | 20.60 | 2.37 |
| 010 | 10:48:05.28 | +12:33:07.97 | 21.08 | 21.56 | 20.62 | 20.08 | 1.48 |
| 011 | 10:48:05.22 | +12:36:48.93 | 21.16 | 21.62 | 20.65 | 20.09 | 1.54 |
| 012 | 10:48:04.74 | +12:38:16.43 | 22.41 | 23.00 | 21.73 | 21.87 | 1.13 |
| 013 | 10:48:04.44 | +12:34:12.39 | 21.62 | 21.67 | 20.55 | 20.28 | 1.39 |
| 014∗ | 10:48:04.33 | +12:35:41.48 | 23.18 | 22.69 | 21.38 | 20.75 | 1.95 |
| 015∗ | 10:48:04.09 | +12:38:36.88 | 20.54 | 20.85 | 19.85 | 19.34 | 1.51 |
| 016 | 10:48:03.19 | +12:38:56.00 | 22.83 | 22.69 | 21.24 | 21.41 | 1.28 |
| 017 | 10:48:03.17 | +12:34:36.48 | 20.32 | 20.66 | 19.92 | 19.57 | 1.09 |
| 018 | 10:48:02.40 | +12:39:12.83 | 22.53 | 22.95 | 21.73 | 21.39 | 1.56 |
| 019 | 10:48:01.77 | +12:32:48.29 | 21.77 | 22.02 | 20.80 | 20.19 | 1.83 |
| 020∗ | 10:48:01.68 | +12:35:59.72 | 21.81 | 21.66 | 20.56 | 19.99 | 1.67 |
| 021 | 10:48:01.59 | +12:32:39.15 | 22.15 | 22.60 | 21.84 | 21.30 | 1.29 |
| 022 | 10:48:01.23 | +12:34:20.79 | 23.14 | 22.80 | 21.82 | 21.03 | 1.77 |
| 023 | 10:48:01.01 | +12:34:16.68 | 23.27 | 22.89 | 21.78 | 20.65 | 2.24 |
| 024 | 10:48:00.74 | +12:39:26.23 | 21.25 | 21.55 | 20.76 | 20.54 | 1.01 |
| 025 | 10:48:00.57 | +12:33:41.88 | 22.77 | 23.00 | 21.89 | 21.73 | 1.27 |
| 026∗ | 10:48:00.28 | +12:32:50.55 | 21.53 | 21.67 | 20.35 | 19.63 | 2.04 |
| 027∗ | 10:47:58.61 | +12:33:57.32 | 22.85 | 22.50 | 21.72 | 20.94 | 1.55 |
| 028 | 10:47:58.29 | +12:39:34.80 | 22.29 | 22.38 | 21.63 | 21.10 | 1.28 |
| 029 | 10:47:57.68 | +12:32:08.49 | 21.71 | 22.25 | 21.48 | 21.01 | 1.24 |
| 030∗ | 10:47:57.64 | +12:34:29.41 | 23.34 | 22.84 | 21.83 | 21.49 | 1.35 |
| 031∗ | 10:47:56.56 | +12:33:29.09 | 21.06 | 21.16 | 20.02 | 19.63 | 1.52 |
| 032 | 10:47:56.51 | +12:32:09.45 | 21.51 | 22.37 | 21.73 | 21.28 | 1.09 |
| 033 | 10:47:55.19 | +12:30:37.16 | 22.71 | 22.76 | 21.76 | 21.25 | 1.50 |
| 034 | 10:47:55.16 | +12:30:21.77 | 20.19 | 20.53 | 19.79 | 19.38 | 1.16 |
| 035 | 10:47:55.13 | +12:32:05.35 | 21.38 | 21.69 | 21.01 | 20.10 | 1.59 |
| 036∗ | 10:47:54.21 | +12:38:36.91 | 23.08 | 22.78 | 21.98 | 21.43 | 1.35 |
| 037∗ | 10:47:53.97 | +12:36:32.31 | 22.36 | 21.69 | 20.47 | 19.75 | 1.95 |
| 038∗ | 10:47:53.91 | +12:34:54.28 | 23.25 | 22.66 | 21.50 | 21.14 | 1.52 |
| 039 | 10:47:53.81 | +12:31:09.03 | 20.05 | 20.28 | 19.49 | 19.16 | 1.12 |
| 040 | 10:47:53.75 | +12:32:56.42 | 20.60 | 20.89 | 19.66 | 18.98 | 1.91 |
| 041∗ | 10:47:53.74 | +12:33:48.33 | 22.47 | 22.27 | 21.09 | 20.65 | 1.62 |
| 042∗ | 10:47:53.48 | +12:34:55.67 | 21.88 | 21.67 | 20.68 | 20.14 | 1.53 |
| 043∗ | 10:47:53.32 | +12:34:14.15 | 22.61 | 22.62 | 21.44 | 20.72 | 1.90 |
| 044∗ | 10:47:53.29 | +12:35:05.76 | 23.23 | 22.53 | 21.01 | 20.38 | 2.14 |
| 045∗ | 10:47:52.46 | +12:36:00.51 | 23.14 | 22.25 | 20.75 | 20.02 | 2.23 |
| 046 | 10:47:51.71 | +12:32:52.10 | 22.78 | 22.89 | 21.58 | 20.79 | 2.10 |
| 047 | 10:47:51.37 | +12:40:08.89 | 22.24 | 22.73 | 21.56 | 21.08 | 1.65 |
| 048∗ | 10:47:50.99 | +12:35:49.78 | 20.78 | 20.75 | 19.53 | 19.05 | 1.71 |
| 049 | 10:47:50.75 | +12:30:22.69 | 21.93 | 22.17 | 21.24 | 20.73 | 1.44 |
| 050∗ | 10:47:50.68 | +12:35:30.07 | 21.49 | 21.31 | 20.13 | 19.57 | 1.74 |
| 051∗ | 10:47:50.56 | +12:35:32.43 | 21.57 | 21.35 | 20.15 | 19.39 | 1.96 |
| 052∗ | 10:47:50.47 | +12:35:19.56 | 22.49 | 22.44 | 21.37 | 20.53 | 1.91 |
| 053∗ | 10:47:50.43 | +12:34:37.76 | 22.18 | 21.83 | 20.65 | 20.39 | 1.44 |
| 054∗ | 10:47:50.42 | +12:33:49.17 | 22.53 | 22.04 | 20.84 | 20.39 | 1.65 |
| 055 | 10:47:50.26 | +12:32:22.91 | 21.59 | 22.41 | 21.30 | 21.25 | 1.16 |
| 056 | 10:47:50.10 | +12:31:06.72 | 22.42 | 22.76 | 21.75 | 21.39 | 1.37 |
| 057∗ | 10:47:49.67 | +12:34:33.57 | 20.22 | 20.11 | 18.88 | 18.42 | 1.69 |
| 058∗ | 10:47:49.66 | +12:34:11.20 | 22.82 | 22.24 | 20.80 | 19.94 | 2.30 |
| 059∗ | 10:47:48.96 | +12:35:23.11 | 21.50 | 21.66 | 20.68 | 20.43 | 1.23 |
| Table A1. Candidate Globular Clusters around NGC 3379 | |||||||
|---|---|---|---|---|---|---|---|
| ID | RA | Dec. | U | B | R | I | B–I |
| (J2000) | (J2000) | (mag) | (mag) | (mag) | (mag) | (mag) | |
| 060 | 10:47:48.60 | +12:37:03.83 | 21.72 | 21.77 | 20.79 | 20.27 | 1.50 |
| 061 | 10:47:48.59 | +12:35:32.40 | 20.98 | 21.15 | 20.25 | 19.77 | 1.38 |
| 062∗ | 10:47:48.20 | +12:35:45.07 | 21.59 | 21.70 | 20.45 | 19.98 | 1.72 |
| 063∗ | 10:47:48.00 | +12:35:07.78 | 21.29 | 21.67 | 20.38 | 20.10 | 1.57 |
| 064∗ | 10:47:47.91 | +12:34:38.75 | 21.94 | 22.34 | 20.86 | 20.94 | 1.40 |
| 065∗ | 10:47:47.90 | +12:36:22.85 | 23.01 | 22.79 | 21.82 | 21.55 | 1.24 |
| 066∗ | 10:47:47.87 | +12:35:05.17 | 21.61 | 21.54 | 20.41 | 19.86 | 1.68 |
| 067∗ | 10:47:47.80 | +12:34:15.41 | 22.84 | 21.94 | 20.51 | 19.99 | 1.95 |
| 068∗ | 10:47:47.78 | +12:36:41.23 | 21.62 | 21.90 | 20.73 | 20.00 | 1.90 |
| 069 | 10:47:47.40 | +12:37:19.00 | 22.38 | 22.63 | 21.81 | 20.87 | 1.76 |
| 070∗ | 10:47:47.30 | +12:34:05.47 | 22.86 | 22.59 | 21.39 | 20.60 | 1.98 |
| 071 | 10:47:46.85 | +12:36:52.44 | 21.85 | 22.21 | 21.50 | 20.87 | 1.34 |
| 072 | 10:47:46.78 | +12:31:37.35 | 21.92 | 22.34 | 22.11 | 20.81 | 1.53 |
| 073 | 10:47:46.48 | +12:32:34.57 | 22.12 | 22.50 | 21.38 | 21.16 | 1.34 |
| 074 | 10:47:46.30 | +12:31:19.99 | 21.95 | 21.86 | 20.73 | 20.49 | 1.37 |
| 075 | 10:47:46.22 | +12:38:49.41 | 20.19 | 20.61 | 19.33 | 18.87 | 1.75 |
| 076∗ | 10:47:45.79 | +12:34:48.40 | 21.99 | 21.99 | 20.63 | 20.15 | 1.84 |
| 077∗ | 10:47:45.65 | +12:34:51.91 | 21.73 | 22.00 | 20.79 | 20.07 | 1.93 |
| 078 | 10:47:45.54 | +12:40:08.99 | 20.81 | 21.32 | 20.42 | 19.97 | 1.35 |
| 079 | 10:47:45.44 | +12:31:33.17 | 21.57 | 21.80 | 21.03 | 20.58 | 1.22 |
| 080 | 10:47:45.19 | +12:39:57.83 | 21.40 | 21.65 | 20.89 | 20.52 | 1.13 |
| 081 | 10:47:43.76 | +12:30:45.96 | 20.07 | 20.18 | 19.09 | 18.40 | 1.78 |
| 082∗ | 10:47:43.67 | +12:33:34.16 | 22.32 | 22.47 | 21.26 | 21.41 | 1.06 |
| 083∗ | 10:47:43.55 | +12:37:04.17 | 22.20 | 22.34 | 21.35 | 21.11 | 1.23 |
| 084∗ | 10:47:43.34 | +12:36:46.37 | 22.58 | 22.34 | 21.09 | 20.79 | 1.55 |
| 085∗ | 10:47:42.25 | +12:34:47.47 | 22.51 | 22.49 | 21.30 | 20.82 | 1.67 |
| 086 | 10:47:42.14 | +12:35:08.62 | 21.99 | 22.62 | 21.87 | 21.46 | 1.15 |
| 087∗ | 10:47:42.11 | +12:36:10.11 | 22.31 | 22.34 | 21.14 | 20.34 | 2.00 |
| 088∗ | 10:47:41.84 | +12:35:40.68 | 23.10 | 22.26 | 21.12 | 20.50 | 1.76 |
| 089∗ | 10:47:41.30 | +12:36:50.81 | 22.91 | 22.87 | 21.80 | 21.24 | 1.63 |
| 090 | 10:47:40.91 | +12:31:37.45 | 21.54 | 22.08 | 21.51 | 20.81 | 1.26 |
| 091∗ | 10:47:40.82 | +12:34:05.12 | 22.01 | 22.47 | 21.29 | 20.75 | 1.72 |
| 092 | 10:47:40.80 | +12:39:42.82 | 21.54 | 21.86 | 20.68 | 20.33 | 1.53 |
| 093 | 10:47:40.73 | +12:32:17.44 | 19.61 | 19.70 | 18.79 | 18.42 | 1.28 |
| 094 | 10:47:40.61 | +12:38:57.95 | 19.74 | 19.93 | 18.98 | 18.44 | 1.49 |
| 095∗ | 10:47:40.61 | +12:35:22.13 | 20.50 | 20.60 | 19.59 | 19.09 | 1.51 |
| 096∗ | 10:47:40.60 | +12:35:53.78 | 20.94 | 20.91 | 19.87 | 19.28 | 1.63 |
| 097 | 10:47:40.51 | +12:37:22.36 | 22.43 | 22.26 | 21.05 | 20.70 | 1.56 |
| 098 | 10:47:40.03 | +12:34:36.04 | 22.68 | 22.83 | 21.57 | 20.80 | 2.03 |
| 099∗ | 10:47:39.71 | +12:33:58.78 | 22.64 | 22.17 | 20.98 | 20.41 | 1.76 |
| 100∗ | 10:47:39.70 | +12:32:26.12 | 20.82 | 20.76 | 19.55 | 19.02 | 1.74 |
| 101 | 10:47:39.47 | +12:35:37.17 | 21.30 | 21.75 | 20.85 | 20.60 | 1.15 |
| 102 | 10:47:39.44 | +12:39:37.58 | 22.54 | 22.26 | 20.96 | 20.08 | 2.18 |
| 103 | 10:47:39.33 | +12:30:53.43 | 22.11 | 21.90 | 20.33 | 19.63 | 2.27 |
| 104 | 10:47:39.32 | +12:39:42.28 | 21.91 | 22.14 | 21.15 | 20.43 | 1.71 |
| 105 | 10:47:39.24 | +12:35:35.50 | 21.49 | 21.91 | 20.87 | 20.21 | 1.69 |
| 106∗ | 10:47:39.24 | +12:35:01.26 | 23.30 | 22.95 | 21.53 | 21.37 | 1.58 |
| 107 | 10:47:39.01 | +12:36:45.95 | 22.66 | 22.52 | 21.37 | 20.42 | 2.10 |
| 108 | 10:47:38.98 | +12:35:26.48 | 22.84 | 22.68 | 21.10 | 20.34 | 2.34 |
| 109 | 10:47:38.89 | +12:39:38.32 | 22.50 | 22.50 | 21.91 | 20.97 | 1.53 |
| 110 | 10:47:38.60 | +12:35:57.03 | 22.01 | 22.42 | 21.39 | 20.62 | 1.79 |
| 111 | 10:47:38.31 | +12:31:53.19 | 21.45 | 21.44 | 20.28 | 19.79 | 1.65 |
| 112∗ | 10:47:38.28 | +12:35:10.56 | 21.96 | 22.44 | 21.17 | 20.69 | 1.75 |
| 113 | 10:47:38.21 | +12:39:28.19 | 20.90 | 20.98 | 20.00 | 19.56 | 1.42 |
| 114 | 10:47:37.84 | +12:31:04.88 | 22.59 | 22.70 | 21.19 | 20.80 | 1.90 |
| 115 | 10:47:37.76 | +12:33:33.40 | 21.32 | 21.07 | 19.75 | 19.09 | 1.98 |
| 116∗ | 10:47:37.66 | +12:34:14.78 | 21.80 | 21.82 | 21.32 | 20.47 | 1.35 |
| 117 | 10:47:37.49 | +12:38:56.74 | 22.23 | 22.77 | 22.28 | 21.65 | 1.13 |
| 118 | 10:47:37.34 | +12:36:02.54 | 21.61 | 21.96 | 20.66 | 20.33 | 1.63 |
| 119∗ | 10:47:37.14 | +12:35:21.82 | 22.00 | 22.03 | 20.80 | 20.02 | 2.01 |
| 120 | 10:47:36.91 | +12:37:21.02 | 21.81 | 20.93 | 19.46 | 18.84 | 2.09 |
| Table A1. Candidate Globular Clusters around NGC 3379 | |||||||
|---|---|---|---|---|---|---|---|
| ID | RA | Dec. | U | B | R | I | B–I |
| (J2000) | (J2000) | (mag) | (mag) | (mag) | (mag) | (mag) | |
| 121 | 10:47:36.35 | +12:34:41.33 | 20.08 | 20.35 | 19.57 | 19.20 | 1.14 |
| 122 | 10:47:36.06 | +12:35:53.02 | 22.10 | 22.23 | 21.08 | 20.63 | 1.61 |
| 123 | 10:47:36.05 | +12:39:12.20 | 21.92 | 21.22 | 19.53 | 18.86 | 2.36 |
| 124 | 10:47:35.89 | +12:30:45.05 | 21.96 | 22.03 | 20.77 | 20.22 | 1.81 |
| 125 | 10:47:35.35 | +12:38:47.74 | 21.49 | 21.81 | 21.25 | 20.46 | 1.35 |
| 126∗ | 10:47:34.01 | +12:33:27.75 | 21.21 | 20.29 | 18.66 | 18.00 | 2.28 |
| 127∗ | 10:47:33.83 | +12:34:43.89 | 23.07 | 22.53 | 21.17 | 20.62 | 1.90 |
| 128 | 10:47:33.62 | +12:34:38.74 | 21.16 | 21.33 | 20.14 | 19.42 | 1.91 |
| 129 | 10:47:33.51 | +12:33:08.65 | 21.03 | 21.38 | 20.18 | 19.62 | 1.76 |
| 130 | 10:47:32.63 | +12:36:26.46 | 21.43 | 21.67 | 21.13 | 20.51 | 1.15 |
| 131 | 10:47:32.27 | +12:36:59.72 | 20.95 | 21.09 | 19.91 | 19.30 | 1.79 |
| 132 | 10:47:31.83 | +12:36:56.07 | 21.87 | 22.25 | 21.08 | 20.70 | 1.55 |
| 133 | 10:47:31.44 | +12:35:53.33 | 20.07 | 20.45 | 19.29 | 18.61 | 1.84 |
Notes:∗ = Globular cluster present in the Gemini selected object lists. Galaxy centre is RA = 10:47:49.6, Dec. = +12:34:55 (J2000).