Spatial Separation of the 3.29 µm Emission Feature
and Associated 2 µm Continuum in NGC 7023
Abstract
We present a new 09 resolution 3.29 µm narrowband image of the reflection nebula NGC 7023. We find that the 3.29 µm infrared emission feature (IEF) in NGC 7023 is brightest in narrow filaments northwest of the illuminating star HD 200775. These filaments have been previously seen in images of extended red emission, , near-infrared H2 emission lines, the 6.2 µm and 11.3 µm IEFs, and HCO+. We also detect 3.29 µm IEF emission faintly but distinctly between the filaments and the star. The 3.29 µm IEF image is in marked contrast to narrowband continuum images at 2.09 µm, 2.14 µm, and 2.18 µm, which show an extended emission peak midway between the filaments and the star, and much fainter emission near the filaments. The [2.18 µm][3.29 µm] color shows a wide variation, ranging from colors of 3.4-3.6 mag at the 2 µm continuum emission peak to a color of 5.5 mag in the 3.29 µm IEF emission filaments. A color of 5.5 mag is 1 mag higher than any published value in reflection nebulae. We observe [2.18 µm][3.29 µm] to increase smoothly with increasing projected distance from the illuminating star in NGC 7023, up until the brightest 3.29 µm IEF filament, suggesting that the main difference between the spatial distributions of the 2 µm continuum and the 3.29 µm IEF emission is related to the incident stellar flux. The 3.29 µm IEF is widely attributed to an aromatic C−H stretch, while the 2 µm continuum emission may be due to transient heating of tiny grains, fluorescence of aromatic molecules, or photoluminescence of larger grains. Our results suggest that the 3.29 µm IEF carriers are likely to be distinct from, but related to, the 2 µm continuum emitters. Our finding also imply that, in NGC 7023, the 2 µm continuum emitters are mainly associated with H I, while the 3.29 µm IEF carriers are primarily found in warm H2, but that both the 2 µm continuum emitters and the 3.29 µm IEF carriers can survive in H I or H2.
1 Introduction
The 3.29 µm infrared emission feature (IEF), discovered in the planetary nebula NGC 7027 (catalog ) (Merrill, Soifer, & Russell, 1975), is the shortest wavelength IEF among what used to be known as “the unidentified infrared features.” The IEFs are observed at 3.29 µm, 6.2 µm, 7.7 µm, 8.6 µm, 11.3 µm, and 12.7 µm. Duley & Williams (1981) were the first to suggest that the 3.29 µm IEF is due to the stretching mode of an aromatic () C−H. This identification is now widely accepted (see reviews by Allamandola, Tielens, & Barker, 1989; Puget & Léger, 1989; Sellgren, 1990, 1994; Papoular et al., 1996; Tokunaga, 1997; Geballe, 1997; Salama, 1999).
The 3.29 µm IEF emission in visual reflection nebulae, such as NGC 7023 (catalog ), has always been observed to be accompanied by near-infrared (NIR) continuum emission at 2-4 µm (Sellgren, Werner, & Dinerstein, 1983; Sellgren, 1984; Jourdain de Muizon, d’Hendecourt, & Geballe, 1990a, b; Sellgren, Werner, & Allamandola, 1996; Joblin et al., 1996), which is not due to reflected starlight (Sellgren, Werner, & Dinerstein, 1992). The temperature of dust grains in equilibrium with the incident stellar radiation for these visual reflection nebulae is observed to be far too low to produce any detectable NIR radiation (Harvey, Thronson, & Gatley, 1980; Whitcomb et al., 1981; Castelaz, Sellgren, & Werner, 1987; Sellgren, Luan, & Werner, 1990a; Casey, 1991; Young Owl et al., 2002). Observations of NGC 7023 at 55-400 µm, in particular, are best fit by an equilibrium dust temperature of 50 K (Whitcomb et al., 1981; Casey, 1991), in clear disagreement with the characteristic temperature, 1000 K, of the NIR continuum emission (Sellgren et al., 1983; Sellgren, 1984). This NIR continuum emission in visual reflection nebulae has been attributed to single stellar photons that transiently heat tiny (1 nm radius) grains to high temperature (Sellgren et al., 1983; Sellgren, 1984); to vibrational or electronic fluorescence from polycyclic aromatic hydrocarbon (PAH) molecules (Léger & Puget, 1984; Allamandola, Tielens, & Barker, 1985, 1989); or to photoluminescence of larger hydrogenated amorphous carbon (HAC) grains or carbon nanoparticles (Duley & Williams, 1988; Duley, 1988, 2001).
When an ultraviolet (UV) source, such as a hot star, illuminates a molecular cloud, it forms a photodissociation region (PDR; also referred to as a photon-dominated region) where absorption of UV photons in the Lyman-Werner bands (91.2-110 nm) of molecular hydrogen (H2) dissociate H2. These same photons also pump fluorescent quadrupole ro-vibrational H2 emission lines, and thus fluorescent H2 emission delineates the H I /H2 transition region in a PDR. Observations of the Orion Bar (catalog ), the PDR adjoining the southeastern ionization front of the Orion Nebula (catalog ) (Sellgren, Tokunaga, & Nakada, 1990b; Tielens et al., 1993), and of the planetary nebula NGC 7027 (Graham et al., 1993), have shown that the 3.29 µm IEF emission is strongest between the H II region ionization front (traced by H recombination lines) and the H I /H2 dissociation front (traced by fluorescent H2 emission lines).
Here we present a new high-resolution (09) narrowband 3.29 µm image of the bright reflection nebula NGC 7023, and compare the spatial distribution of the 3.29 µm IEF emission to those of other prominent NIR emission components such as the NIR continuum emission near 2 µm and the 1–0 S(1) H2 emission line at 2.12 µm (this paper; Lemaire et al., 1996).
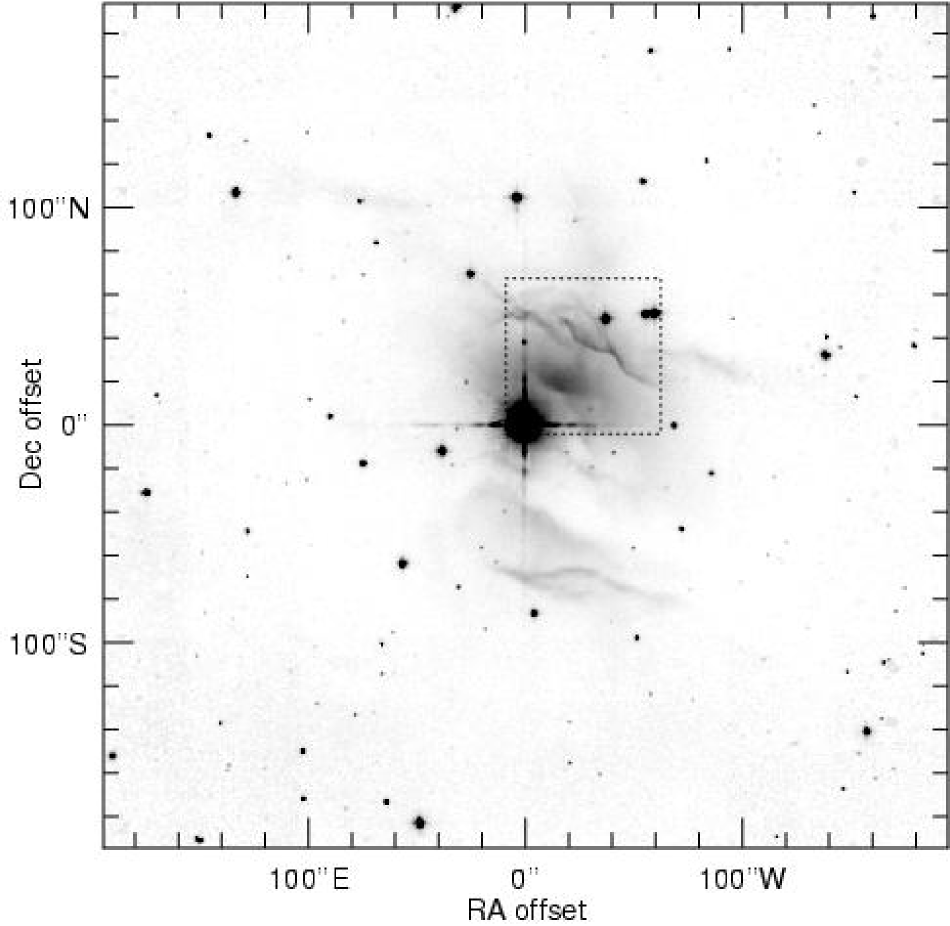
NGC 7023, at a distance of (van den Ancker et al., 1997), is one of the best-studied reflection nebulae and is also one of the first objects in which the NIR continuum emission accompanying the 3.29 µm IEF emission was detected (Sellgren et al., 1983). It is a part of a much larger molecular cloud, illuminated by the pre-main sequence Herbig Be star HD 200775 (catalog ), with an effective temperature = 17,000 K (Strom et al., 1972; Baschek et al., 1982). The (broadband 2.1 µm) image of NGC 7023 (Fig. 1; see also Sellgren et al., 1992), which contains a mixture of 2 µm continuum emission, 2 µm scattered starlight, and H2 line emission, is dominated by extended nebulosity northwest of HD 200775, and by two filamentary structures, northwest and south/southwest of the star. Various previous imaging studies show that these two groups of filaments are also seen in the extended red emission (Witt & Schild, 1988; Watkin, Gledhill, & Scarrott, 1991), fluorescent H2 emission lines (Lemaire et al., 1996; Takami et al., 2000), IEFs at 6.2 µm and 11.3 µm (Cesarsky et al., 1996), and HCO+ emission (Fuente et al., 1996). These filaments are believed to be the interface between the molecular cloud, traced by CO emission (Gerin et al., 1998), and photodissociated H2, traced by the 21 cm H I line, surrounding the star (Fuente et al., 1996). The filaments may represent high density (as high as ) clumps embedded in somewhat lower density gas () at the H I /H2 interface (Fuente et al., 1996; Lemaire et al., 1996; Martini, Sellgren, & Hora, 1997, 1999; Takami et al., 2000).
2 Observations and Data Reduction
Table Spatial Separation of the 3.29 µm Emission Feature and Associated 2 µm Continuum in NGC 7023 summarizes the observations for the data presented in this paper.
We obtained an image of NGC 7023 at 3.29 µm with the 3 m NASA Infrared Telescope Facility (IRTF) at Mauna Kea, Hawaii, during an IRTF service observing run. The total integration time on source is 12 minutes. The central position of the field is 26″ W 32″ N of the illuminating star HD 200775, and was selected so as to include all the northwest filaments and the central star. The data were reduced in the usual way: sky subtraction and flat field correction. The sky was observed in an ABBA pattern, chopping between the target field and a field 5′ N every 20 seconds. Sky images were used for flat fields as well. The final image was formed by combining 40 individual frames using a median filter to increase the signal-to-noise ratio (S/N), and an average -clipping algorithm was used during the combination to reject bad pixels. The final image shows a strong ghost image (instrumental reflected light) of HD 200775 at the diagonally opposite corner (near 48″ W 60″ N) of its real position, but the contamination is confined to a small region where the 3.29 µm IEF emission is faint or absent. Imaging at (broadband 3.8 µm) was also attempted during the same night and at the same site, but failed due to the saturation of the array by the high sky background at the 0295 scale.
Images of 1–0 S(1) H2 line emission at 2.12 µm and of the 2.1 µm continuum emission were derived from three NIR narrowband (1%) filter images at 2.09 µm, 2.12 µm, and 2.14 µm. These images were obtained on the Perkins 1.8 m Telescope at Lowell Observatory, Flagstaff, Arizona. After standard reduction procedures (sky subtraction and flat field correction), the image of the underlying continuum emission at 2.1 µm was constructed by combining the 2.09 µm and 2.14 µm images, wavelengths which are free of H2 emission lines (Martini et al., 1997, 1999). To obtain an image of the 1–0 S(1) H2 emission line, the 2.1 µm continuum image was subtracted from the 2.12 µm image after the continuum had been properly scaled to have on average the same counts for ten unsaturated stars in the field, which are believed not to have H2 emission.
In addition, Lemaire et al. (1996) kindly provided us with their high-resolution reduced narrowband (1%) filter images of NGC 7023 at 2.12 µm and 2.18 µm. Their images cover all of the field of our 3.29 µm image of NGC 7023. The images exhibit some instrumental artifacts, notably ghost images of HD 200775 including one near 66″ N of the star, and a row of bad pixels running 34″ N of HD 200775. We subtracted the 2.18 µm image from the 2.12 µm image to create an image of the 1–0 S(1) H2 emission line.
We obtained images of NGC 7023 at on the University of Hawaii (UH) 2.2 m telescope at Mauna Kea, Hawaii (Sellgren et al., 1992). Dome flats were taken and used for the flat field correction. A sky image was constructed from a median-filtered combination of 8 images of offsets at 200″ and 224″ from HD 200775. The nebula image was constructed from a mosaic of 17 images at offsets of 0″, 30″, 71″, 100″, and 141″ from HD 200775. The sky image was subtracted from each of the 17 nebula images before constructing the final mosaic image. Bad pixel masks were used to correct cosmic rays and failed pixels during the combination.
We also obtained archival Hubble Space Telescope (HST) images with the Wide Field Planetary Camera 2 (WFPC2; Burrows, 1995) of NGC 7023 (Stapelfeldt et al., 1997; Gordon et al., 2000) in F606W (a wide -band). Between two available WFPC2 fields, the one centered near 56″ W 7″ N of HD 200775 covers the field containing most nebulosity around the northwest filaments on two of its wide-field camera chips (WF3 and WF4). The adjacent high-resolution (PC) chip has significant instrumental artifacts from HD 200775, but these did not cross over to the WF chips.
For comparison among different images, each was geometrically transformed using IRAF routines to have the same orientation and scale as those of the final 3.29 µm image. After these geometric registrations, the images were measured to be aligned with each other better than 01 in orientation, and scaled to the same pixel scale to within 0.2% in magnification (scale) difference.
3 Images of NGC 7023
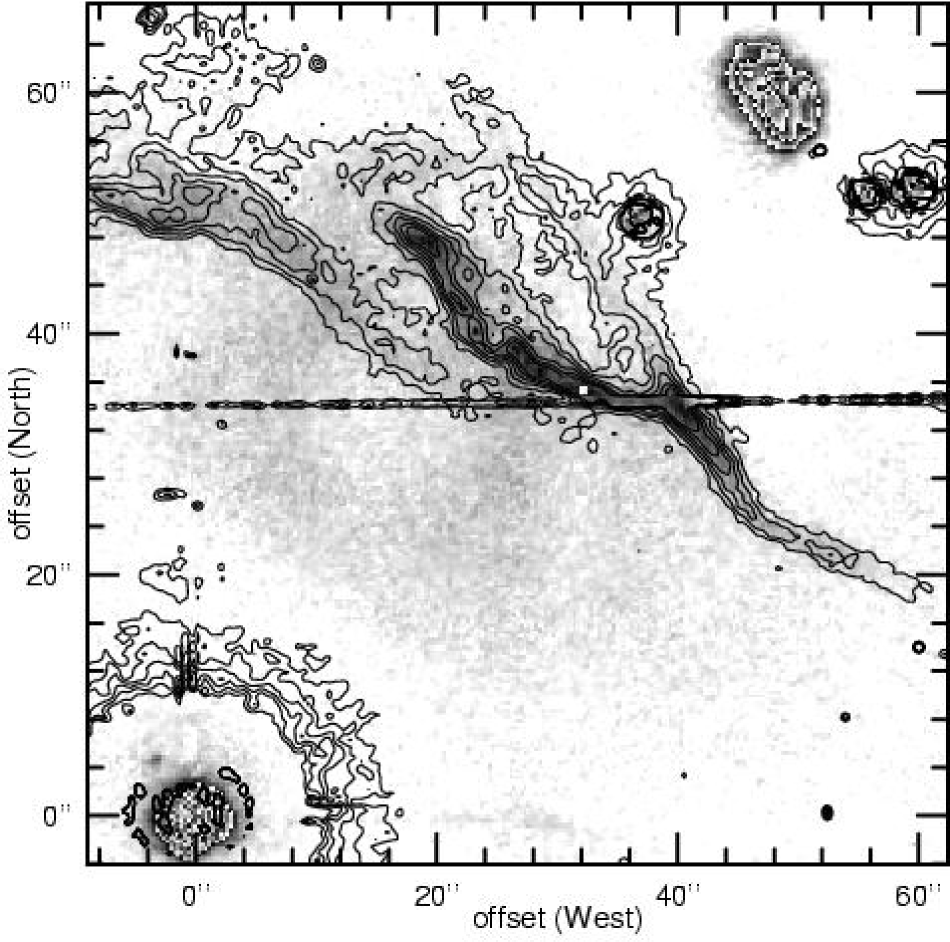
Figure 1 displays our image of NGC 7023. This mosaic of images covers 6565 (0.81 pc 0.81 pc, or 810 mpc 810 mpc, where 1 mpc = 1 milliparsec = 206 AU), centered on HD 200775. Note that this covers more area than the image of Sellgren et al. (1992), who presented a single 3232 (400 mpc 400 mpc) array image centered on HD 200775 (their Fig. 2). The nebulosity is mainly concentrated northwest of HD 200775, except for diffuse filamentary structures 1′ (130 mpc) south/southwest of the star. Here, we focus our study on the northwestern part of NGC 7023, represented by a rectangular box overlaid on Figure 1, which corresponds to the field covered by our 3.29 µm image.
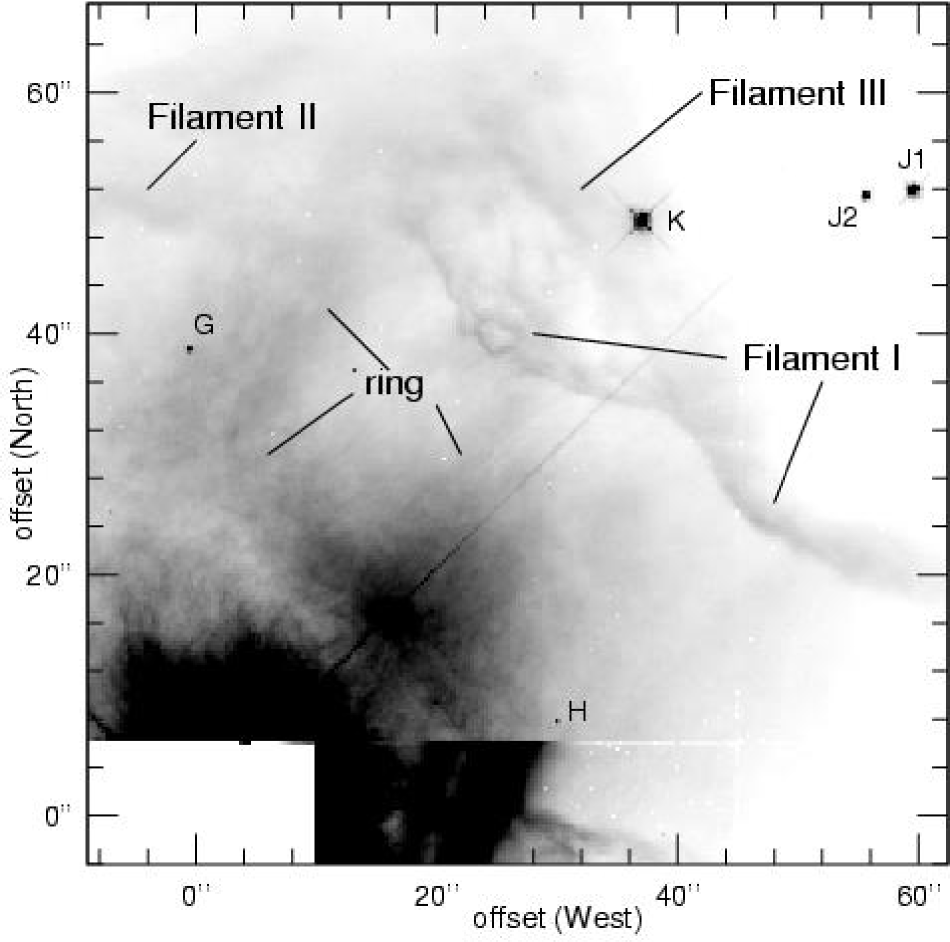
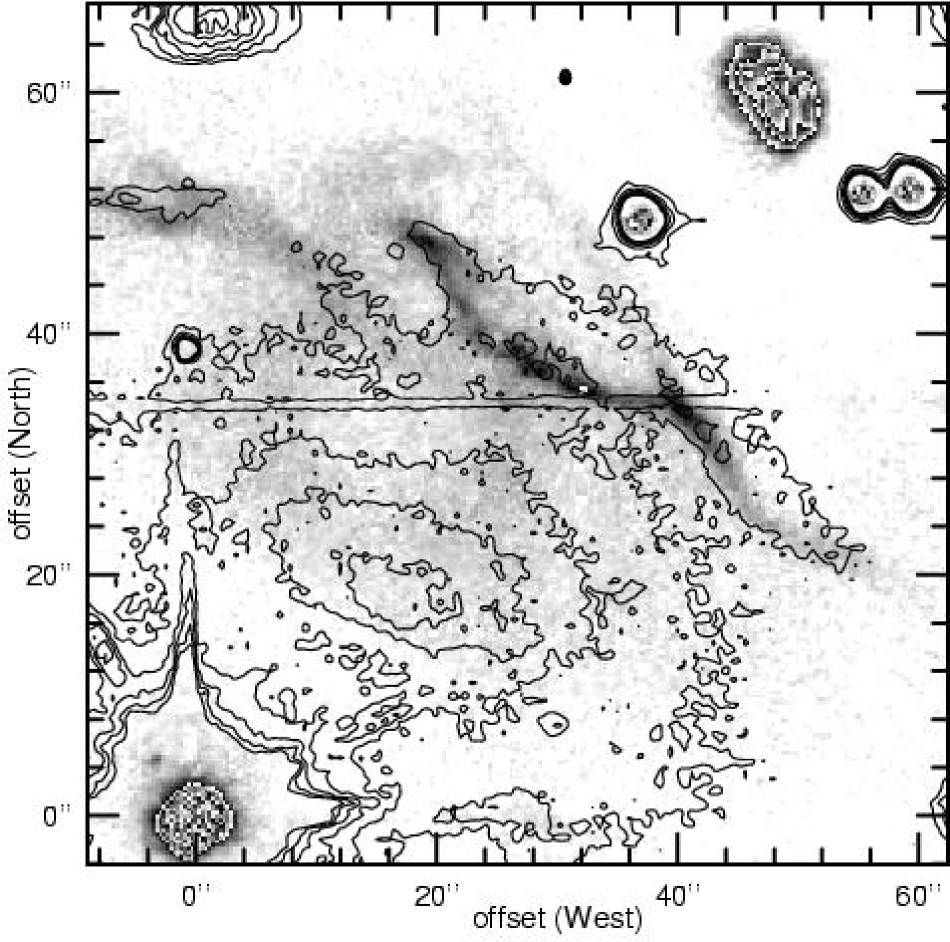
Figure 2 shows the archival HST/WFPC2 F606W image (Stapelfeldt et al., 1997; Gordon et al., 2000) of the northwestern part of NGC 7023, for the region indicated by the box in Figure 1. Figure 2 shows three distinct filaments (labeled Filaments I, II, and III) and their substructures, a concentrated nebulosity closer to the illuminating star, and a diffuse “ring”-shaped structure between them (labeled ‘the ring’).
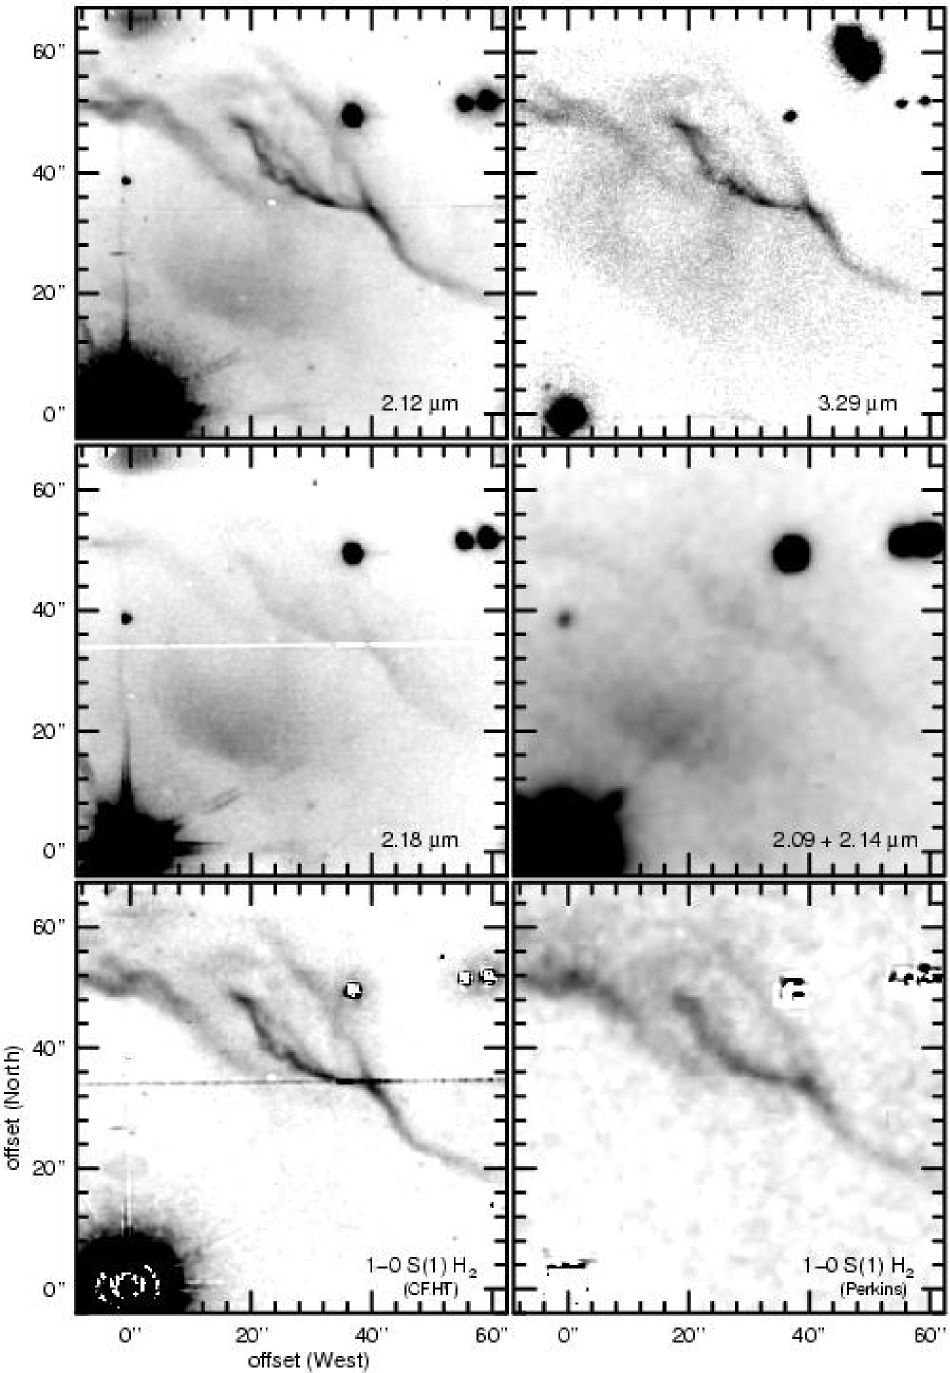
In Figure 3, we present images of NGC 7023 for the same region as Figure 2 obtained with different narrowband filters at 2.09 µm, 2.12 µm, 2.14 µm, 2.18 µm, and 3.29 µm. Comparison of these images as well as (Fig. 1) and optical (Fig. 2) images indicates that the relative contributions of different nebular components, such as scattered starlight, NIR continuum emission, and H2 line emission, vary with wavelength and therefore do not have identical spatial distributions.
The stars seen in Figures 1-3 are predominantly pre-main sequence stars (Sellgren, 1983), as is HD 200775 (Herbig, 1960). We detect five point sources in the field of Figure 2 other than HD 200775. The brightest among them is the star near 37″ W 49″ N of HD 200775 (Star K in Table IIa of Sellgren, 1983). Star J, as identified by Sellgren (1983), is resolved into a visual pair separated by a projected distance of 4″ (8 mpc or 1700 AU), one near 55″ W 51″ N (J2) and the other near 59″ W 52″ N (J1) of HD 200775. The stars near 1″ E 39″ N and near 30″ W 8″ N of HD 200775 (stars G and H, respectively, after the nomenclature of Sellgren, 1983), were not detected by Sellgren (1983), but are clearly observed at both optical and NIR wavelengths (Figs. 1-3).
3.1 the 2.12 µm 1–0 S(1) H2 line
Lemaire et al. (1996) have already published an image of NGC 7023 in the 2.12 µm 1–0 S(1) H2 emission line, along with images at 2.12 µm (H2 line + continuum) and 2.18 µm (continuum), observed with CFHT. Takami et al. (2000) have also published images of NGC 7023 in other H2 emission lines. In Figure 3, we reproduce the Lemaire et al. (1996) images, as well as our new 1–0 S(1) H2 line image of NGC 7023, for the same region as our 3.29 µm image.
In both H2 emission line images (Fig. 3), the only noticeable spatial structures are filaments northwest of HD 200775, also seen in (Fig. 1; Sellgren et al., 1992). No significant H2 emission is detected in the region between the star and the filaments, where diffuse nebulosity appears in 2 µm continuum images (Fig. 3; Sellgren, 1986; Martini et al., 1999). These H2 filaments are found to extend over much greater lengths when observed with a wider field of view than Figure 3 (Fig. 1; Sellgren et al., 1992; Lemaire et al., 1996; Takami et al., 2000). Wider field images also show another H2 filament 60″ south/southwest of HD 200775, almost parallel to the northwest filaments shown in Figures 1-3.
Fuente et al. (1996) compare their interferometric image of HCO+, which traces dense molecular gas, with the image of Sellgren et al. (1992). They find that the HCO+ is confined to filaments northwest of HD 200775. Fuente et al. (1996) show the HCO+ filaments spatially coincide with filaments (Sellgren et al., 1992), while Lemaire et al. (1996) show the filaments are due to fluorescent H2 emission, which contributes H2 line emission to the broadband filter. Fuente et al. (1996) detect four kinematically separate filaments, with radial velocities between 1.9 and . The relationship between the kinematically distinct HCO+ filaments of Fuente et al. (1996) and Filaments I, II, and III, as defined in Figure 2, is complex. Emission from kinematically distinct filaments coincides spatially, presumably due to projection effects, and Fuente et al. (1996) do not detect Filament III in HCO+. Fuente et al. (1996) argue that the HCO+ filaments are due to increased gas density, not increased gas column density. They also conclude that some filaments are embedded in molecular gas while others are embedded in neutral gas.
3.2 the 3.29 µm infrared emission feature
Figure 3 shows our 3.29 µm image of NGC 7023 along with various narrowband images of NGC 7023 near 2 µm. The most prominent spatial structures in the 3.29 µm image are filaments which spatially coincide with filaments in the 1–0 S(1) H2 images. The 3.29 µm IEF is close in wavelength to the 1–0 O(5) H2 emission line at 3.234 µm, but this H2 line falls outside the 1.5-2.0% CVF bandpass at 3.29 µm and therefore does not contaminate our 3.29 µm image.
One can easily trace three filaments in our 3.29 µm image (Fig. 3). Filaments I, II, and III (defined in Fig. 2) appear to be spatially distinct, although they do not correspond to the four kinematically distinct filaments of HCO+ (Fuente et al., 1996). The maximum 3.29 µm surface brightness (Fig. 3) is observed in Filament I. Filament II, to the east of Filament I and 50″ N of HD 200775, is much fainter and apparently wider at 3.29 µm than Filament I, in contrast to the H2 images. Filament III, which appears as a northern branch of Filament I, is much fainter at 3.29 µm than the other two filaments, but it is nevertheless clearly traceable. Much of the detailed filamentary structure in the 3.29 µm image is very similar to that seen in images of F606W (Fig. 2), the 1–0 S(1) H2 emission line at 2.12 µm (Fig. 3), and (Fig. 1).
In addition to the filaments, diffuse nebulosity at 3.29 µm is observed closer to HD 200775, forming a clear “ring”-shaped spatial structure at projected distances from the star of 25-50″ (52-100 mpc). A similar structure is also seen in the optical image, but it is much fainter and its shape is not identical to the ring in the 3.29 µm image. The diffuse nebulosity at 3.29 µm is located primarily between the filaments and the central star and is only faintly detected farther from the star than the filaments.
Our efforts to correct the 3.29 µm image for 3.3 µm continuum emission, by obtaining an image and combining it with a 2 µm continuum image to interpolate a 3.3 µm continuum image, were unsuccessful due to the high sky background at . Previous studies, however, that have quantified the relative strengths of the 3.29 µm IEF emission to the underlying continuum emission, establish that the 3.3 µm continuum contributes less than 20% to narrowband 3.29 µm photometry at all observed positions in NGC 7023 (Sellgren et al., 1983, 1996). We therefore believe that our 3.29 µm image is dominated by 3.29 µm IEF emission.
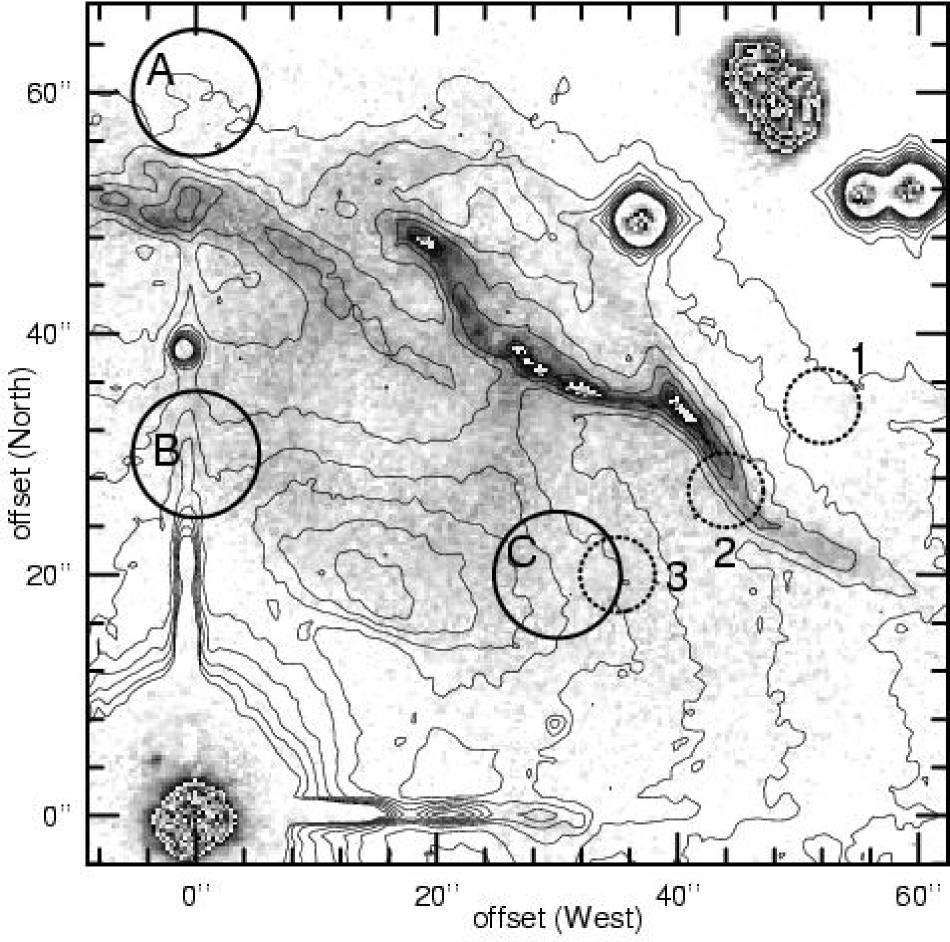
Figure 4 illustrates positions, overlaid on our 3.29 µm image, where previous photometry and spectrophotometry have quantified the contribution of the underlying 3.3 µm continuum surface brightness to the total observed surface brightness at 3.29 µm (hereafter ). At position C in Figure 4, the 3.0-3.7 µm spectrophotometry of Sellgren et al. (1983) implies = 14%. For all other positions plotted on Figure 4, we derive from surface photometry at (broadband 2.2 µm), narrowband 3.29 µm, and of Sellgren et al. (1996). We interpolate the continuum at 3.3 µm at each position from and data (Sellgren et al., 1996), assuming that the continuum emission between 2.2 µm and 3.8 µm can be approximated by a power-law (Sellgren et al., 1983, 1985, 1996). We find that = 18%, 13%, 12%, 10%, and 17%, at positions A, B, 1, 2, and 3, respectively. Note that most positions illustrated in Figure 4 fall on diffuse 3.29 µm IEF emission, with = 12-18%, except for Position 2, which falls on Filament I and has = 10%. These published observations demonstrate that the 3.29 µm IEF emission accounts for of the emission in our 3.29 µm image.
3.3 the 2 µm continuum
Narrow-band images at 2.09 µm and 2.14 µm (shown as a combination in Fig. 3), and at 2.18 µm (Lemaire et al., 1996, also shown in Fig. 3) are at wavelengths free of H2 emission lines (Martini et al., 1999), and thus represent the 2 µm continuum emission. Apart from differences in seeing and a few isolated instrumental artifacts, the two images of the 2 µm continuum emission shown in Figure 3 display a very similar morphology. While neither 2 µm continuum image in Figure 3 has been corrected for instrumental scattered light, they were obtained on different telescopes, with different cameras and different orientations of the diffraction spikes of HD 200775 on the image. Hence, their similarity implies that the main morphological structures in each image are intrinsic to NGC 7023 and are not artifacts of the telescope, the infrared camera, or the instrumental scattered light.
The 2 µm continuum emission is a mixture of shorter wavelength starlight transiently reprocessed by tiny particles (see § 4.2) and reflected NIR starlight (Sellgren et al., 1992). Sellgren et al. (1992) reported that in NGC 7023, the polarization rises from short to long optical wavelengths, is strongest at , and then steadily decreases to longer NIR wavelengths, with the lowest measured polarization values at their longest observed wavelength, (13.1%, 4.6%, and 4.4% at positions A, B, and C, respectively, in Fig. 4). Based on this result, they conclude that scattered starlight contributes no more than 20% to measurements at positions near the 2 µm continuum emission peak in NGC 7023. Thus, although optical polarimetry demonstrates that the optical nebulosity at the 2 µm continuum emission peak is primarily scattered starlight (Gehrels, 1967; Watkin et al., 1991; Sellgren et al., 1992), we believe that scattered starlight makes a negligible contribution to the overall 2 µm continuum emission.
The brightest nebulosity in the 2 µm continuum images is the extended peak roughly halfway between the filaments and HD 200775. This 2 µm continuum emission peak is centered near 17″ W 19″ N (53 mpc) from HD 200775, with a diameter of 30″ (63 mpc) parallel to the filaments. The 2 µm continuum emission peak roughly corresponds to the H I clump detected by Fuente et al. (1996). The ring structure seen in the 3.29 µm image is only partially observed in the 2 µm continuum images. Filament I is clearly seen, but Filament II is only weakly present and Filament III may be faintly present only in the 2.18 µm image (Lemaire et al., 1996). The filaments appear more diffuse in the 2 µm continuum emission than in the 3.29 µm IEF emission or H2 line emission images.
4 Discussion
4.1 the H2 fluorescence compared to the 3.29 µm infrared emission feature
Standard PDR models (see references in Hollenbach & Tielens, 1997) predict that, in PDRs, UV-pumped fluorescent H2 emission lines are confined to a narrow transition region between H I and H2. Spectroscopic studies (Martini et al., 1997, 1999) and narrowband H2 imaging (Lemaire et al., 1996; Takami et al., 2000) of different H2 ro-vibrational emission lines in NGC 7023 show that the observed H2 emission is UV-pumped fluorescence. These authors also find evidence that the lower level populations are redistributed collisionally due to higher H2 density, especially in the H2 filaments, in agreement with HCO+ results (Fuente et al., 1996).
Observations of the Orion Bar, at a distance of 450 pc (O’Dell, 2001), show that the 3.29 µm IEF emission is strongest just outside the ionization front (Aitken et al., 1979; Sellgren, 1981; Roche, Aitken, & Smith, 1989; Bregman et al., 1989; Sellgren et al., 1990b; Tielens et al., 1993; Sloan et al., 1997). This has been interpreted to mean that the IEF carriers are destroyed in H II regions, perhaps by chemical attack or two-photon transient excitation.
The peak 3.29 µm emission in the Orion Bar also lies significantly closer (10-15″, or 22-33 mpc) to the star than does the peak H2 fluorescent emission. A similar result is found for the planetary nebula NGC 7027 (Graham et al., 1993), with the 3.29 µm IEF peak emission between the H II region ionization front (traced by H recombination lines) and the H I /H2 dissociation front (traced by fluorescent H2 emission lines).
By contrast, Figure 5 shows that, in NGC 7023, the 3.29 µm IEF emission peak is essentially coincident with the H2 fluorescent line emission peak, to within 1″ (2.1 mpc), although diffuse 3.29 µm IEF emission is also observed closer to HD 200775 than the H2 fluorescent emission filaments by 15-25″ (31-52 mpc).
The Orion Nebula and NGC 7023 are at similar distances, and both PDRs are believed to have more or less similar density structures, with high density () clumps embedded in lower density () interclump gas (Martini et al., 1997; Young Owl et al., 2000). The two PDRs, however, differ in three respects. The Orion Bar is illuminated by the O6 star C Orionis (HD 37022 (catalog )), with = 40,000 K (Ferland, 2001), while NGC 7023 is illuminated by the pre-main sequence B3Ve star HD 200775, with = 17,000 K. The higher effective temperature of C Orionis excites the brightest H II region in Orion, the Orion Nebula, while there is no significant H II region surrounding HD 200775. Finally, the UV flux () is ten times greater at the Orion Bar than at the H2 filaments in NGC 7023 (Hollenbach & Tielens, 1997; Martini et al., 1999).
Although detailed modeling of each PDR will be required to understand the observed differences in the spatial distributions of the 3.29 µm IEF emission relative to the H2 dissociation front in the Orion Bar and NGC 7023, it seems likely that the intensity and/or the hardness of the incident UV field plays a major role in these differences.
4.2 the near-infrared continuum compared to the 3.29 µm infrared emission feature
Previous spectra and low-resolution photometry of reflection nebulae have shown a general association between the 3.29 µm IEF emission and the 2 µm continuum emission (Sellgren et al., 1983, 1996) although a concrete spatial correlation (or lack thereof) between these two types of emission has not been previously investigated.
As outlined in § 1, the 2 µm continuum emission is generally thought to be the result of interactions between individual stellar photons and large gas-phase molecules or tiny solid-state grains, leading to transient NIR radiation. Proposed mechanisms for the 2 µm continuum emission include non-equilibrium thermal (modified graybody) emission from stochastically heated tiny grains (Sellgren et al., 1983; Sellgren, 1984); vibrational fluorescence of many overtone bands and combination bands of PAH molecules blended together to form a pseudo-continuum (Léger & Puget, 1984; Allamandola et al., 1985); continuous electronic fluorescence from PAH molecules (Allamandola et al., 1989); and continuous photoluminescent electron-band transitions of solid-state particles, most notably HAC grains or carbon nanoparticles (Duley & Williams, 1988; Duley, 1988, 2001). Both the stochastically heated grains and the PAH molecules are proposed to have a size of 1 nm, with 50 to 100 constituent atoms. Photoluminescence from carbon nanoparticles would require a range of 220 to 260 atoms per nanoparticle to provide the correct bandgap energy (cf. Seahra & Duley, 1999; Duley, 2001) to explain the observed 2.0-2.2 µm continuum.
While the origin of the 2 µm continuum emission is uncertain, the assignment of the 3.29 µm IEF to the stretching mode of aromatic C−H is generally agreed upon among the community. Proposed laboratory analogs or identifications for the IEF carrier(s) mainly involve hydrocarbon species: carbyne (Webster, 1980); an aromatic C−H stretch (Duley & Williams, 1981); PAH molecules (Léger & Puget, 1984; Allamandola et al., 1985, 1989); quenched carbonaceous composite, amorphous carbon, or coal with varying degrees of hydrogenation (Sakata et al., 1984, 1987; Blanco, Bussoletti, & Colangeli, 1988; Duley, 1988; Papoular et al., 1989); partially or fully hydrogenated fullerenes (Webster, 1992, 1993; Stoldt et al., 2001); nanodiamonds (Guillois, Ledoux, & Reynaud, 1999; Jones & d’Hendecourt, 2000; Duley & Grishko, 2001); nonlinear H2 photoexcitation (Glownia & Sorokin, 2000); and Rydberg matter (Holmlid, 2000, 2001). Neutral or ionized gas-phase warm (1000 K) PAH molecules (see reviews by Allamandola et al., 1989; Puget & Léger, 1989; Salama, 1999) are currently the leading candidate carrier for the 3.29 µm IEF, in the view of many researchers.
4.2.1 the 3.29 µm IEF and 2.18 µm continuum morphology
Our high-resolution images demonstrate that the distributions of the 3.29 µm IEF emission and the 2 µm continuum emission are spatially distinct in NGC 7023 (Fig. 6). The 2 µm continuum emission is strongest in the H I gas close to the star, and is brightest at a projected distance of 50 mpc from the star, although faint 2 µm continuum emission is also seen in the H2 filaments at a projected distance of 100 mpc from the star. On the other hand, the 3.29 µm IEF emission is strongest in the H2 filaments, with a projected separation from the peak of the 2 µm continuum emission of 50 mpc. Somewhat fainter 3.29 µm IEF emission, however, is also detected in the vicinity of the peak 2 µm continuum emission. This suggests that the 3.29 µm IEF carriers and the 2 µm continuum emitters either are distinct and/or are excited by different physical mechanisms.
Molecular hydrogen is both excited by and photodissociated by photons between 91.2 nm and 110 nm. We observe both 2 µm continuum emission and 3.29 µm IEF emission in the H I clump near the 2 µm continuum emission peak, and in the H2 filaments, although their relative intensities are different. This suggests that both the 2 µm continuum emitters and the 3.29 µm IEF carriers, whether or not they are distinct, should be able to survive in H I and warm H2.
4.2.2 spatial dependence of the [2.18 µm][3.29 µm] color
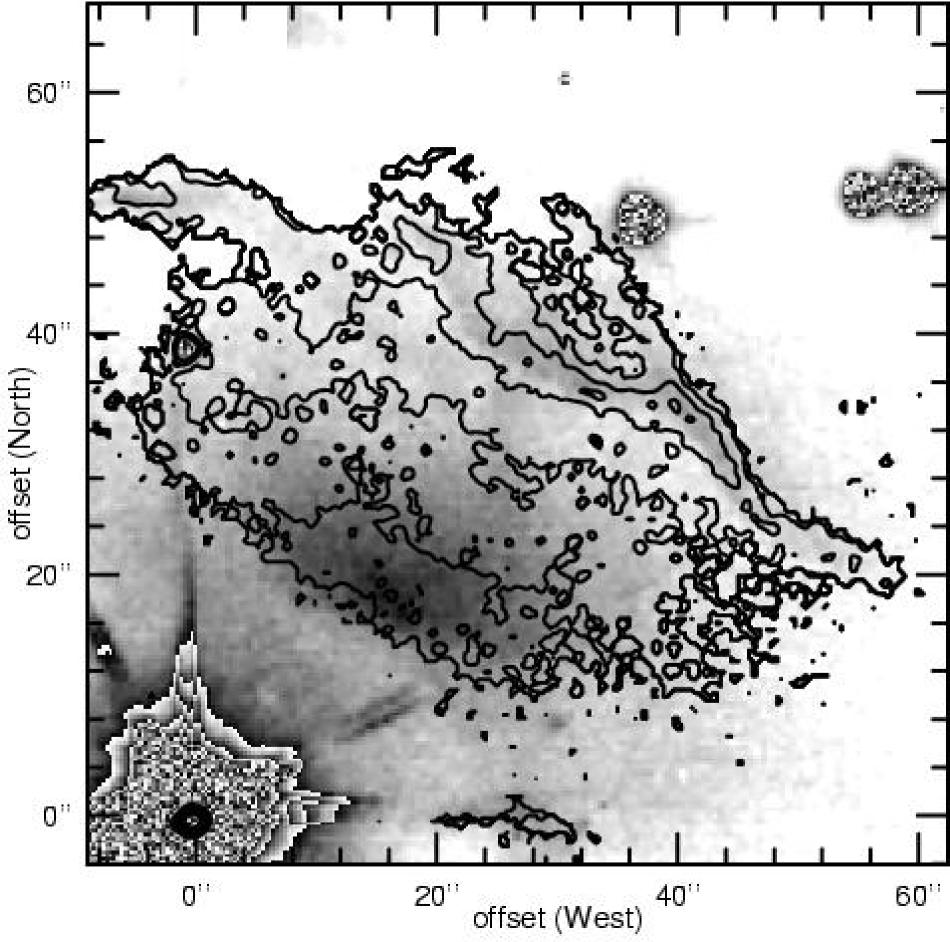
Figure 7 quantifies the difference between the spatial distributions of the 2 µm continuum emission and 3.29 µm IEF emission. We used the surface photometry of Sellgren et al. (1996) to derive a photometric calibration for the 3.29 µm image (Fig. 3), and the surface photometry of Sellgren et al. (1996) to derive a photometric calibration for the image (Fig. 1). We used this calibration technique in preference to the standard stars we observed for these two images, because we were interested in the faint extended emission on images with large sky background subtraction and comparison with the results of Sellgren et al. (1996). The 2.18 µm image (Lemaire et al., 1996) shown in Figure 3 was then calibrated by scaling it to have the same stellar magnitudes on average for stars in common between the and 2.18 µm images. Note that the original field of view of both images are actually larger than Figure 3 (Fig. 1 of this paper; Figs. 1-3 of Lemaire et al., 1996) and the scaling is based upon six stars common in that field. None of the stars used for scaling were saturated.
We smoothed both the 2.18 µm and 3.29 µm images with a 3 pixel 3 pixel boxcar, to increase our S/N on faint extended emission. All images presented in this paper have been resampled to a common scale of 0295 , which oversamples the 09 seeing of our 3.29 µm image and the 08 seeing of the 2.18 µm image (Lemaire et al., 1996). Thus this smoothing should not significantly degrade the spatial resolution of these two images. The noise in the sky-subtracted, calibrated, smoothed 3.29 µm image was measured by deriving the standard deviation in regions with little or no 3.29 µm emission. All pixels with fluxes less than three times this noise were set to zero. The same clipping process was applied to the sky-subtracted, calibrated, smoothed 2.18 µm image.
Finally, the calibrated 2.18 µm and 3.29 µm images were divided, then converted to mag arcsec-2. Figure 7 illustrates the distribution of the resulting color, as contours of [2.18 µm][3.29 µm], overlaid on the 2.18 µm grayscale image.
Figure 7 shows the surprising result that, despite the complicated morphology of NGC 7023, the [2.18 µm][3.29 µm] color varies smoothly across NGC 7023, with a steady increase in this color with projected distance from HD 200775, ranging from the 2 µm continuum emission peak to Filament I. Neither the 2 µm continuum emission peak, nor the “ring”-shaped region of lower 3.29 µm surface brightness between the 2 µm continuum emission peak and the H2 filaments (Fig. 3), show up as spatial structures in Figure 7. The [2.18 µm][3.29 µm] color illustrated in Figure 7 reaches its largest values in Filament I (Fig. 2). Observations of Filament III suggest that the [2.18 µm][3.29 µm] color begins to decrease at further projected distances from the star, beyond Filament I.
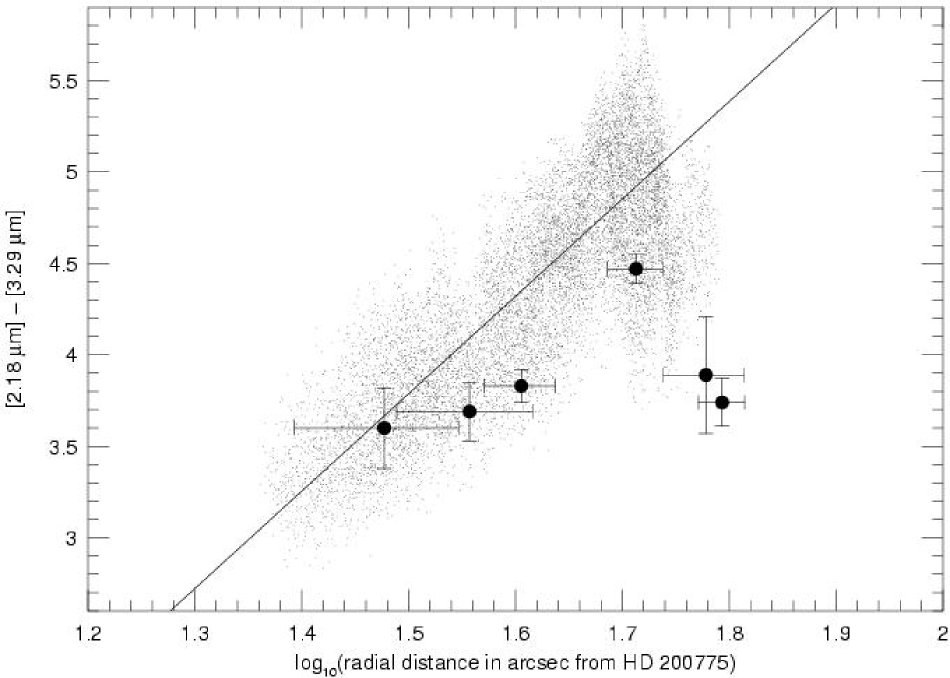
The radial dependence of the [2.18 µm][3.29 µm] color is quantified in Figure 8. In this, we plot pixel values of [2.18 µm][3.29 µm] versus projected radius from HD 200775. To reduce the scatter, we increased the threshold for detection to 5- in each [2.18 µm][3.29 µm] pixel, and masked all stars and all instrumental artifacts in the images. We also plot, for comparison, single detector measurements of [3.29 µm] from Sellgren et al. (1996). Note that [3.29 µm] is generally lower than [2.18 µm][3.29 µm], which is in part due to contamination by H2 emission lines in the filter. However, the radial pattern followed by individual pixels of [2.18 µm][3.29 µm] in Figure 8 is generally followed also by the lower spatial resolution data for [3.29 µm], including both the rise from the 2 µm continuum emission peak to Filament I, and the lower values at . The positions at which the [3.29 µm] data were taken are illustrated in Figure 4.
We calculated a least-square regression line to the [2.18 µm][3.29 µm] pixel values versus , for [or ]. This line, with a slope of , is shown in Figure 8. This slope corresponds to a power law radial dependence for the surface brightness ratio, , with the power index being . Here and are the 2.18 µm and 3.29 µm surface brightnesses. This is a strong suggestion that, in the region between the 2 µm continuum emission peak and the brightest 3.29 µm IEF filament, the difference between these two spatial distributions is related to stellar illumination.
Neither the 2.18 µm image nor the 3.29 µm image is corrected for instrumental scattered light from HD 200775. Because the spectrum of HD 200775 does not show the 3.29 µm IEF (Sellgren, 1984), the effects of instrumental scattered light are expected to be stronger at 2.18 µm than 3.29 µm. We investigated whether the radial dependence of [2.18 µm][3.29 µm] could be due in part to instrumental scattered light by examining the image (Fig. 1). On the same night that the image of NGC 7023 was obtained, a image of HR 8143 (catalog ) was also obtained with the same integration time. HR 8143 (, Elias et al., 1982) is brighter than HD 200775 (, Sellgren, 1983), and is not surrounded by any nebulosity, so should provide a robust measure of the effect of instrumental scattered light. We corrected the image of Figure 1 for instrumental scattered light, and then examined the radial dependence of [3.29 µm] for , where H2 makes little or no contribution to the surface brightness. We found no difference in slope for [3.29 µm] versus whether or not was corrected for instrumental scattered light. We therefore conclude that instrumental scattered light only has minimal effects on our observations of [2.18 µm][3.29 µm] shown in Figures 7 and 8.
The smooth increase of [2.18 µm][3.29 µm] with projected distance from HD 200775 (Figs. 7 & 8) is very intriguing, given the very different spatial distributions of 2.18 µm and 3.29 µm IEF emission shown in Figure 6. This implies that the extended 2 µm continuum emission peak is a region of higher column density, compared to the low surface brightness region that lies between the 2 µm continuum emission peak and the H2 filaments. The smooth increase in [2.18 µm][3.29 µm], independent of variations in column density, therefore suggests that the main factor that contributes to variations in [2.18 µm][3.29 µm] is the decrease in stellar flux with increasing projected distance from the star.
The radial increase in [2.18 µm][3.29 µm] with increasing distance from HD 200775 could be due to several factors. We present three possibilities here, but other explanations, such as hydrogenation or other chemical alteration of the 3.29 µm IEF carriers and/or 2.18 µm continuum emitters within the H I and H2 regions of NGC 7023, remain to be explored.
It has been proposed that the 3.29 µm IEF arises from the smallest PAHs in a PAH size distribution (Allamandola et al., 1989; Schutte, Tielens, & Allamandola, 1993). It has also been suggested that the smallest PAHs are most easily destroyed in a strong UV radiation field (Désert, Boulanger, & Puget, 1990; Allain, Leach, & Sedlmayer, 1996). If the 3.29 µm IEF arises in small PAHs which are preferentially destroyed near HD 200775, and if the 2.18 µm continuum arises either from larger PAHs, from more robust tiny grains, or from larger carbon nanoparticles, none of which are destroyed near HD 200775, then this could explain our observed radial increase in [2.18 µm][3.29 µm] for NGC 7023.
If PAHs are the 3.29 µm IEF carrier, then PAH ionization could play a major role in the radial dependence of the [2.18 µm][3.29 µm] color in NGC 7023. The electron density, , which depends on the total gas density, is higher at the 3.29 µm filaments than at the 2 µm peak (Fuente et al., 1996; Lemaire et al., 1996; Martini et al., 1997, 1999; Gerin et al., 1998; Takami et al., 2000). More importantly, the UV field, , is also lower at the 3.29 µm IEF filaments than at the 2 µm peak, with . Since the PAH ionization fraction is lower for lower (Bakes & Tielens, 1994), this could result in a lower PAH ionization fraction in the 3.29 µm IEF filaments than at the 2 µm peak. Theoretical calculations and laboratory experiments show that the 3.29 µm IEF is significantly weaker in ionized PAHs than neutral PAHs (de Frees et al., 1993; Szczepanski & Vala, 1993). If the 2 µm continuum emitters do not change ionization state or their emission is not affected by ionization state, then PAH ionization effects might be sufficient to explain the radial dependence of [2.18 µm][3.29 µm] shown in Figures 7 and 8.
A third alternative has to do with extinction and the excitation of the 3.29 µm IEF and the 2 µm continuum emission. The stellar radiation from HD 200775 is systematically reddened with distance from the star, resulting in a softer UV field at larger values of . Sellgren (1984) proposed that the 2 µm continuum is due to stochastically heated tiny grains, which require energetic UV photons to excite them. The 3.3 µm IEF has been proposed to be due to quenched carbonaceous composite, amorphous carbon, or coal (Sakata et al., 1984, 1987; Blanco et al., 1988; Duley, 1988; Papoular et al., 1989), all substances which absorb well at visible as well as UV wavelengths. If the 3.3 µm IEF could be excited by less energetic photons than the photons required for the 2 µm continuum emission, then the internal nebular extinction within NGC 7023 could cause the [2.18 µm][3.29 µm] color to increase with distance from the star. This possibility seems least likely, because Sellgren et al. (1996) find no evidence that the [3.3 µm] color depends on of the illuminating star, over = 11,000-22,000 K.
4.2.3 observed values of [2.18 µm][3.29 µm] in NGC 7023
Another exciting result illustrated in Figures 7 and 8 is that the peak value of [2.18 µm][3.29 µm] is 5.5 mag in the H2 filaments. Sellgren et al. (1996) measured or placed upper limits on [3.29 µm] in 14 different reflection nebulae. In several reflection nebulae, including NGC 7023, [3.29 µm] was measured at multiple spatial locations. The highest value of [3.29 µm] measured by Sellgren et al. (1996) in any reflection nebula, over a wide range of stellar effective temperature and stellar flux, is [3.29 µm]= 4.5 mag. Thus the 3.29 µm IEF filaments in NGC 7023 are roughly 2.5 times brighter, compared to the 2 µm continuum emission, than any other measured value in a reflection nebula.
Care must be taken in comparing our measured values of [2.18 µm][3.29 µm] (Figs. 7 & 8) and published values of [3.29 µm]. The broadband measurements of Sellgren et al. (1996) include both 2 µm continuum emission and H2 line emission, while the 2.18 µm images (Lemaire et al., 1996) were not corrected for instrumental scattered light. We believe this has a minimal effect on our results, since the H2 emission is so tightly confined to the filaments. Values of [2.18 µm][3.29 µm] greater than 4.8 mag are seen over an extended region outside the H2 filaments. Another issue is the 3.3 µm continuum emission that underlies the 3.29 µm IEF emission. Without an image of NGC 7023, we do not know how much of the increase in [2.18 µm][3.29 µm] in Figures 7 and 8 is due to a redder underlying continuum emission. In particular, we cannot derive a 3.29 µm IEF feature-to-continuum ratio, which is the usual metric of the strength of the 3.29 µm IEF emission. Sellgren et al. (1996), however, presented measurements of the narrowband 3.29 µm surface brightness, in their Table 4 and Figure 5, which are not corrected for the underlying 3.3 µm continuum emission. These are the results with which we compare the data shown in Figure 8.
The positions measured in the reflection nebula sample of Sellgren et al. (1996) were chosen by first searching for the brightest regions of emission. The filter was chosen for initial mapping of each reflection nebula because the high thermal background at 3.29 µm makes -band data vastly easier to obtain than 3.29 µm narrowband data. Thus, the positions where Sellgren et al. (1996) measured [3.29 µm] are biased toward being near the 2 µm continuum emission peak. Figure 7 shows that the 2 µm continuum emission peak in NGC 7023 has the smallest value of [2.18 µm][3.29 µm] that we were able to measure. It is intriguing that the highest 3.29 µm IEF feature-to-continuum ratio measured by Sellgren et al. (1996) is 9, corresponding to [3.29 µm] = 4.5 mag. Since we measure [2.18 µm][3.29 µm] = 5.5 mag in the H2 filaments of NGC 7023, we can speculate that the 3.29 µm IEF feature-to-continuum ratio could be as high as 23 if the underlying continuum color is unchanged. This can only be confirmed by future observations that provide an estimate of the 3.3 µm continuum emission underlying the 3.29 µm IEF emission. We note, however, that Figure 6 of Sellgren et al. (1996) shows no correlation between and 3.29 µm IEF feature-to-continuum ratio. Furthermore, support for a high feature-to-continuum ratio in the 3.29 µm filaments in NGC 7023 is provided by the spectra of Joblin et al. (1996), who find 3.29 µm feature-to-continuum ratios of up to 20, 34, and 37 in the reflection nebula NGC 2023 (catalog ), the Orion Bar, and the reflection nebula surrounding NGC 1333/SVS-3 (NGC 1333 3 (catalog SVS76)), respectively.
Figures 6, 7, and 8 may hold out the promise of making significant progress in understanding the emission mechanisms, and/or the relationship between the 2 µm continuum emitters and the 3.29 µm IEF carriers. The difference in the spatial distributions of 2 µm continuum emission and 3.29 µm IEF emission in NGC 7023, with the 2 µm continuum emission strongest in neutral gas and the 3.29 µm IEF emission strongest in dense molecular filaments, is one essential clue. Even more intriguing, the smooth increase of the [2.18 µm][3.29 µm] color with increasing projected distance from the illuminating star of NGC 7023 points towards the stellar flux playing a crucial role in determining the relative strengths of the 2 µm continuum emission and the 3.29 µm IEF emission.
5 Summary
We compare the spatial distributions of the 3.29 µm infrared emission feature (IEF), the 2.12 µm 1–0 S(1) H2 emission line, and the 2 µm continuum emission, in the bright visual reflection nebula NGC 7023. The H2 emission, due to UV-pumped fluorescence, arises in narrow, dense filaments at the dissociation front at the edge of the molecular cloud. The 3.29 µm IEF emission is also very strong in the same filaments, but the 2 µm continuum emission is quite weak there. On the other hand, the 2 µm continuum emission is very bright in the region between the H2 filaments and the illuminating star of NGC 7023, HD 200775. The 2 µm continuum emission is brightest 25″ (52 mpc) from HD 200775, roughly midway between the star and the filaments. There is also a distinct “ring”-shaped spatial structure that emits weakly at 3.29 µm and is located between the 2 µm continuum emission peak and the filaments.
Our observation that both the 3.29 µm IEF emission and the H2 fluorescent emission are brightest in narrow filaments, and are spatially coincident to within 2 mpc, is in stark contrast to observations of the Orion Bar ionization front and of the planetary nebulae NGC 7027. Both the Orion Bar and NGC 7027 show a clear spatial separation between the 3.29 µm IEF emission and the H2 emission. At the Orion Bar, the 3.29 µm IEF emission peak is 22-33 mpc closer to the exciting star of the Orion Nebula than is the fluorescent H2 peak, a separation at least a factor of ten larger than observed in NGC 7023. Because NGC 7023 and the Orion Bar have similar gas density structures, the difference in the projected distance between the 3.29 µm IEF emission peak and H2 peak between NGC 7023 and the Orion Bar is likely to be either related to the intensity of the incident UV field, which is ten times higher in the Orion Bar than in NGC 7023, and/or related to the hardness of the incident UV field, as indicated by the effective temperature of each exciting star (17,000 K for NGC 7023 and 40,000 K for the Orion Nebula).
We observe very dissimilar spatial distributions of the 3.29 µm IEF emission and the 2 µm continuum emission, and in particular, a clear separation between the 3.29 µm IEF emission peak and the 2 µm continuum emission peak. This suggests three possible interpretations, any or all of which could be correct: the excitation mechanisms for the 3.29 µm IEF emission and the 2 µm continuum emission are different; the emission processes for the 3.29 µm IEF emission and the 2 µm continuum emission are distinct; or the 3.29 µm IEF carriers and the 2 µm continuum emitters are not identical. This is in contrast to previous assumptions that the 2 µm continuum emission in visual reflection nebula was associated with the 3.29 µm IEF emission.
The spatial distribution of the 3.29 µm IEF emission in NGC 7023 indicates that the 3.29 µm IEF carriers in NGC 7023 prefer warm molecular gas, in contrast to the separation of H2 fluorescent emission and 3.29 µm IEF emission in the Orion Bar or NGC 7027. The 3.29 µm IEF carriers in NGC 7023, however, can survive in both neutral atomic and warm molecular gas. The 2 µm continuum image indicates that the 2 µm continuum emitters in NGC 7023 are predominantly associated with H I gas but can survive in both neutral atomic and warm molecular gas.
The value of [2.18 µm][3.29 µm], however, increases smoothly with increasing projected distance from the star, with values of 3.4-3.6 mag at the 2 µm continuum emission peak, and reaching values of 5.5 mag in the H2 filaments where the 3.29 µm IEF emission is brightest. The smoothness of the radial variation in [2.18 µm][3.29 µm], compared to the very structured morphology of the 2 µm continuum and 3.29 µm IEF images, suggests that the column densities of the 2 µm continuum emitters and the 3.29 µm IEF carriers are not the origin of the differences between the spatial distributions of these two ISM components. The smooth increase in [2.18 µm][3.29 µm] with increasing projected distance from the star, corresponding to a surface brightness ratio , instead suggests that the intensity of the incident stellar radiation field is directly or indirectly related to the differences between the spatial distributions of 3.29 µm IEF emission and 2 µm continuum emission.
We do not have a specific model to explain our observation that in NGC 7023. One idea involves the destruction of the 3.29 µm IEF carriers, but not the 2 µm continuum emitters, in the intense radiation field near HD 200775. Another possibility is a changing ionization fraction with distance from HD 200775 for PAHs, which have been proposed as a 3.29 µm IEF carrier, together with the assumption that the 2 µm continuum emission is insensitive to the ionization state of its emitters or that its emitters do not change ionization state within NGC 7023. A third concept invokes internal nebular extinction, if the 2 µm continuum emitters are excited by more energetic photons than the 3.29 µm IEF carriers.
The previously measured range of [3.29 µm] in different spatial positions in 14 reflection nebulae is 3.0-4.5 mag (Sellgren et al., 1996). Thus, the [2.18 µm][3.29 µm] value at the 3.29 µm IEF emission peak is 1 mag higher than previously observed in any reflection nebula. If is independent of [3.29 µm], as observed by Sellgren et al. (1996), then the 3.29 µm IEF feature-to-continuum ratio could be as high as 23 in the H2 filaments in NGC 7023, but this speculation remains to be confirmed by future observations.
References
- Aitken et al. (1979) Aitken, D. K., Roche, P. F., Spenser, P. M., & Jones, B. 1979, A&A, 76, 60
- Allain et al. (1996) Allain, T., Leach, S., & Sedlmayr, E. 1996, A&A, 305, 602
- Allamandola et al. (1985) Allamandola, L. J., Tielens, A. G. G. M., & Baker, J. R. 1985, ApJ, 290, L25
- Allamandola et al. (1989) Allamandola, L. J., Tielens, A. G. G. M., & Baker, J. R. 1989, ApJS, 71, 733
- Bakes & Tielens (1994) Bakes, E. L. O., & Tielens, A. G. G. M. 1994, ApJ, 427, 822
- Baschek et al. (1982) Baschek, B., Beltrametti, M., Köppen, J., & Traving, G. 1982, A&A, 105, 300
- Blanco et al. (1988) Blanco, A., Bussoletti, E., & Colangeli, L. 1988, ApJ, 334, 87
- Bregman et al. (1989) Bregman, J. D., Allamandola, L. J., Witteborn, F. C., Tielens, A. G. G. M., & Geballe, T. R. 1989, ApJ, 344, 791
- Burrows (1995) Burrows, C. J. 1995, WFPC2 Instrument Handbook, version 3.0 (Baltimore:STScI)
- Casey (1991) Casey, S. C. 1991, ApJ, 371, 183
- Castelaz et al. (1987) Castelaz, M. W., Sellgren, K., & Werner, M. W. 1987, ApJ, 313, 853
- Cesarsky et al. (1996) Cesarsky, D., Lequeux, J., Abergel, A., Perault, M., Palazzi, E., Madden, S., & Tran, D. 1996, A&A, 315, L305
- de Frees et al. (1993) de Frees, D. J., Miller, M. D., Talbi, D., Pauzat, F., & Ellinger, Y. 1993, ApJ, 408, 530
- DePoy et al. (1993) DePoy, D. L., Atwood, B., Byard, P. L., Frogel, J., & O’Brian, T. P. 1993, Proc. SPIE, 1946, 667
- Désert et al. (1990) Désert, F.-X., Boulanger, F., & Puget, J. L. 1990, A&A, 237, 215
- Duley (1988) Duley, W. W. 1988, MNRAS, 234, 61P
- Duley (2001) Duley, W. W. 2001, ApJ, 553, 575
- Duley & Grishko (2001) Duley, W. W., & Grishko, V. I. 2001, ApJ, 554, L209
- Duley & Williams (1981) Duley, W. W., & Williams, D. A. 1981, MNRAS, 196, 269
- Duley & Williams (1988) Duley, W. W., & Williams, D. A. 1988, MNRAS, 230, 1P
- Elias et al. (1982) Elias, J. H., Frogel, J. A., Matthews, K., & Neugebauer, G. 1982, AJ, 87, 1029
- Ferland (2001) Ferland, G. J. 2001, PASP, 113, 41
- Fuente et al. (1996) Fuente, A., Martín-Pintado, J., Neri, R., Rogers, C., & Moriarty-Schieven, G. 1996, A&A, 310, 286
- Geballe (1997) Geballe, T. R. 1997, in ASP Conf. Ser. 122, From Stardust to Planetesimals, ed. Y. J. Pendleton, A. G. G. M. Tielens, M. L. Savage (San Francisco: ASP), 119
- Gehrels (1967) Gehrels, T. 1967, AJ, 72, 631
- Gerin et al. (1998) Gerin, M., Phillips, T. G., Keene, J., Betz, A. L., & Boreiko, R. T. 1998, ApJ, 500, 329
- Glownia & Sorokin (2000) Glownia, J. H., & Sorokin, P. P. 2000, BAAS, 197, 7.09
- Gordon et al. (2000) Gordon, K. D., Witt, A. N., Rudy, R. J., Puetter, R. C., Lynch, D. K., Mazuk, S., Misselt, K. A., Clayton, G. C., & Smith, T. L. 2000, ApJ, 544, 859
- Graham et al. (1993) Graham, J. R., Serabyn, E., Herbst T. M., Matthews, K., Neugebauer, G., Soifer, B. T., Wilson, T. D., & Beckwith, S. 1993, AJ, 105, 250
- Guillois et al. (1999) Guillois, O., Ledoux, G., & Reynaud, C. 1999, ApJ, 521, L133
- Harvey et al. (1980) Harvey, P. M., Thronson, H. A., Jr., & Gatley, I. 1980, ApJ, 235, 894
- Herbig (1960) Herbig, G. H. 1960, ApJS, 4, 337
- Hodapp et al. (1992) Hodapp, K.-W., Rayner, J., & Irwin, E. 1992, PASP, 104, 441
- Hollenbach & Tielens (1997) Hollenbach, D. J., & Tielens, A. G. G. M. 1997, ARA&A, 35, 179
- Holmlid (2000) Holmlid, L. 2000, A&A, 358, 276
- Holmlid (2001) Holmlid, L. 2001, ApJ, 548, L249
- Jones & d’Hendecourt (2000) Jones, A. P., & d’Hendecourt, L. 2000, A&A, 355, 1191
- Joblin et al. (1996) Joblin, C., Tielens, A. G. G. M., Allamandola, L. J., & Geballe, T. R. 1996, ApJ, 458, 610
- Jourdain de Muizon et al. (1990a) Jourdain de Muizon, M., d’Hendecourt, L. B., & Geballe, T. R. 1990a, A&A, 227, 526
- Jourdain de Muizon et al. (1990b) Jourdain de Muizon, M., d’Hendecourt, L. B., & Geballe, T. R. 1990b, A&A, 235, 367
- Léger & Puget (1984) Léger, A., & Puget, J. L. 1984, A&A, 137, L5
- Lemaire et al. (1996) Lemaire, J. L., Field, D., Gerin, M., Leach, S., Pineau des Forêts, G., & Rouan, D. 1996, A&A, 308, 895
- Martini et al. (1999) Martini, P., Sellgren, K., & DePoy, D. L. 1999, ApJ, 526, 772
- Martini et al. (1997) Martini, P., Sellgren, K., & Hora, J. L. 1997, ApJ, 484, 296
- Merrill et al. (1975) Merrill, K. M., Soifer, B. T., & Russell, R. W. 1975, ApJ, 200, L37
- O’Dell (2001) O’Dell, C. R. 2001, ARA&A, 39, 99
- Papoular et al. (1989) Papoular, R., Conard, J., Guiliano, M., Kister, J., & Mille, G. 1989, A&A, 217, 204
- Papoular et al. (1996) Papoular, R., Conard, J., Guillois, O., Nenner, I., Reynaud, C., & Rouzaud, J.-N. 1996, A&A, 315, 222
- Puget & Léger (1989) Puget, J. L. & Léger, A. 1989, ARA&A, 27, 161
- Rayner et al. (1993) Rayner, J. T., et al. 1993, Proc. SPIE, 1946, 490
- Roche et al. (1989) Roche, P. F., Aitken, D. K., & Smith, C. H. 1989, MNRAS, 236, 485
- Sakata et al. (1987) Sakata, A., Wada, S., Onaka, T., & Tokunaga, A. 1987, ApJ, 320, L63
- Sakata et al. (1984) Sakata, A., Wada, S., Tanabe, T., & Onaka, T. 1984, ApJ, 287, L51
- Salama (1999) Salama, F. 1999, in Solid Interstellar Matter: The ISO Revolution, Les Houches Workshop, ed. L. d’Hendecourt, C. Joblin (Paris: EDP Science), 65
- Schutte, Tielens, & Allamandola (1993) Schutte, W. A., Tielens, A. G. G. M., & Allamandola, L. J. 1993, ApJ, 415, 397
- Seahra & Duley (1999) Seahra, S. S., & Duley, W. W. 1999, ApJ, 520, 719
- Sellgren (1981) Sellgren, K. 1981, ApJ, 245, 138
- Sellgren (1983) Sellgren, K. 1983, AJ, 88, 985
- Sellgren (1984) Sellgren, K. 1984, ApJ, 277, 623
- Sellgren (1986) Sellgren, K. 1986, ApJ, 305, 399
- Sellgren (1990) Sellgren, K. 1990, in Dusty Objects in the Universe, ed. E. Bussoletti, A. A. Vittone (Dordrecht: Kluwer), 35
- Sellgren (1994) Sellgren, K. 1994, in ASP Conf. Ser. 58, The Infrared Cirrus and Diffuse Interstellar Clouds, ed. R. M. Cutri, W. B. Latter (San Francisco: ASP), 243
- Sellgren et al. (1985) Sellgren, K., Allamandola, L. J., Bregman, J. D., Werner, M. W., & Wooden, D. H. 1985, ApJ, 299, 416
- Sellgren et al. (1990a) Sellgren, K., Luan, L., & Werner, M. W. 1990a, ApJ, 359, 384
- Sellgren, Tokunaga, & Nakada (1990b) Sellgren, K., Tokunaga, A. T., & Nakada, Y. 1990b, ApJ, 349, 120
- Sellgren et al. (1996) Sellgren, K., Werner, M. W., & Allamandola, L. J. 1996, ApJS, 102, 369
- Sellgren et al. (1983) Sellgren, K., Werner, M. W., & Dinerstein, H. L. 1983, ApJ, 271, L13
- Sellgren et al. (1992) Sellgren, K., Werner, M. W., & Dinerstein, H. L. 1992, ApJ, 400, 238
- Sloan et al. (1997) Sloan, G. C., Bregman, J. D., Geballe, T. R., Allamandola, L. J., & Woodward, C. E. 1997, ApJ, 474, 735
- Stapelfeldt et al. (1997) Stapelfeldt, K., Sahai, R., Werner, M., & Trauger, J. 1997, in ASP Conf. Ser. 119, Planets beyond the Solar System and the Next Generation of Space Missions, ed. D. Soderblom (San Francisco: ASP), 131
- Stoldt et al. (2001) Stoldt, C. R., Maboudian, R., & Carraro, C. 2001, ApJ, 548, L225
- Strom et al. (1972) Strom, S. E., Strom, K. M., Yost, J., Carrasco, L., & Grasdalen, G. 1972, ApJ, 173, 353
- Szczepanski & Vala (1993) Szczepanski, J., & Vala, M. 1993, ApJ, 414, 646
- Takami et al. (2000) Takami, M., Usada, T., Sugai, H., Kawabata, H., Suto, H., & Tanaka, M. 2000, ApJ, 529, 268
- Tielens et al. (1993) Tielens, A. G. G. M., Meixner, M. M., van der Werf, P. P., Bregman, J., Tauber, J. A., Stutzki, J., & Rank, D. 1993, Science, 262, 84
- Tokunaga (1997) Tokunaga, A. T. 1997, in ASP Conf. Ser. 124, Diffuse Infrared Radiation and the IRTS, ed. H. Okuda, T. Matsumoto, T. Roellig (San Francisco: ASP), 149
- van den Ancker et al. (1997) van den Ancker, M. E., Thé, P. S., Tjin A Djie, H. R. E., Catala, C., de Winter, D., Blondel, P. F. C., & Waters, L. B. F. M. 1997, A&A, 324, L33
- Watkin et al. (1991) Watkin, S., Gledhill, T. M., & Scarrott, S. M. 1991, MNRAS, 252, 229
- Webster (1980) Webster, A. 1980, MNRAS, 192, 7P
- Webster (1992) Webster, A. 1992, MNRAS, 257, 463
- Webster (1993) Webster, A. 1993, MNRAS, 264, 121
- Whitcomb et al. (1981) Whitcomb, S. E., Gatley, I., Hildebrand, R. H., Keene, J., Sellgren, K., & Werner, M. W. 1981, ApJ, 246, 416
- Witt & Schild (1988) Witt, A. N., & Schild, R. E. 1988, ApJ, 325, 837
- Young Owl et al. (2002) Young Owl, R. C., Meixner, M. M., Fong, D., Haas, M. R., Rudolph, A. L., & Tielens, A. G. G. M. 2002, ApJ, 578, 885
- Young Owl et al. (2000) Young Owl, R. C., Meixner, M. M., Wolfire, M., Tielens, A. G. G. M., & Tauber, J. 2000, ApJ, 540, 886
| aaCentral wavelength of filter. | bbFilter width in FWHM. | Date | Scale | Seeing | Telescope | Instrument | PAdiff ccOrientation of the diffraction spikes in position angle east of north. | Ref. |
|---|---|---|---|---|---|---|---|---|
| (µm) | (µm) | (arcsec ) | (arcsec) | (degr) | ||||
| 2.11 ddThe filter. | 0.35 | 1990 Sep 12 | 0.77 | 1.3 | UH 2.2 m | UH NICMOS eeA 1-2.5 µm 256 pixel 256 pixel HgCdTe array detector (Hodapp, Rayner, & Irwin, 1992). | 0 | 1 |
| 2.12 | 0.02 | 1993 Dec 1,2 | 0.5 | 0.8 | CFHT 3.6 m | Redeye | 0,28 | 2 |
| 2.18 | 0.02 | 1993 Dec 1,2 | 0.5 | 0.8 | CFHT 3.6 m | Redeye | 0,28 | 2 |
| 2.09 | 0.02 | 1995 Sep 3 | 1.53 | 2.8 | Perkins 1.8 m | OSIRIS ffA 1-2.5 µm 256 pixel 256 pixel HgCdTe array detector (DePoy et al., 1993). | 45 | |
| 2.12 | 0.02 | 1995 Sep 3 | 1.53 | 2.8 | Perkins 1.8 m | OSIRIS ffA 1-2.5 µm 256 pixel 256 pixel HgCdTe array detector (DePoy et al., 1993). | 45 | |
| 2.14 | 0.02 | 1995 Sep 3 | 1.53 | 2.8 | Perkins 1.8 m | OSIRIS ffA 1-2.5 µm 256 pixel 256 pixel HgCdTe array detector (DePoy et al., 1993). | 45 | |
| 0.586 ggThe F606W filter for WFPC2. | 0.150 | 1995 Oct 4 | 0.10 | 0.20 | HST 2.4 m | WFPC2 | 45 | 3,4 |
| 3.29 | 0.05-0.07 | 1997 Dec 13 | 0.295 | 0.9 | IRTF 3 m | NSFCam hhA 1-5 µm 256 pixel 256 pixel InSb array detector (Rayner et al., 1993). + CVF iiCircular Variable Filter of 1.5-2.0% spectral resolution. | 0 |
Note. — CFHT data courtesy of Lemaire et al. (1996). HST data based on observations made with the NASA/ESA HST, obtained from the data archive at the Space Telescope Science Institute (STScI). STScI is operated by AURA, Inc. under NASA contract NAS 5-26555.