Kinematics of Ultracompact HII Regions Revealed:
High Spatial
and Spectral Resolution Mapping of the 12.8 m [Ne II] Line in Monoceros R2
Abstract
We present the first results of a study of the kinematics and morphology of ultracompact H II regions using a new observational technique. We used very high spatial and spectral resolution observations (=1.4″, V= 3.4 km s-1) of the [Ne II] line at 12.8 m to study the ionized gas in Monoceros R2. The [Ne II] emission shows an H II region with highest emission measure in a 24 ″ diameter shell, surrounded on all sides by neutral material. [Ne II] line widths are as narrow as 8 km s-1 at some positions. In places where the lines are complex and broader, the additional width is most likely due to overlap of narrower features along the line of sight. The narrow features themselves, however, are broader than the purely thermal width. The global kinematics suggest that the 24″ shell is expanding at 10 km s-1. This interpretation leads to a dynamical age for the H II region of 104 years. However, the spectral profiles toward the brightest part of the nebula (on the southeast side of the shell) are not consistent with a simple expansion picture. Both the 24″ shell and the bright southeast ridge can be part of a common kinematic pattern in which material flows from the bottom to the rim of a bowl-like feature.
High resolution observations of mid-IR fine structure transitions offer great promise as a probe of the kinematics and morphology of ionized regions around very young massive stars. Once appropriate theoretical modelling and observations of a larger sample of UCHII regions are in place, it should be possible to determine the physics behind the observed systematic motions in sources like Mon R2.
1 Introduction
This study presents the first results of a program to examine ultracompact H II regions at high spatial and spectral resolution using fine-structure line emission in the mid-infrared. This kind of observation allows us to see more clearly the kinematics and structure of these ionized regions around very young, massive stars. We illustrate the technique by investigating the properties of the H II region in the core of the Monoceros R2 molecular cloud.
1.1 Ultracompact H II Regions
Massive stars evolve very rapidly to the zero age main sequence. They begin to emit copious amounts of Lyman continuum radiation while still embedded within their natal clouds. When this ultraviolet emission turns on, a dense ionized region forms. These ultracompact H II regions (UCHII regions) are one of the earliest manifestations of newly formed massive stars. High frequency radio interferometric surveys, together with studies of IRAS point sources with characteristic colors, show that there are several hundred UCHII regions in our galaxy (Wood & Churchwell 1989a, Garay et al. 1993, Kurtz et al. 1994). These sources range in size down to 0.005 pc.
High spatial resolution radio continuum studies reveal a range of morphologies for UCHII regions (Wood & Churchwell 1989b). Almost half of such sources are spherical or unresolved at 1-2 arc second resolution with the VLA. The other half of the sources are almost evenly divided between cometary shapes, core-halo sources, and irregular sources, with a small percentage (about 4%) having shell morphologies. The morphological classifications of many sources, however, need to be viewed with caution. Not only does the limited signal-to-noise of the VLA “snapshot” surveys keep observers from seeing lower surface brightness components of the target sources, but undersampling of the spatial frequency domain by aperture synthesis telescopes also can affect the appearance of the sources (Wood & Churchwell 1989b, Fey et al. 1992). In addition, the UCHII regions often lie in regions with significant amounts of continuum emission over a large area. The interaction of this extended complex emission with the uv sampling of the VLA can limit the dynamic range of the radio continuum observations and make it hard to draw conclusions with confidence from any but the brightest portions of the maps.
The high densities in UCHII regions lead to enormous (nT109 cm-3 K) internal pressures. If the smallest sources expand at their internal thermal sound speed into the surrounding interstellar medium, their expansion timescales can be as short as a few hundred years (Dreher & Welch 1981). The number of UCHII regions and the short expansion timescales combine to give rise to what is known as the “UCHII region lifetime problem”: Extrapolation from the number of UCHII regions and the thermal expansion timescales of the individual regions leads to excessively high star formation rates for massive stars (cf. Wood & Churchwell 1989a). A number of solutions to the lifetime problem have been proposed for various morphological types of UCHII regions. These include: a model for cometary UCHII regions employing bowshock compression by O stars moving relative to the neutral cloud (Van Buren & MacLow 1992), explanations of unresolved and bipolar regions as mass-loaded wind sources (Redman, Williams & Dyson 1995, 1996, Dyson, Williams, & Redman 1995, Lizano et al. 1996) or as photoevaporated circumstellar disks (Hollenbach et al. 1994, Yorke & Welz 1993, 1996, Richling & Yorke 1997, Jaffe & Martin-Pintado 1999), and the suggestion that extremely dense and warm neutral material may pressure confine the UCHII regions (De Pree, Rodriguez, & Goss 1995a, Akeson & Carlstrom 1996). Each of these ideas has limited applicability and each has problems, even for the source types where it works best. The date we present in this work lead to new ideas about the lifetime problem in Mon R2.
Our ability to test the models of UCHII regions depends on good information about the morphology and, even more importantly, the kinematics of the sources. The kinematic information we currently have about UCHII regions comes from observations of centimeter-wave hydrogen recombination lines. The nature of the emission, however, limits the diagnostic power of the lines. The thermal widths of the hydrogen lines make it hard to detect bulk motions of the gas unless these motions are a significant fraction of the thermal sound speed. Measurements of lines arising from states with principal quantum number n100 may also suffer from pressure broadening making the higher frequency, lower n lines better tracers of kinematics. Despite these problems, the hydrogen recombination line emission shows evidence for gas motions both on the scale of the entire region, through shifts in velocity centroids across the source in some sources (Garay et al. 1986, De Pree et al. 1994, 1995b, Garay et al. 1994), and on a scale smaller than the beamsize, which can be as small as 0.2″-1″, through the large local line widths seen in most UCHII regions. The line widths seen in individual beams (25 to as much as 180 km s-1, Garay & Lizano 1999) are usually attributed to combination of thermal motion, turbulent motion, and unresolved mass motions. If the thermal and other components can be added in quadrature, the large observed line widths imply that the turbulence and/or mass motions alone would produce line widths 20 km s-1.
The VLA observations of hydrogen recombination lines suffer from the same uv sampling problems as the continuum studies. In addition, they usually have fairly coarse velocity resolution (typically 10 km s-1, although the VLA backend is capable of finer resolution) and sensitivity-limited dynamic range of only 20 or so in a given velocity channel. The radio recombination line measurements therefore tend to miss both the larger-scale emission within the individual regions and also small-scale features if they are weak compared to the brightest spectral features in the region.
1.2 High Resolution Mid-IR Fine-Structure Line Mapping
The 2PP3/2 transition of Ne+ is a versatile tracer of the ionized gas in H II regions. At a frequency of 780.4238 cm-1 (12.81 m, Yamada, Kanamori, & Hirota 1985) this line lies in a part of the mid-infrared spectrum where both interstellar dust and the Earth’s atmosphere are relatively transparent. Since Neo and Ne+ have ionization potentials of 21 and 41 eV, Ne+ is the dominant neon ion in H II regions with a broad range of stellar types for their exciting stars. The critical density of the 12.8 m [Ne II] transition is 5.4105 cm-3, so the line intensity scales with the emission measure in all but the densest parts of the H II regions. Earlier observations have shown that the [Ne II] distribution closely resembles the distribution of short wavelength radio continuum emission (Lacy, Beck, & Geballe 1982, Beck, Lacy & Kelly 1998, Takahashi et al. 2000).
Unlike the hydrogen line observations, the observations of [Ne II] give us the ability to see subsonic bulk motions of the gas. In a nebula with a kinetic temperature of 104 K, the recombination lines of hydrogen have a purely thermal line width of 21 km s-1, full width to half maximum (FWHM, see Gordon 1988). If the gas is otherwise at rest, the atomic mass of neon (20) means that the 12.8 m line will be a factor of (mNe/mH)1/2= 4.5 narrower than the hydrogen lines, or 4.7 km s-1 at 104 K. The significantly narrower thermal line width of the neon profiles means that high resolution spectroscopy of the 12.8 m line can offer us the chance to resolve closely-spaced velocity components along a given line of sight, to follow small variations in line velocity from one position to another, and to detect the presence of turbulence or bulk motion on small scales but with overall velocity spreads significantly below the thermal sound speed.
1.3 The Ultracompact HII Region in Monoceros R2: A Case Study
The Monoceros R2 complex is a nearby (D=830 pc, Herbst & Racine 1976) region currently forming high and low mass stars. The core of the complex contains an ultracompact H II region, 0.1 pc (24″) in diameter with a bright ridge along its southeastern side, as seen in radio continuum emission (Massi, Felli, & Churchwell 1985, Wood & Churchwell 1989b) and Br (Howard et al. 1994). Although there is additional emission from a more diffuse ionized component (Downes et al. 1975), the majority of the flux arises in this UCHII region. Downes et al. conclude that a star of ZAMS spectral type B0 or earlier is needed to provide sufficient ionizing radiation to the HII region. Massi et al. interpret the morphology of the ionized gas emission as a blister HII region illuminated by a source close to the bright arc.
The inner arcminute of Mon R2 also contains a group of bright near-IR point sources (Beckwith et al. 1976, Aspin & Walther 1990, Howard et al. 1994). The total luminosity emitted within this region is around 5104 L⊙ (Thronson et al. 1980). Near-infrared imaging of the Mon R2 region on 15′ scales reveals that the nebula lies within the core of a cluster containing at least 400 stars and that the stellar density peak is roughly coincident with IRS2, the bright source inside the northern part of the nebula (Carpenter et al. 1997).
High spatial resolution (10″–14″) mapping of molecular line emission from the Mon R2 shows that dense (up to nH2=3106 cm-3, Choi et al. 2000) gas surrounds the UCHII region on three sides (Torrelles et al. 1990, Gonatas, Palmer, & Novak 1992, Tafalla et al. 1994, Giannakopoulou et al. 1997). The highest resolution observations (Gonatas et al. 1992) show a ring of molecular emission immediately outside of the region of bright radio continuum emission. On larger scales, observations of 12CO rotational lines show that the UCHII region in Monoceros R2 sits near the middle of a huge (several parsec long) and massive (a few 102 M⊙) bipolar outflow (Wolf, Lada, & Bally 1990, Meyers-Rice & Lada 1991).
This paper presents and analyzes a detailed [Ne II] map of a 45″ by 28″ region containing the bright radio continuum source in Mon R2 and hopes to demonstrate the value of high resolution observations of UCHII regions using fine-structure lines in the mid-IR. In Section 2, we discuss the instrumentation, observing technique and data analysis necessary to produce high signal to noise, high spatial and spectral resolution observations of the [Ne II] line. In Section 3, we present the results of the [Ne II] spectral line mapping and describe the major features of the resulting datacube. Section 4 interprets the kinematics of the ionized gas and draws implications for the nature and structure of the nebula.
2 Observations
2.1 Instrument and Observing Technique
We mapped the [Ne II] line toward the ultracompact H II region Mon R2 in 2001 November with the Texas Echelon Cross Echelle Spectrograph (TEXES, Lacy et al. 2002) on the 3m NASA Infrared Telescope Facility on Mauna Kea.
In the setup used for these observations, the slit was oriented north-south, had a width of 1.4″ and a length of 11.5″. With the chosen slit width, the instrument produces a cross-dispersed spectrum with a resolving power of 88,000 (velocity resolution of 3.4 km s-1) at 12.8 m. The pixel spacing of the 2562 Si:As array was 0.35″ on the sky (0.95 km s-1 in the spectral direction). The diffraction limit of the IRTF at 12.8 m is 0.88″.
We mapped Mon R2 by stepping the telescope from west to east in 0.7″ increments along 45″ long strips across the nebula. The integration time at each position along each strip was 1 second. We observed 5 west-east strips separated by 5 arcseconds north-south. Since each strip was scanned four times, the integration time per point in the map was approximately 9 seconds. The spectral and spatial variations in the sky background are normally small enough when observing at high spectral resolution that rapid subtraction of emission at a reference position is not necessary. For the Mon R2 maps, we therefore held the telescope secondary fixed and were able to use spectra taken at the ends of each scan, at positions where no emission was present, as sky references.
We made two independent determinations of the absolute position of our [Ne II] map. In the first method, we matched the position of the bright southeastern ridge and the point source near IRS1 to the corresponding features in the radio continuum map of Massi et al. (1985). Our second method matched the position of the 12.8 m continuum source IRS2 with the near-IR position of the source (Aspin and Walther 1990). The two methods agree to better than 2″ in R.A. and 0.″7 in Declination. The average of the two solutions places the (0,0) point of our map at 06h07m45.9s, -06o23′01″ (J2000).
2.2 Data Reduction and Analysis
The spectra were reduced using the TEXES automated pipeline reduction program which removes artifacts, flat-fields the frames, and extracts the spectrum from the cross-dispersed data (Lacy et al. 2002). We apply a radiometric flux calibration using measurements of ambient temperature and cold loads before each set of scans. The intensity scale is in units of erg cm-2 s-1 sr-1 (cm-1)-1. The wavelength solution was derived from telluric lines present in each spectrum and is accurate to 1 km s-1.
3 Results
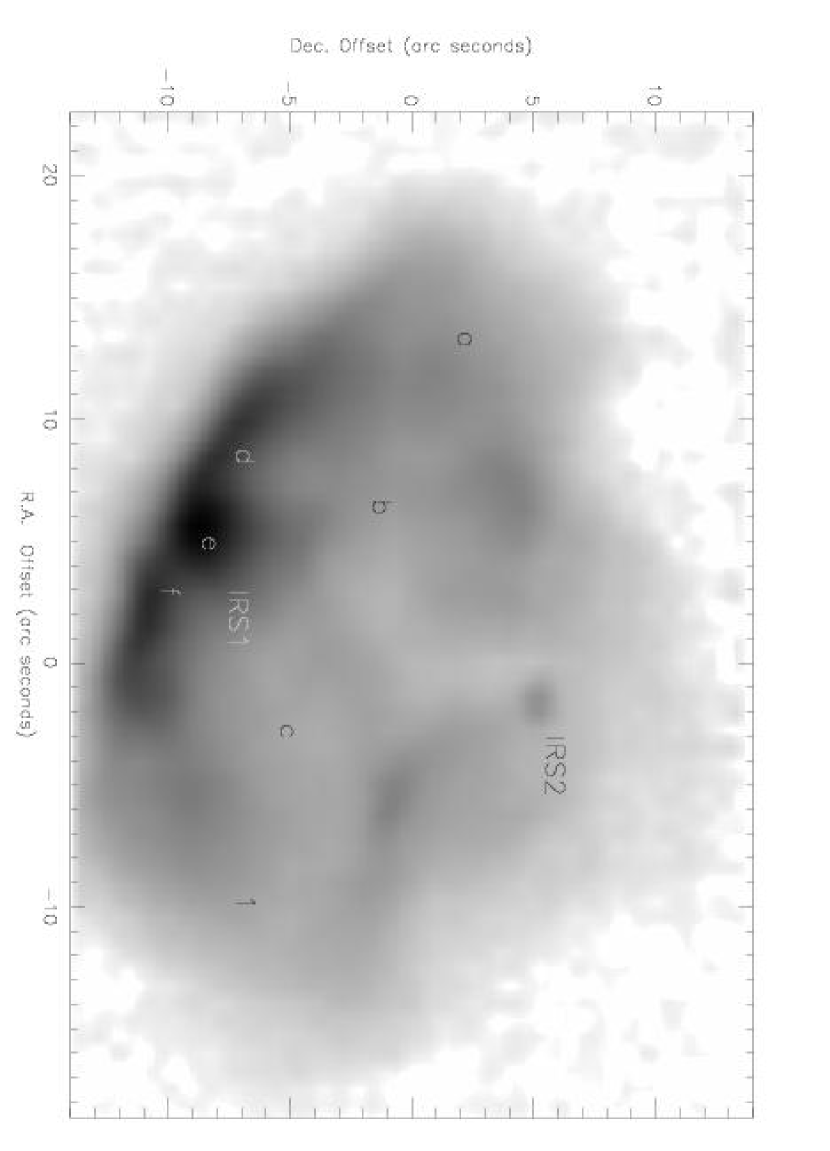
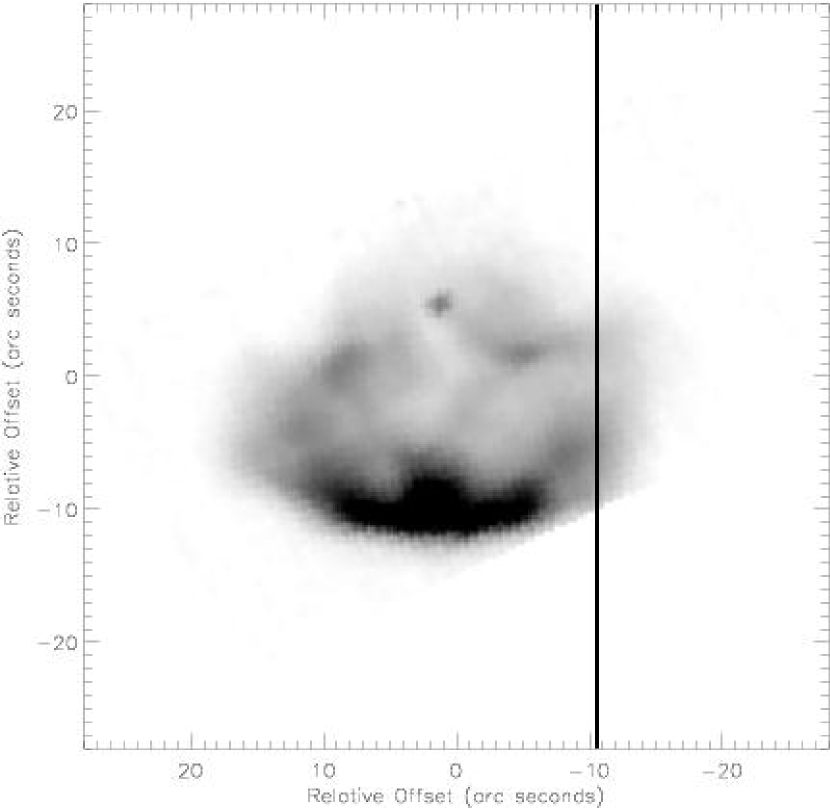
Figure 1 shows a map of [Ne II] integrated line brightness for the Mon R2 region. The neon emission extends over 24″ 18″. A bright ridge or flattened arc in the southeastern part of the source, running from southwest to northeast, dominates the emission. This ridge lies about 4″ to the southeast of the near-IR continuum source IRS1. At lower flux levels, the ridge extends to form a complete shell surrounding a region of lower brightness. The faintest part of the shell in [Ne II] lies east of IRS2, but there is detectable emission out to 10″ from the center of the nebula in all directions. The flux distribution is quite symmetric about an axis at position angle -25o and running almost through the positions of Mon R2 IRS1 in the southeast and IRS2 in the north. The overall morphology agrees very closely with the radio continuum flux distribution (Massi et al. 1985, Wood & Churchwell 1989b). The more limited [Ne II] imaging of Takahashi et al. (2000) is consistent with the map shown in Figure 1 .
The sensitivity of TEXES is good enough to allow us to explore the details of the kinematics in Mon R2. For example, TEXES observed the S/N50 spectrum shown in Figure 2, in 9 seconds of integration time. This spectrum was taken well away from the brightest parts of the nebula, in a region where the 6 cm continuum flux in a 1.4″ beam is 10 mJy (Massi et al. 1985). At the edges of the nebula away from the southeastern ridge, the lines are typically single and have FWHM9-14 km s-1. The spectrum shown in Figure 2 was taken at a position along the southwest side of the nebula (labeled as ’1’ in Figure 1) while the upper left panel of Figure 3 shows a spectrum from the northeast rim (labeled ’a’ in Figure 1). Along most of the bright southeastern ridge and throughout the region inside the shell, the spectra are double-peaked. The two remaining panels in the upper row of Figure 3 show profiles from the interior of the nebula (’b’ and ’c’ in Figure 3) while the left and right panels in the lower row show profiles 3″ to the left and right of the center of the bright southeastern ridge (’d’ and ’f’). Near IRS1 (’e’), at some positions along the bright ridge, the two components merge to form a broader (27 km s-1 FWHM) line with a flattened top. At the lowest detectable levels, the [Ne II] lines along the southeast ridge and in the center of the nebula span a range of 40–50 km s-1 with no evidence for higher velocity emission at lower levels.
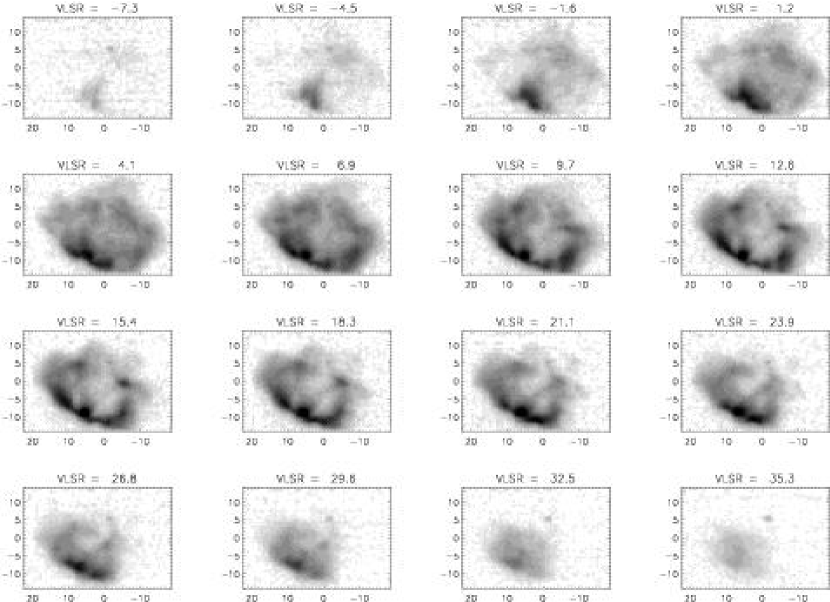
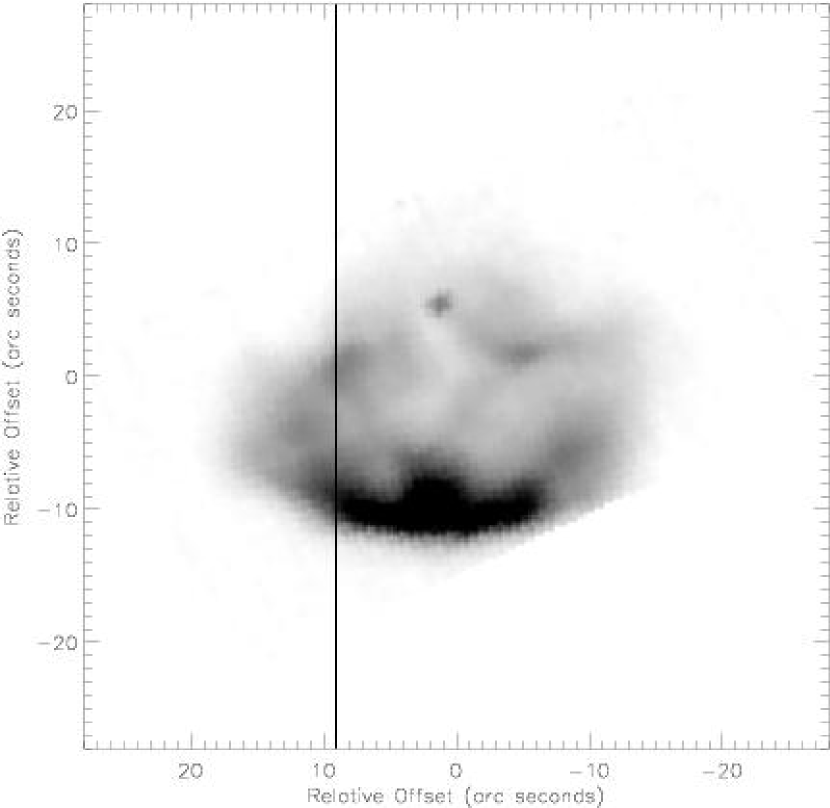
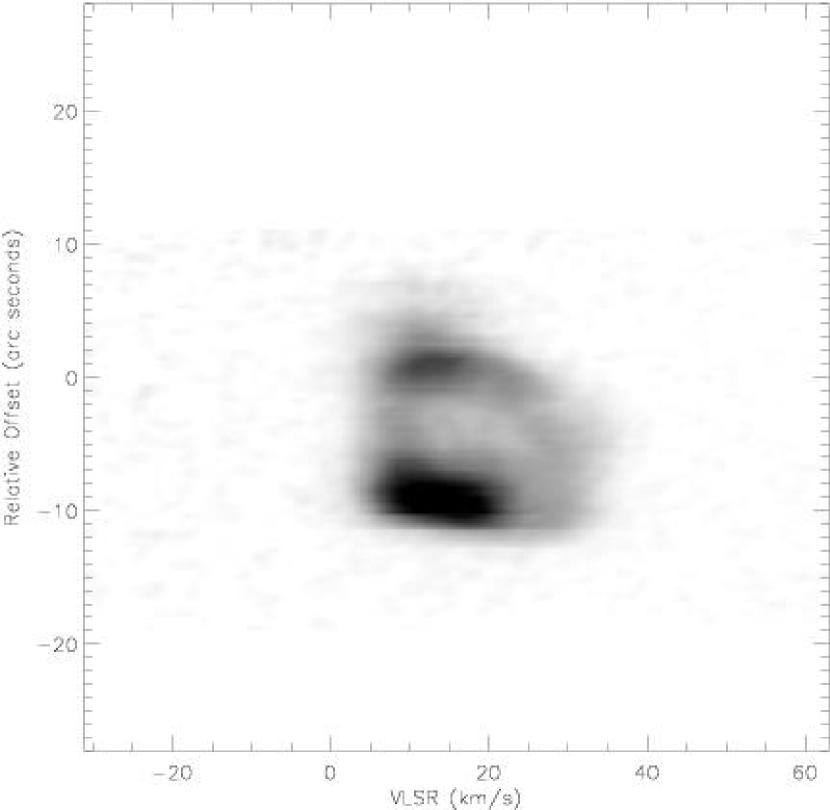
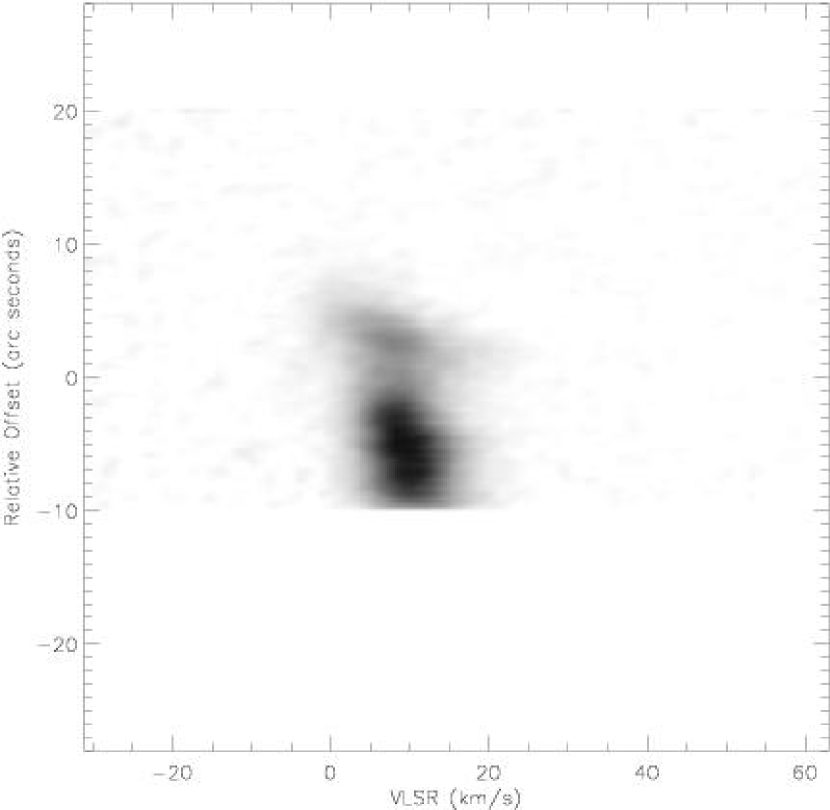
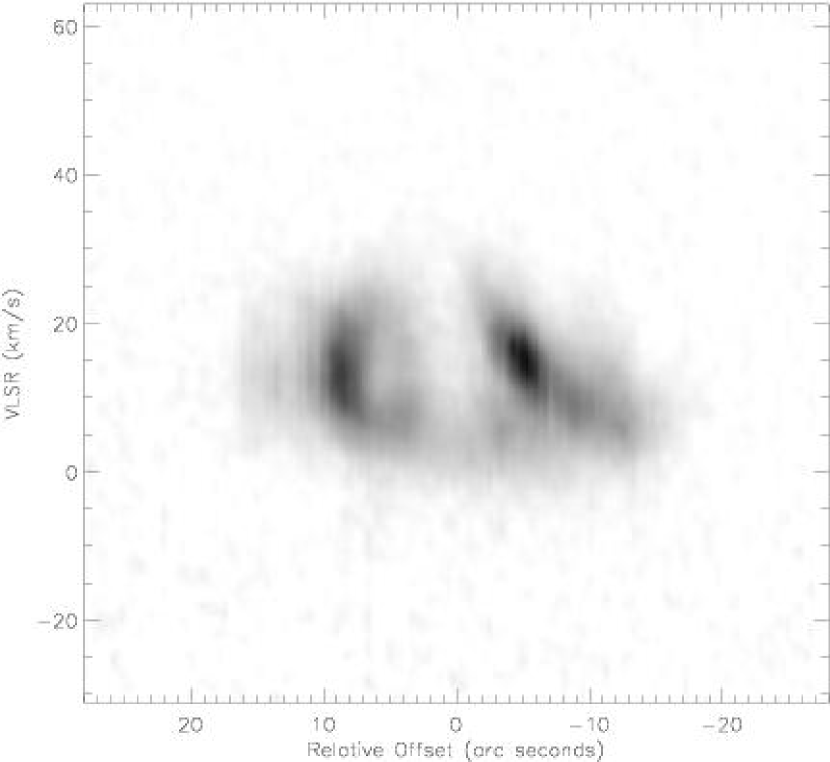
We need to visualize the extensive dynamical information made available by the [Ne II] data cube in a variety of ways. Figures 4 – 7 present channel maps at selected velocities and position-velocity (PV) diagrams along cuts through the nebula. For the PV diagrams in Figures 5 – 7, we have rotated the spatial plane in the data cube by -25o so that the symmetry axis of the nebula is vertical. The PV cuts in Figures 5 and 6 run parallel to the axis of symmetry and those in Figure 7 perpendicular to this axis.
The channel maps and PV diagrams show that the phase space within our data cube is not filled randomly. The channel maps show a small source in the southeast at the extreme velocities (-7 km s-1 to -4.5 km s-1 and 32 km s-1 to 35 km s-1), emission in the nebular interior at slightly lower velocity offsets, and a growing-then-shrinking ring and well-developed central hole at intermediate velocities. The ‘vertical’ PV cuts in Figures 5 and 6 show single lines along the northeast and southwest borders of the nebula. Cuts through the center of the nebula show that, inside the bright ring, there are usually two intensity maxima at velocities separated by about 20 km s-1. There is some indication in the PV cut through the center of the nebula (upper panel of Figure 6) for a velocity gradient from northeast to southwest across the nebula of 5-7 km s-1.
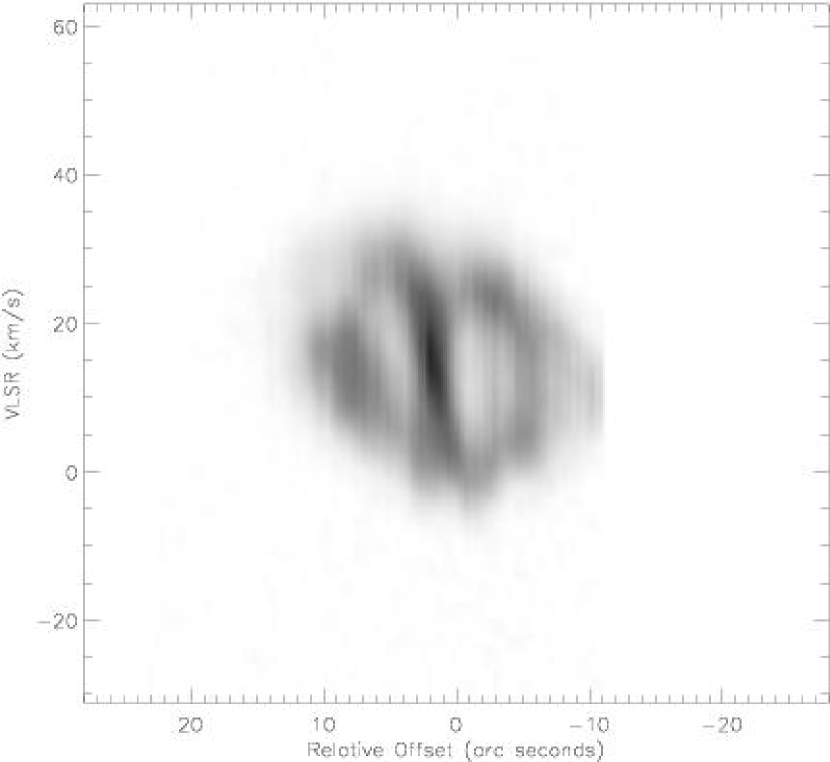
The PV cut along the bright southeast ridge (left-hand panels of Figure 7) expands on the picture provided by the spectra in the lower row of Figure 3. An almost perfect ring centered at (RA=–2″, VLSR=17 km s-1) with a diameter of (12″, 27 km s-1) is crossed by a 4″ wide bar of broad-line emission that spans the entire velocity range of the ring. The bar is canted in the spatial direction by about 2″ between its two extremes in velocity.
4 Discussion
Our spectral mapping of the 12.8 m [Ne II] line in Monoceros R2 demonstrates the unique ability of such high spatial and spectral resolution observations to trace both the distribution and kinematics of the ionized material in ultracompact HII regions. The close correspondence of the [Ne II] and radio continuum maps argues that the neon line faithfully traces the emission measure. The channel maps and spectra show that the 12.8 m line can also disentangle the distribution of emission measure among various kinematic components along a given line of sight.
The interstellar extinction toward Mon R2 at 12.8 m is modest. Natta et al. (1986) use the Brackett decrement to derive an extinction toward the nebula of A4.05μm=1.1 (A33, A0.7). Comparisons of Br and radio continuum maps and of Br and Br maps show that the highest extinction lies along a north-south ridge from north of the southeast ridge to a region beyond the northern edge of the nebula (Howard et al. 1994). With the exception of this central ridge, extinction will not prevent the [Ne II] line strength distribution from accurately tracing the ionized material.
4.1 Local Kinematics
The neon lines at some locations in Mon R2 are extremely narrow. At the position of the spectrum in Figure 2 (9.5″ W, 7″ S of the map center), the FWHM of the neon line is 8.8 km s-1. Deconvolving this line with our spectral resolution (3.4 km s-1), the FWHM is only 8 km s-1 . This measured [Ne II] line width is 0.4 times the width of a thermally broadened hydrogen line in 104 K gas though larger than the thermal width of a neon line in the same gas (4.7 km s-1). At neighboring positions, the line is almost as narrow. This width is smaller than the line widths measured toward any UCHII region using high spatial and spectral resolution observations of hydrogen recombination lines.
Where the neon lines are broader (Figure 3), the lines clearly consist of multiple narrow peaks with typical widths for the individual features of 10–14 km s-1. At those few locations with broad single lines, the non-Gaussian line shapes and the kinematics of the surrounding regions argue that the line shapes result from the overlap of narrower velocity components along the line of sight. At FWHM=10–14 km s-1, the individual features in the [Ne II] spectra are still significantly wider than the thermal width for this line in 104 K gas. There are a number of possible contributions to this additional line width: In some parts of the nebula, velocity gradients across the beam add up to 2 km s-1 to the line width (see the bottom right panel of Figure 7). If the large-scale features at 7 km s-1 and 27 km s-1 each consist of ionized material associated with several large-scale surfaces with different velocities, the blending of features will broaden the lines. Neutral gas with spatially extended emission from two velocity components separated by a few km s-1 is common in giant molecular clouds. If the neutral material is at a single velocity, the lines from ionized gas can be broadened beyond their thermal widths if the ionized material streams off of clumps in several directions. In addition, it is possible that turbulence in the ionized gas produces the 4-10 km s-1 of broadening seen in the [Ne II] lines.
The conclusion that the local line widths throughout the Mon R2 UCHII region are narrow differs from the conclusions drawn from studies of radio recombination lines from compact H II regions since the earliest days (Mezger and Hoglund 1967) and from those drawn from most radio recombination line studies of UCHII regions observed over the past two decades (see Afflerbach et al. 1996, Garay & Lizano 1999). These earlier hydrogen line studies typically imply contributions to observed line widths by local turbulence of 20–30 km s-1. In the hydrogen recombination lines, blends of multiple components separated by 5–10 km s-1 will look much more like simple Gaussian profiles. The difference between thermal widths of 4.5 km s-1 for neon and 20 km s-1 for hydrogen therefore completely alter the way we perceive the physical cause of the observed line profiles. The spectra shown as dashed lines in Figure 3 illustrate this point. At each position, we have smoothed the observed [Ne II] spectrum with a 20 km s-1 FWHM Gaussian to simulate the profile we would observe in a themally-broadened hydrogen line arising in 104 K gas. These smoothed profiles appear quite Gaussian to the eye, even when the underlying [Ne II] profile is distinctly double-peaked with a substantial velocity separation between the components.
4.2 Global Morphology, Expansion and Dynamical Lifetime of the Nebula
At high intensity levels, Mon R2 has the morphology of a
blister, broken shell, or cometary nebula (it was classified as cometary in
the radio continuum survey of Wood & Churchwell 1989b).
Our [Ne II] results are consistent with earlier radio continuum and
10 m continuum mapping in showing strongly limb-brightened
emission
on three sides, all except the northwest (Figure 1 of this paper,
Massi et al. 1985, Telesco 2002 (personal communication, available as:
http://www.astro.ufl.edu/oscir/monr2_n.gif)).
In the H and K band, where polarization studies show that most of the
continuum is scattered light
(Aspin & Walther 1990, Yao et al. 1997),
the source is limb-brightened
at all azimuthal angles (Aspin & Walther 1990).
The polarization mapping demonstrates a direct connection between
the ionized and neutral gas. The circular symmetry of the polarization
vectors over most of the nebula imply that light from IRS2
scatters off the walls of a hollow cavity and into our line of sight.
The lower degree of polarization in the southeast argues that the
local source IRS1 contributes a substantial fraction of the scattered
light along the southeast ridge.
The low
point in the near-IR shell intensity just to the east of IRS2
probably results from obscuration
since it lies along the
lane where Howard et al. (1994) had inferred significant near-IR
dust extinction.
In the 3.29 m PAH feature (Howard et al. 1994),
there is a complete ring of emission
outside of the ionized nebula, implying that there is neutral material
on all sides of the H II region, in agreement with the millimeter
HCO+ mapping results (Gonatas et al. 1992).
The uniformity of this ring indicates
that the obscuring dust lane does not extend to larger radii.
4.2.1 Spherical Expansion and Nebular Lifetime
The neon emission at velocities near the mean nebular velocity (Figure 4) forms a well-defined ring. Along and within the ring, the neon lines show a pattern of radial motion with an expansion or outflow velocity of 10 km s-1. The pattern in the channel maps where the center of the source dominates at the extreme velocities and a ring forms at intermediate velocities, as well as the position-velocity diagrams in Figures 5 – 7 supports this conclusion.
We can use the measured size and expansion velocity of Mon R2 to estimate the dynamical age of the HII region. A naive crossing time argument implies an age of 4103 years. This time shows that Mon R2 shares the problem of the UCHII region population as a whole in having a dynamical lifetime that would predict an OB star formation rate 1-2 orders of magnitude higher than the rate inferred from counts of the stars themselves. This lifetime is also significantly shorter than the age one estimates using the formalism of Spitzer (1978) which calculates the size of the H II region as a function of time assuming uniform expansion into a static neutral cloud after the initial ionization has reached equilibrium. Under this assumption, an HII region excited by a B0V star producing 1047.8 Lyman continuum photons per second (Downes et al. 1975) and having a surrounding neutral medium with a density of 106 cm-3 would reach the measured size of Mon R2 in 1.8104 years. This higher value is closer to but still less than the average value needed for consistency with the OB star formation rate.
4.2.2 Refining the Kinematic Model
Examined more closely, not all of the 20″ diameter ionized shell displays the simple velocity pattern of a radially expanding spherical shell. The two most notable differences are the lack of curvature in the vertical position-velocity cuts through the center of the nebula (Fig. 5 (bottom) and 6 (top)) and the “wrong way sign” velocity pattern along the bright southeastern ridge (Fig. 7).
Cuts through a symmetrically expanding spherical shell should show a maximum velocity splitting in the middle of the nebula and should gradually approach the cloud velocity as one reaches the rim. The vertical cuts in the bottom panel of Figure 5 and the top panel of Figure 6 indicate that the velocities of the two components have very little curvature from south to north through the inner part of the nebula and instead display a straight-line connection between two broad-line regions at the nebular rim. The velocity difference between the two components tends to decrease, however, going north from the bright southeast ridge (Fig 6 (top)).
A horizontal cut through the bright southeastern ridge (Fig. 7) differs even more from the simple expansion model. Instead of the narrow line at the cloud velocity that we see in the vertical cuts along the northeast and southwest sides of the nebula and which we would expect in a spherical expansion, this cut shows a “wrong-way sign”; a ring in PV space bisected by a broad spectral feature. The broad feature is bipolar, with a barely resolved (2″) tilt and a velocity extent of 20 km s-1. The core of this feature appears in the channel maps (Figure 4) as a bright knot 2″ southeast of IRS1 present from 7–24 km s-1. Cuts within a few arc seconds north and south of the one shown in Figure 7 exhibit similar behavior.
The velocity pattern shown in the position-velocity cuts in Figures 5 – 7 fits fairly well to a simple kinematic model in which the gas flows along the surface of a bowl-shaped nebula with the flow moving from the base of the bowl (just below IRS1) upward toward the rim. The flow originates near the southern end of the nebular symmetry axis, to the southeast of IRS 1, and flows out along the bright southeastern ridge. The circular PV feature in the horizontal cut in Figure 7 shows the initial outward motion of the gas. As the material flows upward along the curved walls of the bowl, the vertical cuts in Figures 5 and 6 display split lines. Once these walls become more or less vertical, the velocities of the features should drop toward the cloud velocity.
The broad-line feature at the center of the P-V diagram in Figure 7 either represents unresolved expansion at the apex of the flow or a separate feature due to activity unique to the dense gas immediately adjacent to IRS1. Although this source appears to be 2″ southeast of IRS1, the positional uncertainties allow for the possibility that the two objects coincide. If the broad line region does coincide with IRS1, it may represent the ionized portion of a less collimated wind that only has a high density close to the exciting star of the outflow. If this flow is fully ionized and moves at constant velocity so that density is proportional to r-2, the projected intensity in the [Ne II] line will drop as r-1 in the inner region where the density is above the critical density for the transition and drop as r-3 outside the radius where the density equals the critical density. This transition would correspond roughly to the position of the measured source diameter. For a diameter of 1.4″ and terminal velocity of 17 km s-1, the rate at which mass flows through this radius (the mass-loss rate for the star) is 310-5 M⊙ per year.
4.3 Related IR and Millimeter/Submillimeter Observations
Because Mon R2 is relatively nearby and has a larger physical size than most UCHII regions, it has a large angular size. This extent makes it possible to resolve thoroughly the structure of the ionized region and to get some idea of how the ionized gas relates to the dense core of the surrounding molecular cloud. We can also investigate the relationship between the emission nebula and the continuum sources and scattered continuum emission seen in the near-IR. In this section, we discuss the near-IR continuum and millimeter/submillimeter line and continuum observations and their relationship to our [Ne II] observations of the ionized gas.
The near-IR sources IRS1 and IRS2 both lie within the boundaries of the nebula but IRS1 is the most likely source of ionization. The highest emission measure regions are close to this source and the radio continuum and neon brightness along the southeast ridge and the shell drop with distance from IRS1. The strength and orientation of the K band polarization vectors in Mon R2 indicate, however, that IRS2 is the main source of scattered light at 2 m and that IRS2 also lies within the nebula. This scattered light dominates the broad-band continuum in the near-IR everywhere except along the southeastern bright ridge where light from IRS1 makes a significant contribution (Hodapp 1987, Aspin and Walther 1990, Yao et al. 1997). The steeply rising spectrum of IRS2 (K-L=4.4, Howard et al. 1994) means that much of its K band continuum may not be photospheric in origin, so that the dominance of IRS2 at 2 m is not a compelling argument for this source as the primary source of nebular ionization.
The bright southeast ridge of ionized gas seen in [Ne II] coincides with the northwest boundary of a dense bar of neutral gas running southwest to northeast (Henning, Chini, & Pfau 1992, Gonatas, Palmer & Novak 1992, Tafalla et al. 1997, Giannakopoulou et al. 1997). The dense neutral bar is about 60″ long with extensions along the direction of the [Ne II] emission ridges to the northwest at its two ends. These extensions and the bar form the walls off of which the near-IR radiation scatters. In the emission lines of molecules with large dipole moments like CS, the southeast ridge appears to be sliced through by a gap immediately to the southeast of IRS1 (Tafalla et al. 1997, Choi et al. 2000).
The massive molecular outflow seen in the low-J CO lines has existed for many expansion lifetimes of the ionized nebula. It has a crossing time of 105 years (Wolf et al. 1990). The inner arc minute of this flow includes some very dense material in limb-brightened shells opening to the northwest and southeast and centered on the bright bar (Tafalla et al. 1997).
4.4 Is the Nebula the Ionized Inner Boundary of a Molecular Outflow?
The existing molecular line observations of Mon R2 are not detailed enough for us to see exactly how the distribution and kinematics of the ionized and neutral material fit together. There is some evidence, however, for a relationship between the inner part of the molecular outflow and the ionized gas we see in [Ne II]. The velocity extent of the CO emission in the inner part of the outflow (Meyers-Rice and Lada 1991, Giannakopoulou et al. 1997) and the velocity range over which we see the brightest [Ne II] emission are very similar. In addition, the ionized shell seen at intermediate velocities in the [Ne II] emission nestles inside the northwestern limb-brightened shell seen by Tafalla et al. (1997) in the CS emission.
Tafalla et al. (1997, Figure 15) picture the Mon R2 molecular outflow as a pair of hyperboloidal or paraboloidal streams emerging from an exciting star or its disk located within the southeastern molecular bar. If IRS1 ionizes the inner edge of this stream, the neon emission will trace the motions of the material. The velocity patterns seen in the PV cuts in Figure 5, in particular those through the interior of the nebula where the broad line in the southeast transitions rapidly into a double line whose velocity drops slowly as one moves north, match well to what one would expect from one lobe of a hyperboloid with its axis of symmetry lying almost in the plane of the sky.
The picture of the Mon R2 UCHII region as the ionized core of a massive molecular outflow has as its particular strength its ability to reconcile the short dynamical lifetime of the UCHII region with the long lifetime of the CO outflow. One weakness it has, however, is the lack of symmetry about the likely ionizing source, IRS1. Unlike the northern outflow lobe, the dense part of the southern lobe traced by high velocity CS emission (Tafalla et al. 1997) does not appear to enclose any ionized gas. Existing observations, however, do not exclude a weaker ionized region southeast of the molecular bar. The VLA radio continuum observations do not exclude emission within the southeast neutral shell if the surface brightness is any more than a factor of three below the typical brightness along the northwestern shell. However, a recent 18″ long strip-map in [Ne II] (K. Allers, private communication) shows that there is no emission at a level 2% of the peak in the southeast ridge as far as 12″ southeast of the ridgeline.
If there really is no ionized material in the southeast, one solution to the problem is to blame the outflow on an as yet undetected source buried within the southeastern molecular bar . A separate, lower luminosity source as the origin of the outflow would explain the absence of ionization within the southern outflow lobe since not much UV radiation from IRS1 could reach the southern lobe through the channel in the southeastern bar. IRS1 would ionize the interior of the outflow’s northern lobe. The enormous power of outflows around low and intermediate mass YSOs (Bachiller 1996) makes it unecessary for the highest luminosity source, IRS1, to generate the flow. The presence of IRS1, IRS2, and an H2O maser source to the northwest (Rodriguez & Cantó 1983) near the center of the CO flow argue that an additional, more deeply embedded source in the southeast ridge is not wholly improbable.
5 Conclusions
The small thermal width of the [Ne II] line and the high dynamic range, sensitivity to both extended and compact spatial components, and good velocity resolution of the TEXES observations permit us to map the distribution and bulk motions of the ionized gas in Mon R2. The technique of high spectral resolution [Ne II] mapping offers us a way to discover and study in detail the kinematics of UCHII regions in a way which was not possible with interferometric observations of radio recombination lines.
Individual spectral lines toward the ultracompact HII region in Mon R2 are as narrow as 8 km s-1. Throughout almost all of the source, single or double component fits to the spectra imply that turbulence and small-scale motions are small compared to the sound speed. The source exhibits radial motions relative to the quiescent component of the surrounding neutral medium of 10 km s-1. A radial expansion model gives an age for the source of only 4000 years. As for many other UCHII regions, this expansion age is an order of magnitude smaller than the average UCHII region age implied by the number of such sources and the OB star formation rate in the Galaxy.
A picture in which the UCHII region represents the ionized inner rim of a giant molecular outflow fits the morphology and kinematics of the region at least qualitatively while, at the same time, offering an explanation for the large difference between the dynamical timescale of the ionized region and that of the large-scale CO outflow. This picture will need to be tested with more detailed observations of the dense quiescent and outflowing molecular gas near the ionized region.
In order to develop a clearer picture of what lies behind the UCHII region lifetime paradox and more generally of the interaction of UCHII regions with the dense cores in which they are born, we have begun to examine a larger sample of such sources. The sample will include regions with ionizing stars with a range of Lyman continuum photon fluxes and with a variety of radio continuum morphologies. We are also observing other mid-IR fine-structure lines such as the [ArIII] line at 8.99 m and the [SIV] line at 10.51 m to measure variations in the hardness of ionizing radiation within UCHII region complexes.
We thank T. Greathouse and the day and night staff at the NASA-IRTF for their invaluable assistance. This work was supported by the National Science Foundation and by grant TARP 00365-0473-1999 from the Texas Advanced Research Program. DJ acknowledges support from the Alexander von Humboldt Stiftung and the Max-Planck-Institut fuer extraterrestrische Physik during the final phases of this project. This research made use of NASA’s Astrophysics Data System.


![[Uncaptioned image]](/html/astro-ph/0307099/assets/x5.png)
![[Uncaptioned image]](/html/astro-ph/0307099/assets/x6.png)
![[Uncaptioned image]](/html/astro-ph/0307099/assets/x9.png)
![[Uncaptioned image]](/html/astro-ph/0307099/assets/x10.png)
![[Uncaptioned image]](/html/astro-ph/0307099/assets/x13.png)
![[Uncaptioned image]](/html/astro-ph/0307099/assets/x14.png)
References
- (1) Acord, J.M., Churchwell, E., & Wood, D.O.S. 1998, ApJ, 495, L107
- (2) Afflerbach, A., Churchwell, E., Acord, J. M., Hofner, P., Kurtz, S., & Depree, C. G. 1996, ApJS, 106, 423
- (3) Akeson,, R.L., & Carlstrom, J.E. 1996, ApJ, 470, 528
- (4) Aspin, C., & Walther, D.M. 1990, A&A, 235, 387
- (5) Bachiller, R. 1996, ARA&A, 34, 111
- (6) Beck, S.C., Kelly, D.M., & Lacy, J.H. 1998, AJ, 115, 2504
- (7) Beckwith, S., Evans, N.J. II, Becklin, E.E., & Neugebauer, G. 1976, ApJ, 208, 390
- (8) Bodenheimer, P., Tenorio-Tagle, G., & Yorke, H.W. 1979, ApJ, 233, 85
- (9) Carpenter, J.M., Meyer, M.R., Dougados, C., Strom, S.E., & Hillenbrand, L.A. 1997, AJ, 114, 198
- (10) Choi, M., Evans, N.J. II, Tafalla, M., & Bachiller, R. 2000, ApJ, 538, 738
- (11) De Pree, C.G., Goss, W.M., Palmer, P., & Rubin, R.H., 1994, ApJ, 428, 670
- (12) De Pree, C.G., Rodriguez, L.F., Dickel, H.R., & Goss, W.M. 1995b, ApJ, 447, 220
- (13) De Pree, C.G., Rodriguez, L.F., & Goss, W.M. 1995a, RMxAA, 31, 39
- (14) Downes, D., Winnberg, A., Goss, W.M., & Johansson, L.E.B. 1975, A&A, 44, 243
- (15) Dreher, J.W., & Welch, W.J. 1981, ApJ, 245, 857
- (16) Dyson, J.E., Williams, R.J.R., & Redman, M.P. 1995, MNRAS, 277, 700
- (17) Garay, G., & Lizano, S. 1999, PASP, 111, 1049
- (18) Garay, G., Lizano, S., & Gomez, Y. 1994, ApJ, 429, 268
- (19) Garay, G., Rodriguez, L.F., Moran, J.M., & Churchwell, E. 1993 ApJ, 418, 368
- (20) Garay, G., Rodriguez, L.F., & Van Gorkom, J.H. 1986, ApJ, 309, 553
- (21) Giannakopoulou, J., Mitchell, G.F., Hasegawa, T.I., Matthews, H.E., & Maillard, J.-P. 1997, ApJ, 487, 346
- (22) Gonatas, C.P., Palmer, P., & Novak, G. 1992, ApJ, 398, 118
- (23) Henning, Th., Chini, R., & Pfau, W. 1992, A&A, 263, 285
- (24) Herbst, W., & Racine, R. 1976, AJ, 81, 840
- (25) Hodapp, K.W. 1987, A&A, 172, 304
- (26) Hollenbach, D.J., Johnstone, D., Lizano, S., & Shu, F. 1994, ApJ, 428, 654
- (27) Howard, E.M., Pipher, J.L., & Forrest, W.J. 1994, ApJ, 425, 707
- (28) Jaffe, D.T., & Martin-Pintado, J. 1999, ApJ, 520, 162
- (29) Kawamura, J.H., & Masson, C.R. 1998, ApJ, 509, 270
- (30) Kurtz, S., Churchwell, E., & Wood, D.O.S. 1994, ApJS, 91, 659
- (31) Lacy, J.H., Beck, S.C., & Geballe, T.R. 1982, ApJ, 255, 510
- (32) Lacy, J.H., Richter, M.J., Greathouse, T.K., Jaffe, D.T., & Zhu, Q. 2002, PASP, 114, 15
- (33) Lizano, S., Cantó, J., Garay, G., & Shu, F. 1996, ApJ, 468, 739
- (34) Massi, M., Felli, M., & Simon, M. 1985, A&A, 152, 387
- (35) Meyers-Rice, B.A., & Lada, C.J. 1991, ApJ, 368, 445
- (36) Mezger, P.G., & Hoglund, B. 1967, ApJ 147, 490
- (37) Natta, A., Beckwith, S., Evans, N.J. II, Beck, S.C., Moorwood, A.F.M., & Oliva, E. 1986, A&A, 158, 143
- (38) Redman, M.P., Williams, R., & Dyson, J.E. 1995, ApSS, 233, 195
- (39) Redman, M.P., Williams, R., & Dyson, J.E. 1996, MNRAS, 280, 661
- (40) Richling, S., & Yorke, H.W. 1997, A&A, 327, 317
- (41) Rodriguez, L.F., & Cantó, J. 1983, RMxA&A, 8, 163
- (42) Spitzer, L. 1978, Physical Processes in the Interstellar Medium, (New York: Wiley Interscience)
- (43) Tafalla, M., Bachiller, R., & Wright, M.C.H. 1994, ApJ, 432, L127
- (44) Tafalla, M., Bachiller, R., Wright, M.C.H., & Welch, W.J. 1997, ApJ, 474, 329
- (45) Takahashi, H., Matsuhara, H., Watarai, H., & Matsumoto, T. 2000, ApJ, 541, 779
- (46) Thronson, H.A. Jr., Gatley, I., Harvey, P.M., Sellgren, K., & Werner, M.W. 1980, ApJ, 237, 66
- (47) Van Buren, D., & MacLow, M.M. 1992, ApJ, 394, 534
- (48) Wolf, G.A, Lada, C. J., & Bally, J. 1990, AJ, 100, 1892
- (49) Wood, D.O.S. & Churchwell, E. 1989a, ApJ, 340, 265
- (50) Wood, D.O.S. & Churchwell, E. 1989b, ApJS, 69, 831
- (51) Wood, D.O.S. & Churchwell, E. 1991, ApJ, 372, 199
- (52) Yamada, C., Kanamori, H., & Hirota, E. 1985, J Chem Phys, 83, 552
- (53) Yao, Y., Hirata, N., Ishii, M. Nagata, T., Ogawa, Y., Sato, S., Watanabe, M., & Yamashita, T. 1997, ApJ, 490, 281