Recent Results from the MAXIMA Experiment
Abstract
MAXIMA is a balloon-borne platform for measuring the anisotropy of the Cosmic Microwave Background (CMB). It has measured the CMB power spectrum with a ten-arcminute FWHM beam, corresponding to a detection of the power spectrum out to spherical harmonic multipole . The spectrum is consistent with a flat Universe with a nearly scale-invariant initial spectrum of adiabatic density fluctuations. Moreover, the MAXIMA data are free from any notable non-Gaussian contamination and from foreground dust emission. In the same region, the WMAP experiment observes the same structure as that observed by MAXIMA, as evinced by analysis of both maps and power spectra. The next step in the evolution of the MAXIMA program is MAXIPOL, which will observe the polarization of the CMB with comparable resolution and high sensitivity over a small patch of the sky.
1 Introduction
In 2000, MAXIMA-I (Hanany et al., 2000) [along with BOOMERANG-98 (de Bernardis et al., 2000), with which it shares considerable personnel and technology] was one of the first CMB experiments to detect anisotropy over a range of angular scales from several degrees down to a resolution of ten arcminutes. The pattern of temperature anisotropy, with a characteristic scale of roughly one degree, was as expected from a flat Universe with a nearly scale-invariant initial power spectrum of adiabatic perturbations, as predicted by, for example, Inflation. This was confirmed in a combined analysis (Jaffe et al., 2001) and by comparison with the many other experiments that have followed, including the recent results from WMAP (see other contributions to this volume).
In this Proceedings, we will give an overview of the MAXIMA experimental program, report on results to date from MAXIMA, including cosmological results from the analysis of primary anisotropy as well as efforts to detect departures from a Gaussian distribution and contributions from foreground emission. We will discuss comparisons with results from the WMAP experiment, and ongoing plans to use MAXIMA as a CMB polarimeter: MAXIPOL.
The MAXIMA program has so far resulted in ten letters and journal papers published by the team, several works in progress, many conference proceedings, and three Ph.D. theses (with more coming), in addition to the many works by other authors using the results. These publications contain far more information than can be reproduced here.
2 MAXIMA: Hardware and Strategy
MAXIMA is a balloon-borne platform carrying a focal plane of spider-web bolometers cooled to 100 mK. It observes the CMB at 150, 240 and 410 GHz with a resolution of better than ten arcminutes at all frequencies. The telescope is an off-axis Gregorian mount with a 1.3 meter primary mirror. The bolometers have a Noise-Equivalent Temperature (NET) of 80–90 at 150 GHz.
MAXIMA flew on August 2, 1998. The scan strategy was designed to revisit the same area of sky over a wide variety of timescales to allow for a robust investigation of possible systematic errors as well as reduction of the effects of “1/f noise”. The primary mirror chops at 0.45 Hz over about in azimuth at fixed elevation. The gondola simultaneously scans in azimuth at 0.02 Hz over an angular scale designed to result in a roughly patch of sky. The elevation of the detector was shifted in mid-flight to cover the same area. During the same flight, observations of Jupiter and the CMB dipole were carried out for calibration and beam mapping (Jupiter only). The approximately three hours spent observing a field of approximately 120 square degrees resulted in a noise per beam of tens of K.
3 Primary CMB Anisotropy: Maps, Power Spectra and Cosmological Parameters
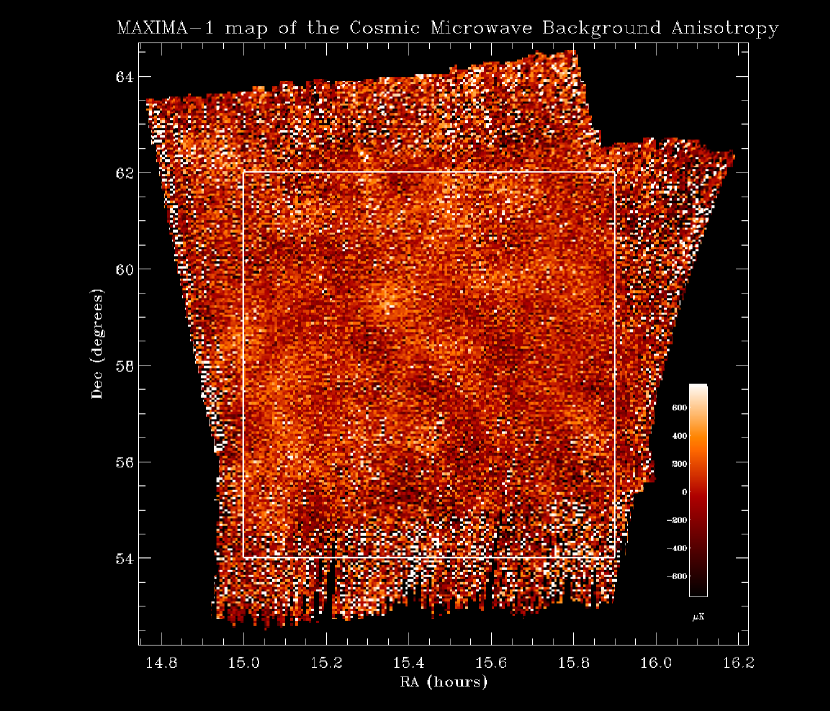
The primary scientific results from MAXIMA are in the form of CMB maps and power spectra (Hanany et al., 2000; Lee et al., 2001). They were produced by the MADCAP (Borrill, 1999) program implementing a Bayesian/maximum likelihood CMB data analysis algorithm (Bond et al., 1998, 2000).
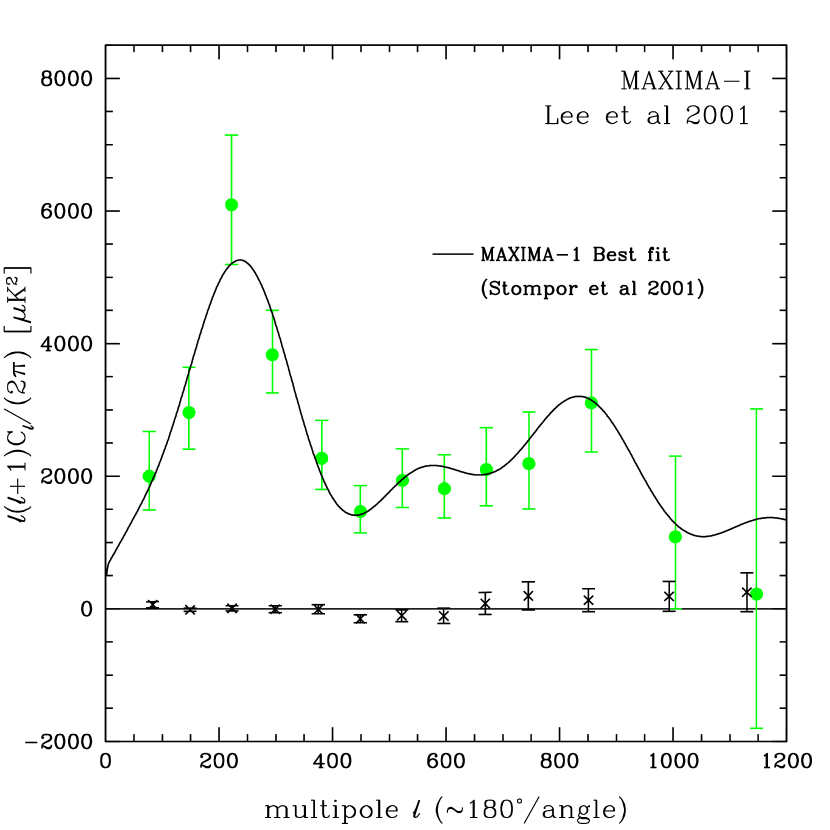
This power spectrum was then used to estimate the cosmological parameters within the paradigm of big-bang models with adiabatic initial conditions described by a nearly power-law spectrum of primordial perturbations (i.e., so-called inflationary models). The data prefer a flat Universe ( at 95% confidence) with a nearly scale-invariant spectrum of initial density fluctuations () and a baryon density as determined from big-bang nucleosynthesis (). These are all consistent with expectations from the inflationary paradigm and with determinations of the parameters from other ground- and balloon-based experiments (e.g., Halverson et al., 2002; Pearson et al., 2002; Grainge et al., 2002) and from the WMAP satellite (Spergel et al., 2003).
In addition to the work by the MAXIMA team itself, these data have also been used to test the details of quintessence or dark energy (Balbi et al., 2001) and Big-Bang nucleosynthesis (Esposito et al., 2001; Cyburt et al., 2002), as well as more exotic models with massive neutrinos, nontrivial topology, extra dimensions, isocurvature fluctuations, topological defects, etc. There remains no compelling evidence from these data for anything beyond the “standard cosmology” discussed above.
4 Foregrounds & Non-Gaussianity
Thus far, no departure from Gaussianity have been detected at a level that is signficant or would affect these results. Indeed, in the main analysis described in the previous section, we assume that the data are as simple as possible: uncontaminated by foreground emission and with both signal and noise well-described by Gaussian statistics. These assumptions can be tested and any departures from them can be quantified.
The question of non-Gaussianity is discussed elsewhere in these Proceedings (Heavens 2003) as well as in greater detail in Wu et al. (2001), which considers 82 (not independent) pixel-based tests, and in Santos et al. (2002, 2003), which calculate the cosmological bispectrum (3-point function in harmonic space). Thus far, no significant departures from Gaussianity have been detected.
The MAXIMA field was chosen to be well off of the Galactic plane and in a region of particularly low dust contrast. Nonetheless, in Jaffe et al. (2003), we show that there is a small amount of emission correlated with the pattern of dust morphology. The amplitude of the correlated emission is barely detectable, but as expected from extrapolations of the dust spectrum down to the 150-400 GHz observed by MAXIMA. This emission has no significant effect on the power spectrum or cosmological parameters.
5 MAXIMA and WMAP
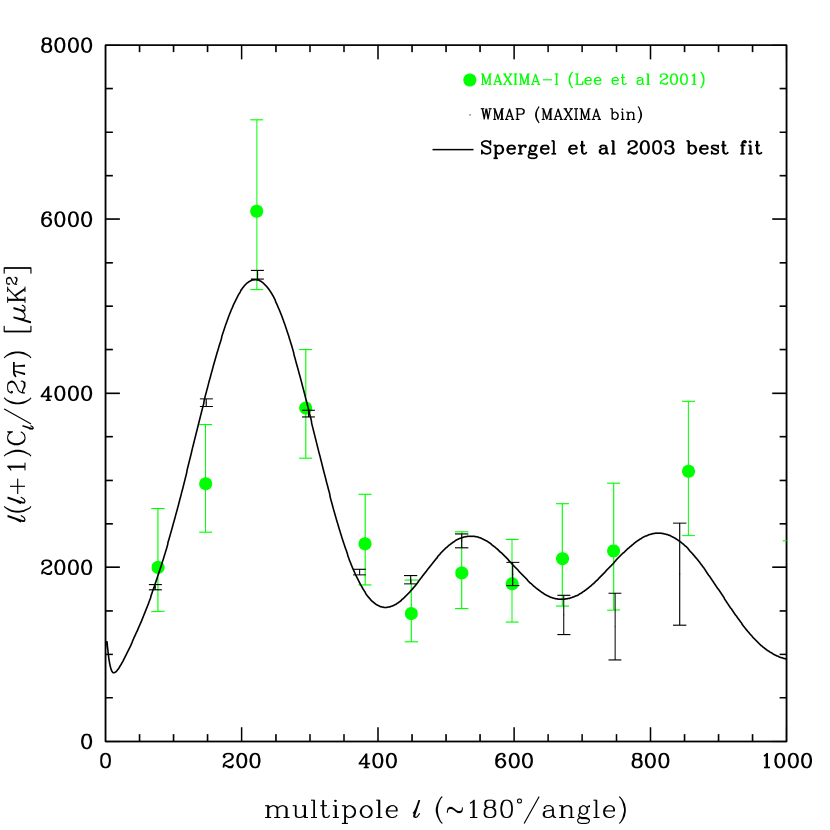
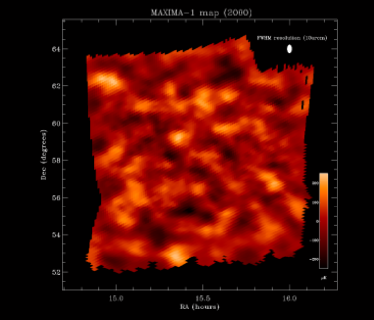
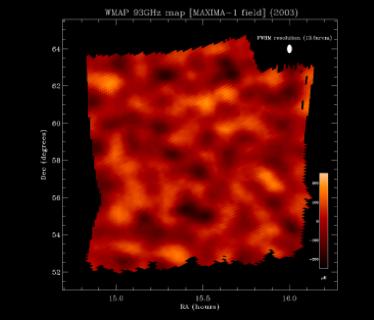
In February, 2003, data from the WMAP satellite became available, providing a benchmark against which the last few years’ ground- and balloon-based CMB results can be tested, down to WMAP’s resolution of 13 arcminutes. We will provide a full comparison of the MAXIMA data with that from the WMAP satellite in Abroe et al (forthcoming). Here, we concentrate on the comparison of publicly-available data from both teams. In Figure 3 we compare power spectra. As is evident from this figure, the field probed by the MAXIMA data shows structure with the same statistical properties as, and with higher resolution than, the all-sky WMAP data. This comparison is borne out by a side by side visual comparison of the maps of the MAXIMA region (Figure 4), and with a more detailed comparison of the overlapping portion of the two datasets as well as MAXIMA data from other campaigns (Abroe et al, forthcoming).
6 MAXIPOL
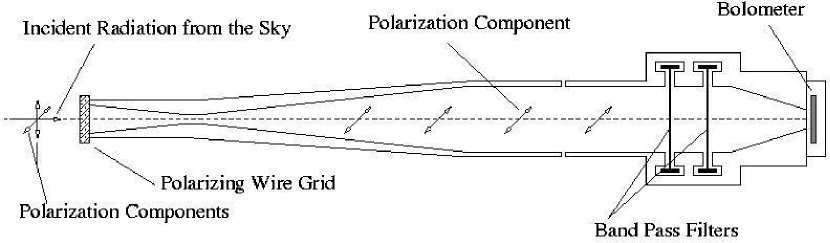
The next step in the evolution of the MAXIMA program is MAXIPOL. It consists of the MAXIMA hardware with additions to make it sensitive to the polarization of the CMB. A wire grid is placed in front of the detector horns, and a half-wave plate is rotated at 2 Hz in front (see Figure 5). This means that a single detector can observe polarization states rotated around a full on timescales much shorter than the drift in detector gain, and adding another timescale over which we can monitor for systematic effects.
MAXIPOL should have a polarization sensitivity (in ) comparable to that of WMAP and other recent experiments. It achieves this by combining the high-resolution MAXIMA optics and the cooled MAXIMA bolometers with a very deep “exposure” of a small area of sky (a few square degrees).
The MAXIPOL team is happy to report that on 24 May, 2003, just prior to the submission of these proceedings, the MAXIPOL instrument was successfully launched for a twenty-five hour flight from Fort Sumner, New Mexico.
7 Conclusions
The MAXIMA program has measured the temperature anisotropy of the Cosmic Microwave Background over angular scales from ten degrees to ten arcminutes, and over a factor of several in frequency. It has used these measurements to determine the CMB power spectrum and the parameters of the cosmological. It will soon be able to detect the polarization of the CMB, which will allow a strong check on the underlying cosmological paradigm as well as the determination of the parameters to higher precision. Similar technology will be used in the forthcoming Planck satellite mission as well as future ground- and balloon-based detectors.
References
- Balbi et al. (2001) Balbi, A., et al, Feb. 2001. Implications for Quintessence Models from MAXIMA-1 and BOOMERANG-98. Astrophys. J. Lett.547, L89–L92.
- Bond et al. (1998) Bond, J. R., Jaffe, A. H., Knox, L., Feb. 1998. Estimating the power spectrum of the cosmic microwave background. Phys. Rev. D57, 2117–2137.
- Bond et al. (2000) Bond, J. R., Jaffe, A. H., Knox, L., Apr. 2000. Radical Compression of Cosmic Microwave Background Data. Astrophys. J.533, 19–37.
- Borrill (1999) Borrill, J., 1999. Madcap - the microwave anisotropy dataset computational analysis package. http://www.nersc.gov/ borrill/cmb/madcap.html; astro-ph/9911389.
- Cyburt et al. (2002) Cyburt, R. H., Fields, B. D., Olive, K. A., Apr. 2002. Primordial nucleosynthesis with CMB inputs: probing the early universe and light element astrophysics. Astroparticle Physics 17, 87–100.
- de Bernardis et al. (2000) de Bernardis, P. et al, Apr. 2000. A flat Universe from high-resolution maps of the cosmic microwave background radiation. Nature404, 955–959.
- Esposito et al. (2001) Esposito, S., et al, Feb. 2001. Testing standard and degenerate big bang nucleosynthesis with BOOMERANG and MAXIMA-1. Phys. Rev. D63, 43004.
- Grainge et al. (2002) Grainge, K., et al, Dec. 2002. The CMB power spectrum out to l=1400 measured by the VSA. In: 6 pages with 5 figures, submitted as a letter to MNRAS.
- Halverson et al. (2002) Halverson, N. W., et al, Mar. 2002. Degree Angular Scale Interferometer First Results: A Measurement of the Cosmic Microwave Background Angular Power Spectrum. Astrophys. J.568, 38–45.
- Hanany et al. (2000) Hanany, S., et al, Dec. 2000. MAXIMA-1: A Measurement of the Cosmic Microwave Background Anisotropy on Angular Scales of 10-. Astrophys. J. Lett.545, L5–L9.
- Jaffe et al. (2001) Jaffe, A. H., et al, Apr. 2001. Cosmology from MAXIMA-1, BOOMERANG, and COBE DMR Cosmic Microwave Background Observations. Physical Review Letters 86, 3475–3479.
- Jaffe et al. (2003) Jaffe, A. H., et al, Jan. 2003. Determining Foreground Contamination in CMB Observations: Diffuse Galactic Emission in the MAXIMA-I Field. astro-ph/0301077.
- Lee et al. (2001) Lee, A. T., et al, Nov. 2001. A High Spatial Resolution Analysis of the MAXIMA-1 Cosmic Microwave Background Anisotropy Data. Astrophys. J. Lett.561, L1–L5.
- Pearson et al. (2002) Pearson, T. J., et al, May 2002. The Anisotropy of the Microwave Background to l = 3500: Mosaic Observations with the Cosmic Background Imager , astro-ph/0205388.
- Santos et al. (2002) Santos, M. G., et al, Jun. 2002. Estimate of the Cosmological Bispectrum from the MAXIMA-1 Cosmic Microwave Background Map. Physical Review Letters 88, 241302.
- Santos et al. (2003) Santos, M. G., et al, May 2003. Multiple methods for estimating the bispectrum of the cosmic microwave background with application to the MAXIMA data. Mon. Not. R. Astr. Soc.341, 623–643.
- Spergel et al. (2003) Spergel, D. N., et al, Feb. 2003. First Year Wilkinson Microwave Anisotropy Probe (WMAP) Observations: Determination of Cosmological Parameters. astro-ph/0302209.
- Stompor et al. (2001) Stompor, R., et al, Nov. 2001. Cosmological Implications of the MAXIMA-1 High-Resolution Cosmic Microwave Background Anisotropy Measurement. Astrophys. J. Lett.561, L7–L10.
- Wu et al. (2001) Wu, J. H., et al., Dec. 2001. Tests for Gaussianity of the MAXIMA-1 Cosmic Microwave Background Map. Physical Review Letters 87, 251303.