Near Infrared Spectra of Type Ia Supernovae
Abstract
We report near infrared (NIR) spectroscopic observations of twelve “Branch-normal” Type Ia supernovae (SNe Ia) which cover the wavelength region from 0.8-2.5 m. Our sample more than doubles the number of SNe Ia with published NIR spectra within three weeks of maximum light. The epochs of observation range from thirteen days before maximum light to eighteen days after maximum light. A detailed model for a Type Ia supernovae is used to identify spectral features. The Doppler shifts of lines are measured to obtain the velocity and, thus, the radial distribution of elements.
The NIR is an extremely useful tool to probe the chemical structure in the layers of SNe Ia ejecta. This wavelength region is optimal for examining certain products of the SNe Ia explosion that may be blended or obscured in other spectral regions. We identify spectral features from Mg II, Ca II, Si II, Fe II, Co II, Ni II, and possibly Mn II. We find no indications for hydrogen, helium or carbon in the spectra. The spectral features reveal important clues about the physical characteristics of SNe Ia. We use the features to derive upper limits for the amount of unburned matter, to identify the transition regions from explosive carbon to oxygen burning and from partial to complete silicon burning, and to estimate the level of mixing during and after the explosion.
Elements synthesized in the outer layers during the explosion appear to remain in distinct layers. That provides strong evidence for the presence of a detonation phase during the explosion as it occurs in delayed detonation or merger models. Mg II velocities are found to exceed 11,000 to 15,000 km s-1 depending on the individual SNe Ia. That result suggests that burning during the explosion reaches the outermost layers of the progenitor and limits the amount of unburned material to less than 10% of the mass of the progenitor. Small residuals of unburned material are predicted by delayed detonation models but are inconsistent with pure deflagration or merger models. Differences in the spectra of the individual SNe Ia demonstrate the variety of these events.
1 Introduction
Type Ia supernovae (SNe Ia) are excellent distance indicators due to their brightness and apparent homogeneity. The high quality of SNe Ia observations has allowed good estimates of the Hubble constant Hamuy et al. (1996); Höflich & Khokhlov (1996); Müller & Höflich (1994); Nugent et al. (1997); Ries et al. (1995); Phillips et al. (1999), and provided strong evidence for the existence of “dark energy” Riess et al. 1998a ; Perlmutter et al. (1999). The quest for the nature of the dark energy requires even higher accuracy Weller & Albrecht (2001). Accurate determinations of cosmological parameters will require a more thorough understanding of the properties (e.g., composition and metallicity) of the progenitors of SNe Ia, as well as of the nature and time-evolution of the explosion mechanism.
When we observe a supernova, we are collecting light that has been emitted from a rapidly expanding envelope. As expansion of the explosion products reduces the density, the photosphere recedes toward the center in mass space. Deeper layers of the supernova become visible. Because SNe Ia ejecta expand homologously soon after the explosion, we can measure the chemical composition of the layers of explosion products by observing the Doppler velocities of elements within the layers.
The observed characteristics of SNe Ia strongly suggest that these events are the thermonuclear explosions of carbon/oxygen (C/O) White Dwarf (WD) stars Hoyle & Fowler (1960). Within this general picture, two classes of models are most likely: 1) The explosion of a CO-WD, with mass close to the Chandrasekhar limiting mass (). The progenitor accretes mass through Roche-lobe overflow from an evolving companion star Whelan & Iben (1973) and the explosion is triggered by compressional heating near the WD center. 2) The explosion of a rotating configuration formed from the merger of two low-mass WDs, caused by the loss of angular momentum through gravitational radiation Webbink (1984); Iben & Tutukov (1984); Paczyński (1985). Observations of optical light curves and spectra favor the first model for the majority of SNe Ia.
For models, it is believed that the burning front begins as a subsonic deflagration, but the time evolution of the burning front remains an open question. It is not known whether the deflagration front burns through the entire WD Nomoto et al. (1984), or alternatively, makes a transition into a supersonic detonation mode as suggested in the delayed detonation (DD) model Khokhlov (1991); Woosley & Weaver (1994); Yamaoka et al. 1992 . Although DD models have been found to reproduce the optical and infrared light curves and spectra of “typical” SNe Ia reasonably well Höflich (1995); Höflich & Khokhlov (1996); Fisher et al. (1998); Nugent et al. (1997); Lentz et al. (2001), the calculations assume spherical geometry, and the propagation of the deflagration burning front is parameterized.
While it is preferable to model SNe Ia using full 3-D calculations, at the present time there are limitations to that approach. Although the propagation of a detonation front is well understood, the description of the deflagration front and the deflagration to detonation transition (DDT) pose problems for the models. The current state of the art in 3-D modeling of the deflagration burning front is limited to a description of the large scale instabilities that dominate only during the early phase of the explosion Livne (1993); Khokhlov (1995); Reinecke et al. (1999); Lisewski et al. (2000); Khokhlov (2001). These models do not resolve small scale instabilities, do not use realistic WD structures and do not include instabilities due to differential rotation or pre-existing velocity fields all of which are thought to be important for the late stages of deflagration and the transition from a deflagration to a detonation front. For a discussion, see (Höflich et al. 2003; and references therein). The current 3D calculations do not show a DDT but remain in the deflagration burning phase. These models produce structures with a significant fraction of the WD () remaining unburned in the outer layers. Despite some uncertainties, a common feature of pure deflagration models is the complicated morphology of the burning front and the burning products. Plumes of burned material fill a significant fraction of the WD, and unburned or partially-burned material can be seen near the center. Thus iron-rich elements are not confined to the central region as in 1-D models. While the expansion of the envelope becomes almost spherical, the inhomogeneous chemical structure will fill about 50 to 70% of the volume of the expanding envelope. This prediction that both burned and unburned material will be present throughout the envelope is not what is observed. Our data suggest that there is a distinct layering of the chemical products. In pure deflagration models, a homogeneous, unburned layer of 0.2 to 0.3 remains on top because this region quickly attains velocities in excess of the sound speed and, consequently, cannot be reached by the rising plumes. If a DDT occurs at densities required to reproduce normal-bright SNe Ia, most of the unburned fuel in these outer regions will be burned to intermediate mass or iron-group elements during the detonation phase. That would eliminate the chemical inhomogeneities but is inconsistent with observations of intermediate mass elements in the spectra of SNe Ia. The study of NIR spectra can help resolve these contradictions.
The line identifications we present here are the result of detailed model calculations of the hydrodynamics and nucleosynthesis in SNe Ia as discussed in Section 4.1. The position of the photosphere and the line forming region of the supernova is calculated. Specific line identifications result from model calculations that predict the relative line strengths at the epoch of our observations.
Near infrared (NIR) analysis promises to provide significant new constraints on SNe Ia physics by providing access to information about progenitor composition and explosion products. NIR spectra reveal features from elements such as He, C, O, Mg, and Mn that are undetectable or obscured by line blending at other wavelengths. Mg II (0.922 and 1.0926 m) is an indicator of the boundary between explosive carbon and oxygen burning during the explosion. Mn II (0.944 m) is a probe of the burning temperature in the region of incomplete silicon burning. The Ca “infrared triplet” (0.850, 0.854, 0.866 m) is strong enough to respond to primordial calcium abundances but the Ca II line at 1.268 m will be from freshly synthesized material and indicates the location of the region with partial Si burning. C I (0.93 and 1.13 m) is an indicator of the presence of unburned material from the progenitor WD. The position and development with time of blended lines from iron-group elements ( m) is an indicator for the transition from partial to complete silicon burning. Relative photometric data are available for nine of the SNe in our sample. We are able to make comparisons between the decline rate () Phillips et al. (1999) and our NIR data. The parameter is the decline in apparent brightness between the peak and fifteen days later. The calibrated brightness at maximum is unavailable for these data and peak absolute brightness measurements from other sources contain uncertainties of mag which makes that parameter unsuitable for comparison.
SNe Ia have been observed extensively at optical and radio wavelengths but only recently have improvements in detector technology opened the NIR window to objects as dim as a typical SNe Ia. Relatively few NIR spectra have been published: NIR spectroscopic observations obtained within three weeks of maximum light are available for only four normal-bright SNe. SN 1986G was observed 13 days after maximum light Bowers et al. (1997). Six spectra from -8 to +8 days were obtained from SN 1994D Meikle et al. (1996). Spectra of SN 2000cx were obtained at -8 and -7 days before maximum by Rudy et al. (2002). An excellent time sequence for SN 1999ee from -9 to +42 days was obtained by Hamuy et al. hamuy02 (2002). A similar set of NIR spectra were obtained by Gerardy of the subluminous SNe Ia SN 1999by between -4 to +28 days (Höflich et al. 2002). In addition, NIR spectra obtained more than 25 days after maximum light have been published by Jha (1999), Bowers (1997), and Hernandez (2000). Although the data are significant, the actual number of SNe Ia observed in the NIR remains small. A larger sample is critical to address the diversity of SNe Ia and, in particular, the role of pre-conditioning of the WD prior to the explosive phase. The explosion depends on the WD initial conditions which are determined by the progenitor evolution from the main sequence Umeda et al. (2000); Domínguez & Höflich (2000), during the accretion phase and during the evolution towards the runaway Nomoto (1982); Garcia-Senz & Woosley (1995); Höflich & Stein (2002).
We present NIR spectra of twelve SNe Ia which more than doubles the number of SNe Ia with published NIR observations. We provide identification of significant features in the spectra and their location in the expanding envelope. We compare the results to a model of a normal-bright SNe Ia. Data acquisition and reduction methods are discussed in § 2. Techniques used to determine the epoch and brightness of the supernovae in our sample are described in § 3. Methods of analysis including details of the reference model for a delayed detonation explosion of a normal-bright Type Ia supernova are presented in § 4. The spectral features are identified and discussed in § 5. Implications from the data for the models are discussed in § 6. Conclusions are presented in § 7. The observational details of discovery, identification and our spectroscopic observations for each supernova are provided in Appendix A.
2 Data Acquisition and Reduction
Low and medium resolution, NIR spectra from SNe Ia were obtained using the 3.0 meter telescope at the NASA Infrared Telescope Facility (IRTF) with the SpeX medium-resolution spectrograph Rayner et al. (1998). The SpeX instrument provides single exposure coverage of the wavelength region from 0.8-2.5 m. Using a grating and prism cross-dispersers, the spectral resolution is and in single prism mode . SpeX also contains an infrared slit-viewer/guider covering a 60x60 arcsec field-of-view at 0.12 arcsec/pixel. The detectors are a Raytheon 1024x1024 InSb array in the spectrograph and a Raytheon 512x512 InSb array in the infrared slit-viewer Rayner et al. (2002).
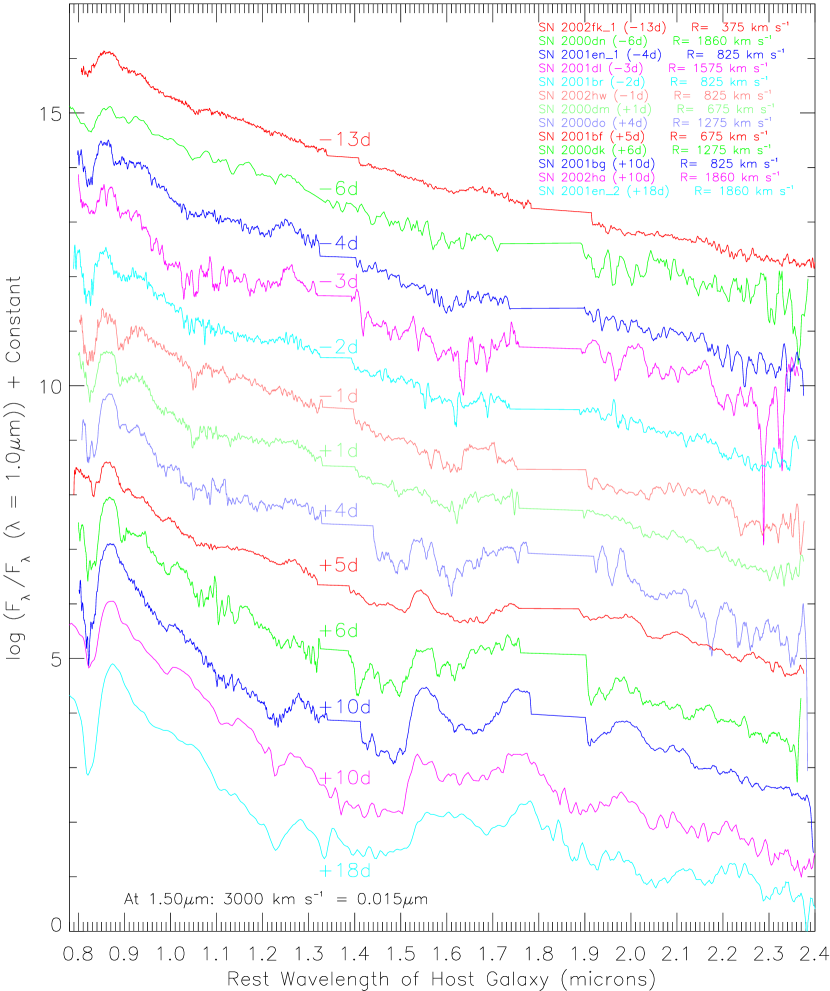
Thirteen NIR spectra were obtained at the IRTF from twelve SNe Ia at epochs ranging from thirteen days before maximum light to eighteen days after maximum light (Fig. 1). Two spectra were obtained three weeks apart from SN 2001en. All spectra cover the wavelength region from 0.8-2.5 m. Six of the spectra in our sample were obtained using the 0.8 arcsec slit in cross-dispersed (SXD) mode which gives R=750. Four spectra were obtained with the 0.5 arcsec slit in SXD mode at R=1200. Three of the spectra were obtained using the single prism, low resolution (LRS) mode with the 0.3 arcsec slit at R=250. Table 1 provides the details for each observation.
For each set of exposures, care was taken to align the slit to the parallactic angle. In a few cases, light contamination due to the position of the host galaxy made it impossible to achieve the exact parallactic angle. However, these observations had relatively low air-masses (less than 1.5) so the errors due to atmospheric refraction should not be significant.
The guiding method was determined by target luminosity and weather conditions. For SNe brighter than , the SpeX guider is able to maintain the centroid of the target in the slit by guiding on the spill-over flux from the object in the slit. When the target is not bright enough to produce sufficient spill-over, we use the IRTF optical offset guider or the offset method with the SpeX guider on another object in the field of the SpeX imager, such as the core of the host galaxy, for the guider reference.
Saturation was not a concern due to the faintness of our objects, but OH lines are numerous and highly variable in the NIR. To avoid an increase in background noise due to poor OH removal when the pairs were subtracted, we limited the exposure time to 150s per exposure. Each set was also limited to ten exposures so that the time required to complete each set, including calibration, was within the time scales of atmospheric variability. The source was nodded along the slit using an A_B_B_A_A_B_B_A_A_B pattern for a total of 25 minutes integration time. Calibration images from A0V standard stars were obtained in a sequence similar to the SN exposures, but with shorter exposure times. The standards were selected to be as near as possible to the time and airmass of the SN. Each observation set also included calibration images for flat fielding using an internal light source, and wavelength calibrations using an Argon lamp through the slit.
The data were reduced using a package of IDL routines specifically designed for the reduction of SpeX data (Spextool v. 2.1; Cushing, Vacca & Rayner 2002). These routines perform pair subtraction, flat-fielding, aperture definition, spectral tracing and extraction, residual sky subtraction, host galaxy subtraction, and wavelength calibration for data acquired in both the prism mode and the cross-dispersed mode. Corrections for telluric absorption were performed using the extracted spectrum of an A0V star and a specially designed IDL package developed by Vacca, Cushing, & Rayner (Spextool_Extension; 2002). These routines generate a telluric correction spectrum by comparing the spectrum of an A0V star, observed close in time and airmass to the target SN, to a model A0V spectrum that has been scaled to the observed magnitude, smoothed to the observed resolution and shifted to the observed radial velocity. The telluric correction spectrum is then shifted to align the telluric absorption features seen in the SN spectrum and divided into the target spectrum.
Spextool removes problems with background irregularities by defining the aperture width and background level for each subtracted image. The flux level along the slit includes a positive image of the SN at the A position and a negative image of the SN at the B position. The position, shape, and slope of the background level are due to sky and instrumental noise, plus contamination from the host galaxy. The aperture width for each pair is selected to enclose the region of supernova light within the slit. The full width of the supernova in the image is 1.2-1.5”, but optimal signal to noise ratio in the reduced spectrum was achieved by narrowing the aperture to 0.7-0.9”. The narrower aperture eliminates high noise levels from the wings of the supernova signal. The background level in the slit is defined by Spextool using a fit through four regions, in two pairs, that bracket each aperture. Typically this is a linear fit, but for noisy spectra a second or third order fit was more effective.
The Spex Guider was used to obtain J and K band images of the field surrounding some of our targets in order to estimate levels of galactic contamination. We reduced the spectra using background levels measured photometrically from these images and compared the results to spectra reduced using Spextool. We found the energy distribution for the spectra produced by both methods to be parallel through the entire wavelength region. The differences in flux levels between the spectra produced by the two methods were less than the noise levels. We conclude that contamination from the host galaxy does not influence the slope of the continuum in spectra reduced using Spextool.
The spectra are extracted individually for each AB pair of images and the individual multi-order spectra from each set were combined to produce a single spectrum. Next, the spectra from the various sets for each object were combined. The orders of the final combined spectra were then merged using a Spextool routine that allows the orders to be scaled and then averaged in their mutual overlap regions.
3 The Supernovae
Details of discovery and photometry for each SN in our sample are compiled in Appendix A. Observational details may be found in Tables 1 and 2.
3.1 The Epochs of Observation
A well-calibrated light curve, sufficiently sampled to clearly define the maximum brightness will establish the maximum light date to within a day or two. W. D. Li and M. Papenkova from the Katzman Automatic Imaging Telescope KAIT and the University of California at Berkeley have kindly provided B-band relative light curves for nine SNe covering ten of the spectra in our sample. These light curves allow us to define the date of to days and to mag. The relative nature of the data do not provide information about peak brightness. Epochs used for discussion always refer to the date of maximum light in V and is taken to be days.
Light curves for the other SNe in our sample are found in lists of amateur photometric data, but these data have been collected from many observers without calibration between the instruments or observers. Interpretation of such light curves is difficult due to the number of obvious outliers. Uncertainties of five to seven days for the date of maximum light and mag in observed luminosity are not uncommon. For our analysis we use amateur photometric data compiled by VSnet (The Variable Star Network) and AUDE (Association des Utilisateurs de Détecteurs Electroniques). A good source for data from individual SNe is The Latest Supernova Page, compiled and maintained by David Bishop LSP (2002).
3.2 Uniformity of the Sample
3.2.1 Absolute Brightness
All SNe in our sample were identified spectroscopically as Type Ia using the Si II feature at which defines the class. The observed maximum luminosities indicate that all events are, within uncertainties, normal-bright events. is computed for each event in the sample using
where km s-1Mpc-1 and .
The results are presented in Table 2. Galactic foreground reddening data are from Schlegel, Finkbeiner, & Davis Schlegel98 (1998) as reported in the NASA/IPAC Extragalactic Database NED . We do not account for reddening from the host galaxy. The NED database also provides the recession velocities of the host galaxies. All SNe in our sample may be considered to be in the Hubble flow since uncertainties in the recession velocity of the host produce uncertainties in our calculation of that are much less than the mag uncertainties due to the photometric data. Our calculation of is intended as a demonstration that, within the uncertainties, our sample contains only normal-bright SNe Ia. The results should not be interpreted as a reliable measure of absolute brightness for these events.
3.2.2 Empirical Photometric Parameters
Values for (B-band) have been calculated for ten of the spectra in our sample. The values range from mag and are listed in Tables 2 and 3. was directly calculated from the photometric data and not by fitting the data to templates. The uncertainties of mag provide sufficient resolution to distinguish fast decliners from slow decliners. We do not find any correlation between the parameter and the expansion velocity of explosion products.
4 Methods for the Data Analysis
Line identifications for the spectral features are based on detailed calculations of the explosion, the position of the photosphere and the line forming region of the supernova. Opacity and optical depth are calculated as a function of radius (see Figure 8, Höflich et al. 1998). Together with synthetic spectra, these calculations allow us to identify features in the observed spectra. Details of the model used for this analysis are provided in the following section.
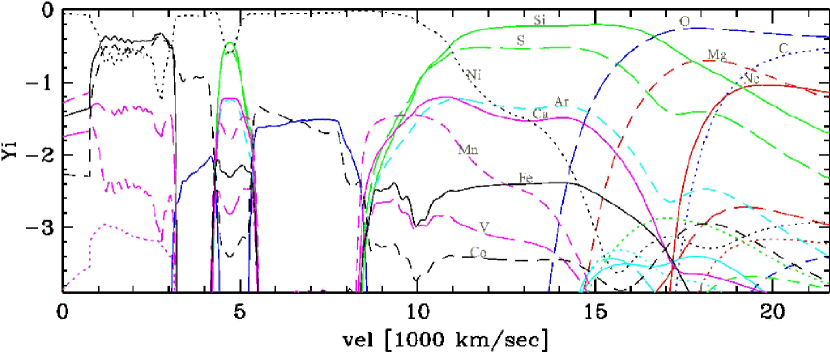
All models that are rich in C and O, such as or WD mergers, produce lines with similar excitation values independent of the details of the particular model. For example, in the region of incomplete Si burning, the burning products maintain a similar ratio of Si to S, Ar, and Ca (see Figure 3). Therefore we can confidently use a reference model for a normal bright Type Ia supernova to provide line identifications for the spectra presented here. Specific line identifications are made by calculating the relative line strengths at the epoch of our observations. Many of the lines we discuss here have been identified in previous work Wheeler et al. (1998); Höflich et al. (1998, 2002). It is possible however, for different model scenarios (e.g. mergers or sub-Chandrasekhar mass models/Helium Detonations) to create different layering structures that produce a similar feature at a given wavelength but due to a different element. For example, near maximum light, both and HeDs produce a line at about 1.05 but which is produced by Mg II and He I, respectively. Additional line features (or their absence) of the same ion are critical. Identifications based on a single line cannot be positively confirmed. The Mn II line at 0.922 m is an example of an identification that is consistent with our standard model but is uncorroborated by a second Mn II line. It is a significant advantage that the large wavelength coverage of our spectra is able to reveal multiple lines for many elements in the NIR. The line identifications for Mg II, Ca II, Si II, Fe II, Co II, Ni II are based on multiple lines in our spectra.
We measure the Doppler shifts of the lines to obtain the expansion velocities of the elements that produce the features. Since SNe Ia begin homologous expansion soon after the explosion, the radial velocities reveal the the radial distribution of explosion products.
4.1 The Reference Model for the Line Identification
Calculations of the reference models were performed using our hydrodynamical radiation transport code HYDRA which includes hydrodynamics, ray and low energy photon transport schemes, a nuclear reaction network and detailed atomic networks to solve the NLTE rate equations for the atomic level populations (see Höflich et al. 2002, Höflich 2002, and references therein). The explosion models, light curves, and synthetic spectra are calculated in a self-consistent manner. Given the initial structure of the progenitor and a description of the nuclear burning front, the light curves and spectra are calculated from the explosion model.
Our reference model is based on a delayed detonation scenario because of the success of such models in reproducing observed light curves and spectra in the optical and NIR. The model 5p028z22.25 was calculated previously with parameters appropriate for the class of normal-bright SNe Ia Höflich et al. (2002). The two significant parameters affecting the chemical composition of the model are central density () and the deflagration to detonation transition density ().
The model has not been altered or tuned for this paper. It is based on the explosion of a Chandrasekhar mass WD with a central density g cm-3. The WD evolved from a main sequence progenitor of with solar metallicity Domínguez & Höflich (2000). The rate of burning during the deflagration phase has been adjusted in order to reproduce 3-D results for the deflagration. The transition from deflagration to detonation is triggered when the density at the burning front drops below g cm-3. From the physical point of view, should be regarded as a convenient way to adjust the amount of material burned during the deflagration phase.
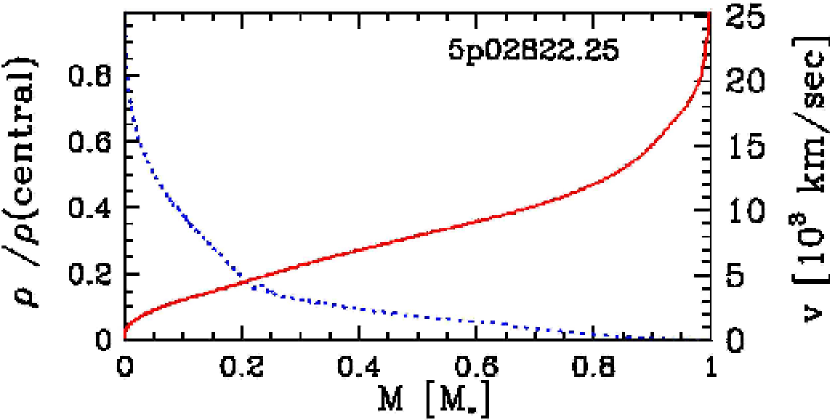
As mentioned above, the spectra provide direct information on the velocity but not on the mass because only a fraction of the total mass is involved in the spectral formation at a given time (Höflich 1995). We use a different approach to estimate the mass/velocity relationship. In Fig. 2, the density and velocity profiles are given as a function of the total mass. We use to estimate the amount of mass above the photosphere in the discussions below. The reference model can be used for this estimate because, for all DD models the entire WD is burned. As a consequence, the values of and as plotted in Fig. 2 are not sensitive to specific model parameters (Höflich et al. 2002).
The chemical structure of our reference model is given in Fig. 3. Qualitatively, the final burning products can be understood in terms of the relation between the hydrodynamical and the individual nuclear time scales. The hydrodynamical time scale is given by the total energy release during the explosion. The nuclear time scales are determined by the peak temperature during burning, which depends on the energy release per volume because the energy density is radiation dominated. Thus, the density (and the initial C/O ratio) are the dominant factors that determine the final composition of a zone. The actual density under which burning occurs depends on the expansion of the WD during the explosion. Therefore, the distribution of the nuclear burning products is very model dependent. NIR spectra reveal the chemical distribution of certain explosion products that permit us to probe the explosion physics, in particular the pre-expansion of the WD and progenitor properties.
In model regions of high density and, thus, high temperature (), burning proceeds up to nuclear statistical equilibrium (NSE) and Fe-peak elements are produced. The isotopic composition of Fe-peak elements in the ejecta is determined by the electron captures occurring at high temperatures and densities near the center of the white dwarf. As a result, the isotopic composition is highly sensitive to the initial density of the dwarf and to the velocity of the deflagration. In our model, the region of complete burning to NSE extends up to about 10,000 km s-1. Between km s-1, intermediate mass elements are produced during explosive oxygen burning. A wide range of burning conditions () produces very similar element ratios in the main products of burning (Si, S, and Ca). Among the products in this region of incomplete Si burning, only manganese and vanadium exhibit a significant gradient in the quantity of product as a function of velocity (or temperature). This makes Mn and V potentially important diagnostic tools (see below). The extreme outer region ( and km s-1) undergoes explosive carbon burning with O, Mg and Ne being the main products.
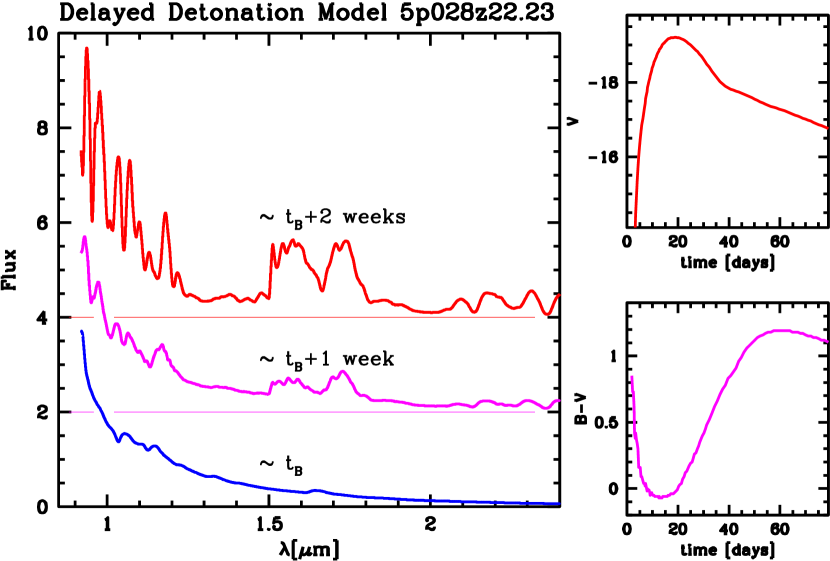
Detailed NLTE spectra and light curves have been calculated, based on the explosion model. The model computes the position of the photosphere and the line forming region and calculates the relative line strengths. Synthetic spectra resulting from these calculations are shown in Fig. 4. The model reaches a maximum brightness in B and V of and magnitudes at about 17.5 and 18.5 days, respectively.
The NIR is essential for measurement of freshly synthesized magnesium because the high cross section of Mg lines in the optical and UV means that very small amounts of Mg are required to form strong features in those regions of the spectrum. Magnesium lines in the optical and UV will be dominated by absorption from primordial magnesium if the progenitor has solar metallicity. In a normal-bright SNe Ia up to about maximum light, the photosphere is formed entirely in layers of incomplete burning. The spectra are dominated by elements of incomplete burning such as Mg, Si, S and Ca. To form strong Mg II lines at m and m, the Mg abundance must be larger than 1 to 2% which is much greater than the primordial Mg level. Such a Mg abundance is expected from explosive carbon burning. NIR lines from Mg II are thus able to probe the region of transition from carbon to oxygen burning but optical Mg II lines do not.
Soon after maximum light, features from iron group elements begin to dominate the spectrum. Most prominent is the development of the “pseudo” emission features between 1.5 and 1.8 m which are produced by blends of Co, Ni, and Fe lines. Fig. 4 illustrates the predicted development of this feature. Line blanketing increases the total opacity so that the features are formed at a larger radius than the photosphere. In addition, the NIR lines are due to transitions between highly excited atomic levels. The energy differences are small compared to the excitation energy, but comparable to thermal energies. The departure coefficients of the upper and lower level are similar, and the source functions are approximately a black body. As a result of the increased effective area and high emissivity, the observed flux at these wavelengths is increased. The region from m has fewer of these iron group lines and, consequently, the flux is lower. Two peaks appear at 1.60 m and 1.75 m with a notch between them that is due to a gap in the blended lines at about m. As slower material passes through the photosphere, a broader range of velocities is detected. The features begin to smear out, and the gap is gradually filled. Simultaneously, strong lines of Fe/Co/Ni appear above 1.9 m and also at shorter wavelengths. For more details, see Wheeler et al. (1998); Höflich et al. (2002), and below.
4.2 Doppler Shifts of Features
During the first few weeks after the explosion, the primary opacity source for SNe Ia in the NIR is Thomson scattering with some contribution from free-free emission. The continuum-forming region is better defined in velocity in the NIR than it is in the optical and UV, where resonance transitions influence the opacity and distort the photon forming region.
In rapidly expanding, scattering dominated envelopes, the lines are P-Cygni like. The absorption component of the line is formed when photons from the photosphere are scattered out of the line of sight of the observer into other directions and frequency bands. Photons may also be absorbed by an atom. In either case, the spectrum will show an absorption feature, and we can use the Doppler shift of the absorption components of lines to measure the expansion velocity of the line forming region. In practice, the radial change of the line source functions and opacities with distance may introduce an error. From the models, the error in velocity is estimated to be to ( km s-1).
As expansion reduces the density and opacity, deeper layers are revealed at later times, and the measured Doppler shift decreases. However, once the layer containing a particular element has completely passed outward through the photosphere, the observed absorption feature from that element is characterized by a velocity close to the inner edge of the layer. The feature will subsequently decrease in strength as the column density drops due to the expansion of the layer, but the Doppler shift of the absorption minimum will not change. In reality, lines at similar wavelength may complicate the situation. For instance, the Mg II line at about 1.05 m has been observed to show exactly this behavior of weakening while displaying a constant Doppler shift (Bowers et al. 1998). A Co II line at a similar wavelength occurs a few days after maximum light when the photosphere is formed in the Fe/Ni core. The presence of the Co II line will displace the apparent location of the absorption minimum of Mg II.
5 Analysis of the Data
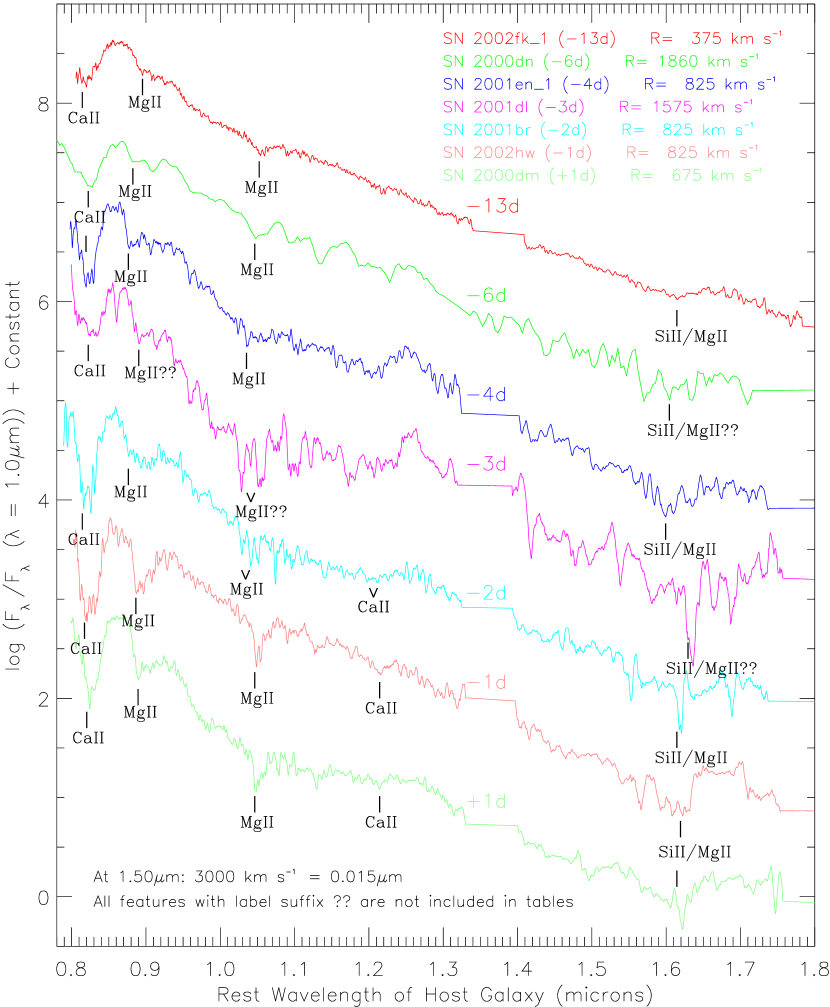
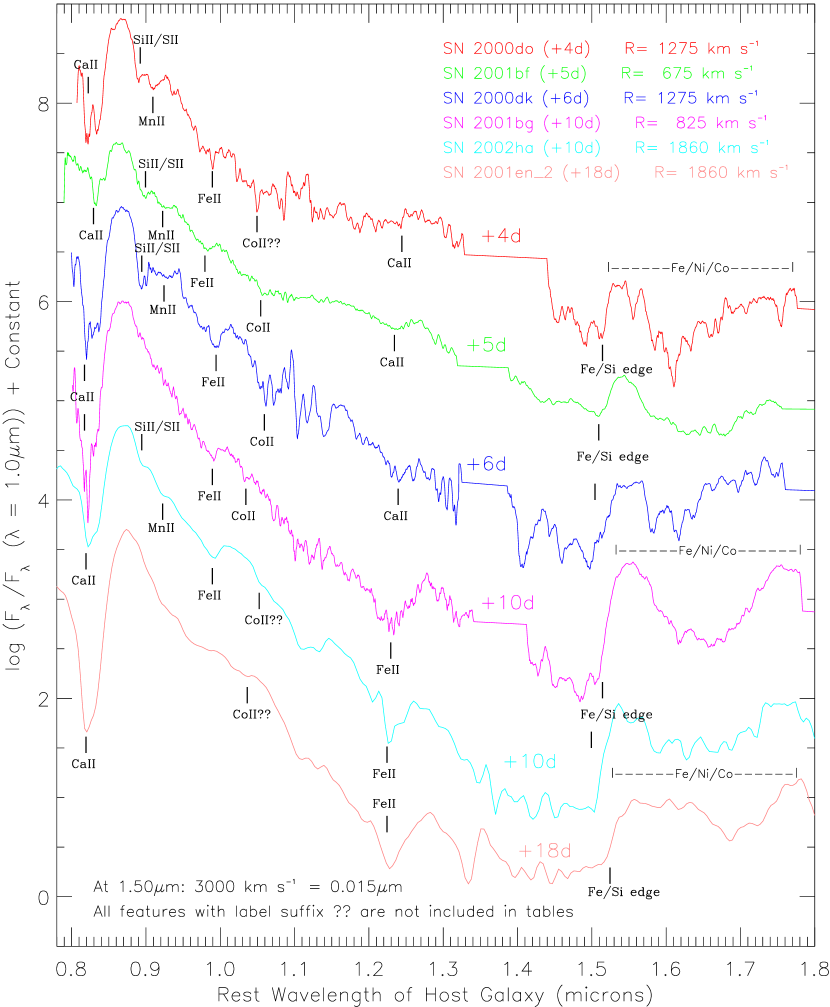
As discussed in Section 4 we have identified the important absorption lines and P-Cygni features in the spectra and measured the observed expansion velocities. The complete sample of thirteen spectra is found in Fig. 1. The spectra are divided into two groups for line identification and analysis. The first group displays features from the outer layers of the supernova before iron-group elements begin to dominate the spectra (Fig. 5). This group includes seven spectra obtained between -13 and +1 days of maximum light in the V-band (). The second group contains six spectra obtained between +4 and +18 days after . This group reveals the development of features resulting from line blanketing due to thousands of iron-group lines (Fig. 6).
At wavelengths between 1.31-1.38 and 1.78-1.88 m atmospheric transmission is nearly zero (%) which results in very low signal to noise ratios in these regions. We have removed these sections from the spectra obtained in cross dispersed mode. In addition, the spectra are particularly noisy at certain other wavelengths due to low atmospheric transmission (50-70%). These wavelengths are 0.93-0.96, 1.12-1.16 and 2.40-2.50 m in the observed frame (nearly zero transmission from 2.5-3.5 m). The locations of these regions in the rest frame of the host galaxy are dependent on the redshift corrections. For the spectra in our sample, the regions of increased noise correspond to wavelength bands from 0.90-0.94 m, 1.08-1.13 m, and red-ward of 2.35 m.
The spectra have been smoothed to reduce the noise in order to facilitate identification of the spectral features. The amount of smoothing required to achieve a useful spectrum varies widely depending on the quality of the data. In each case, we have attempted to balance the amount of smoothing against the benefits of maintaining resolution. The resolution for each spectrum after smoothing is displayed in km s-1 at the upper right and corner of the figures after the name of each supernova.
Type Ia spectra are characterized by the steadily diminishing flux at longer wavelengths. As a result, the S/N of the spectrum becomes worse at longer wavelengths because the level of the signal from the supernova is not as far above background noise levels. The spectrum from SN 2001dl is particularly noisy but is useful for presenting the overall energy distribution from a Type Ia event at that epoch. A few features can be identified near the blue end of such high noise spectra, but we are not able to define the position of any other features in these spectra with less uncertainty than the predicted line widths.
We examine the spectra beginning at shorter wavelengths and moving to longer wavelengths. Uncertainties in measuring the positions of features in the spectra depend on the noise and amount of smoothing, but typically range from 500-1400 km s-1. The measurement uncertainties are noted in Table 3.
5.1 Six spectra from thirteen days before to one day after maximum light
Seven NIR spectra from SNe Ia are presented in Fig. 5. The spectra were obtained at approximately -13, -6, -4, -3, -2, -1, and +1 days from maximum light. The wavelength region in Fig. 5 is reduced from that of the full spectrum in order to emphasize the region containing most of the features under discussion. References to the model in this section are discussed in more detail in Section 6.
The strong absorption feature found at 0.815-0.830 m is due to the Ca II “NIR triplet” (0.850, 0.854, 0.866 m). This feature has been observed previously in optical spectra with extended coverage to 0.9 m. The region from 0.801-0.893 m contains many Ca II lines that contribute to the broad P-Cygni shape of the feature. The blue side of the absorption feature includes contributions from Mn II and Co II, the strongest of which is Co II at 0.841 m, but the Ca II feature is more than 2000 times stronger. The red side of the feature is also influenced by Mn II and Co II with the strongest line Co II at 0.881 m. The expansion velocity of Ca II in this feature is difficult to determine because extensive blending obscures the location of the absorption minimum for the individual lines. Also, the lines from the Ca triplet are so strong that the wings of the emission component distort the absorption trough. Measured velocities for Ca II from this feature in this group of spectra are between 10,000 and 12,000 km s-1 with uncertainties km s-1. That is in agreement with the model predictions for the period before maximum light for Ca II expansion velocities of km s-1.
The Ca II lines in the NIR triplet are formed well above the photosphere and, even with solar abundance, a strong line is formed. Therefore, this feature is not a good tracer for the location of nuclear burning products Höflich et al. (1998).
The broad feature found in the spectra from 0.88-0.94 m is produced by the Mg II doublet (0.922, 0.924 m). At 2 or 3 days after , lines from Mn II (0.944 m) and Co II (0.955 m) contribute in this region and eventually dominate the Mg II. This behavior can be seen in the spectra from the second group in our sample (+4 to +18 days; Fig. 6). The blue edge of the Mg II feature is used to measure the Doppler velocity and we compare it with the 0.922 m line. We find expansion velocities from km s-1 for Mg II based on these measurements although the velocity from the earliest spectrum (SN 2002fk at -13 days) appears to be anomalously low. These velocities are consistent with standard models for SNe Ia Höflich & Khokhlov (1996). As discussed in § 6, Mg II is produced in the outer layers of the supernova by explosive carbon burning. Mg II is not expected to be observed later than 2 or 3 days after maximum light because expansion will reduce the column depth to the point where Mg II is not detectable. The region from 0.90-0.94 m is also one of the spectral regions with additional noise in the spectra due to increased atmospheric opacity.
Mg II is also detected near 1.04 m in these spectra. This feature is due to the Mg II triplet at 1.091, 1.092, 1.095 m. The detection of two Mg II features (0.922 doublet and 1.091 triplet) makes this a very confident identification. Soon after maximum light, there is a significant contribution on the red side of the Mg II triplet feature from Co II at 1.091 m since the Co II is produced closer to the center of the explosion and has a lower expansion velocity. At four days after maximum, the Co II line is dominant and the Mg II blended. This behavior can be seen in the spectra from the second group in our sample (+4 to +18 days; Fig. 6). The expansion velocities of Mg II are measured at the blue edge of the absorption minimum and compared to the 1.091 m component of the triplet. We measure expansion velocities from this feature to be 11,000-15,300 km s-1. That velocity range is consistent with the results from the Mg II doublet (0.922, 0.924 m) (see Table 3 and Fig. 7) as well as the predictions for DD modelss. Again, the velocity from the earliest spectrum (SN 2002fk at -13 days) appears to be anomalously low.
The broad P-Cygni feature with absorption minimum near 1.21 m is a Calcium feature that appears a few days before maximum light and is due to a blend of strong Ca II lines from 1.23-1.29 m. The strongest lines in this group are found at 1.243, 1.252, 1.268, and 1.283 m, but identification of a single line is not possible. We fit a curve to the spectrum in order to find the minimum of the feature and associate that minimum with the 1.268 m line. The uncertainties in this identification are estimated to be 900-1800 km s-1. The measured expansion velocities for this feature are 13,400 to 15,200 km s-1 which is above the model predictions for the period before maximum light of 10400-12300 km s-1. A few days after maximum light, the photosphere has receded well within the Ca-rich layers and the line becomes too weak to be observed.
The absorption minimum near 1.60 m is part of a P-Cygni like feature with an emission peak near 1.68 m. This feature is likely due to a blend of Si II (1.691 m) and Mg II (1.676 m and others) with the Si II dominant. We estimate the location of the absorption minimum by fitting a curve to the data. The spectra from SN 2000dn (-6d) and SN 2001dl (-3d) do not provide clear minima and are not included in the tables. This Si II identification is consistent with models that predict a feature to be present until a few days after maximum light, but it is not a definitive identification. After +5 or 6 days, line blanketing from thousands of Fe/Co/Ni lines creates pseudo emission features that peak near 1.50 and 1.77 m (See Figure 6). The notch between these two emission peaks occurs at approximately the same wavelength as the Mg/Si absorption minimum, but the features are not related.
Significant features are not predicted or observed in the early K-band (1.8-2.4 m) spectra of SNe Ia. There is slight evidence in some of the spectra near maximum light for broad absorption features near 2.05 and 2.25 m (See Figure 1). If real, these would be due to Co II with the strongest lines at 2.135, 2.221, 2.250, 2.361 and 2.460 m.
5.2 Seven Spectra from four to eighteen days after maximum light
The later spectra from our sample were obtained at approximately +4, +5, +6, +10, +10, and +18 days after (Fig. 6).
The Ca II triplet (0.850, 0.854, 0.866 m) is present in the large P-Cygni feature as it was in the earlier spectra. The measured expansion velocity for Ca II from this feature remains about 10,000 km s-1 although the photosphere has receded toward the center of the explosion and much slower explosion products have been revealed (see Table 3.) This is a consequence of the high cross section of the Ca II triplet which results in this feature being formed well within the Ca-rich envelope.
The absorption feature visible at 0.89 m in the two earliest spectra from this group is a blend of Si II and S II.
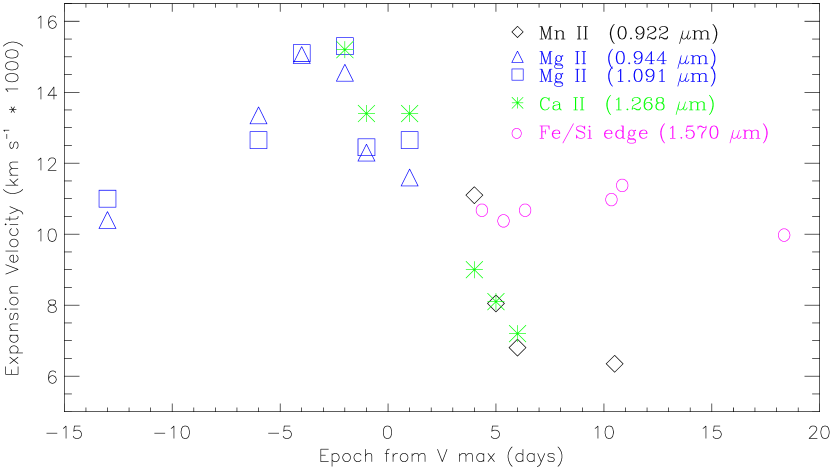
The feature near 0.91 m is attributed to a blend of Mn II lines from 0.931-0.955 m with the strongest the 0.944 m line. At 12 days past maximum, blended iron group lines dominate this region of the spectrum and Mn II is no longer detectable. The Mn II velocities clearly diminish with time and trace the movement of the photosphere through the ejecta (See Table 3 and Figure 7.)
The 0.91 m feature can clearly be seen in the spectra obtained from four to six days after maximum light and possibly also at +10 days. That is consistent with model predictions that the Mn II line will be weak or blended until 4 or 5 days after maximum light. However, since all line identifications are model dependent and we do not find a second Mn II feature to corroborate line strengths and velocities, we must consider the Mn II identification to be uncertain. The location of the Mn II feature is also near the m band of increased noise due to atmospheric opacity. Expansion velocities measured for Mn II are 11,100 km s-1 at +4 days and fall to 6,350 km s-1 at +10 days. The observed velocities for Mn II diminish with time as the photosphere recedes towards the center of the supernova (See Table 3).
Mn is important because it is a product of incomplete silicon burning during the detonation phase of the SNe Ia explosion. Mn II is a sensitive diagnostic of explosion dynamics because the production of Mn II changes by two orders of magnitude depending on burning temperature. This is in contrast to other products of partial silicon burning which display equal proportions throughout the range of temperatures (See Fig. 2 and Section 6).
The 0.99 m feature, which first becomes visible four days after maximum light and becomes more prominent through +12 days, is due to Fe II. A Co II feature from the 1.091 m line is apparent in the spectra from this group. The Ca II feature with absorption minimum near 1.21 m is visible up to about one week after maximum light. That is consistent with model predictions. The measured velocities for Ca II from this feature follow the reduction in photospheric velocity with time (See Table 3).
The four latest spectra in our sample, obtained +6, +10, +10, and +18 past maximum light, exhibit a reduced continuum level from m as compared with the earlier spectra. Fig. 1 clearly shows this effect. This change in slope is due to the region having fewer blends of iron group lines compared to adjacent wavelengths Wheeler et al. (1998). Note that the spectrum of SN 2001bf (+5d) does not exhibit any deficit in this region, even though the epoch is estimated to be only one day from that of SN 2000dk (+6d) (Fig. 6).
The emission peaks at 1.60, 1.75, 2.15, 2.25, and 2.35 m are the result of increased flux due to line blending from iron group elements. The radius of optical depth unity is increased at these wavelengths producing an increase in observed flux due to the greater effective area of radiation (Compare Fig. 6 and Fig. 4).
The abrupt edge on the blue side of the peak found near 1.55 m defines the transition from partial to complete Silicon burning. Due to the high optical depth, this feature is formed close to the outer edge of the Fe/Co/Ni core. The rest wavelength of this feature is m. The observed velocities are above 10,000 km s-1 for the spectra obtained from +4 to +10 days after maximum light and 9,800 km s-1 for the spectrum obtained at +18 days. This result is consistent with model predictions. Fig. 3 shows all silicon to be consumed below km s-1 for a model of a normal-bright Type Ia.
6 Constraints on Supernovae Models
6.1 Outer layers
Residual Carbon and He: There is no evidence in our spectra for C I at 0.93 or 1.13 m. That implies that basically all material in the WD has been burned. If C I were present, it should be observable Höflich et al. (2002). Fisher, et al. discuss possible identifications of C II at velocities 15,000 km s-1in spectra from SN 1990T and 25,000 km s-1 for SN 1990N Fisher et al. (1998). If these identifications are correct, Figure 2 may be used to show that the mass fraction above 15,000 km s-1 is less than 10% of the WD progenitor mass and for 26,000 km s-1, the mass of unburned material is 1% of the progenitor mass. Consequently, burning must have reached the outer layers.
We also do not see any indication for He I from the 2.058 m line. Combined with the detection of several Mg II lines, the lack of He supports the identification of the 1.05 m feature as Mg II rather than He I at 1.083 m.
Magnesium II Velocities: Mg is a product of explosive carbon burning without oxygen burning. Due to the higher burning temperatures during O burning, heavier elements are produced further along the alpha chain (Höflich 1997, Wheeler, et al. 1998). Mg II lines have been observed at 0.9 and 1.05 m from pre-maximum to a few days after maximum light as expected. After 5 or 6 days before maximum light, the continuum forming region will be well beneath the magnesium-rich region. Consequently, the Doppler shift of the absorption minimum will represent the inner edge of that region. We measure expansion velocities for Mg II between 12,450 and 15,300 km s-1.
Figure 2 can be used with the Mg II velocities to put limits on the amount of unburned matter after the explosion. Depending on the supernova, less than (SN 2002hw, SN 2000dm) or (SN 2000en, SN 2001br) remain outside of the region of carbon burning and could possibly be unburned. These values are upper limits because Mg II is present at higher velocities in the blue wings of the lines, meaning that even less material remains unburned. In principle, the limits on the mass of unburned material can be improved by measuring the blue wings of the Mg II features, but the S/N ratio in our data severely limits this approach. This result for the amount of unburned matter is consistent with the limits due to C I as discussed above.
6.2 Layers of Silicon Burning
Silicon continues to burn under conditions where both carbon and oxygen are completely consumed. The products of Si burning are intermediate mass elements at burning temperatures less than K. Above that temperature, Si is burned entirely to iron peak elements. In mass space, the region of of incomplete Si burning extends from 9,000 16,000 km s-1 (see Figure 3). The figure also shows that below 8,500 km s-1 Si is completely consumed.
Manganese Velocities: Mn is a product of incomplete silicon burning, but the quantity of Mn generated during the explosion depends sensitively on burning temperatures. The plot from the reference model of mass fraction of explosion products as a function of expansion velocity (Fig. 3) reveals silicon (depicted as the solid green line) at the top of the region from 9,000 16,000 km s-1 in the reference model. The figure also shows that this velocity region contains sulfur, argon, calcium, manganese and vanadium. Among the products of incomplete Si burning, Mn exhibits the strongest gradient in the quantity of product as a function of velocity. It is also produced in sufficient quantities to form detectable features. Since the velocity of the ejecta is proportional to the radius from the center of the explosion, manganese can also be used to measure the temperature of the burning because temperatures are hotter nearer to the core and more Mn is produced.
The observed velocity of Mn II recedes with the photospheric velocity from 11,000 km s-1at +4 days to 6,350 km s-1at +10 days (See Table 3). The Mn II feature is observed to become broader at later epochs. From the models, the increase in mass fraction for Mn II at the lower velocities (due to higher burning temperatures) is consistent with the broader absorption features.
Silicon to Nickel Transition: The short wavelength edge near 1.55 m is a good measure of the size of the Fe/Co/Ni core (Fig. 6). The spectra in our sample have transition velocities of km s-1. The Doppler shift is based on a rest value for the wavelength of this transition of 1.570 m. The velocity at the edge recedes slightly, but remains above 9,800 km s-1 at 18 days after maximum light at which time the photospheric velocity is down to about 3,000 km s-1. Pseudo emission features like this are due to line blanketing that increases the total opacity so that the features are formed at a larger radius than the photosphere. As a result of the increased effective area and high emissivity, the observed flux at these wavelengths is increased (See Section 4.1). Notice the notch at about 1.65-1.75 m which is well developed at +10 days in the spectrum of SN 2001bg (Fig. 6). As predicted (See Section 4.1), the notch should become partially filled as time advances. This effect can be seen in the spectral development between SN 2001bg (+10d) and SN 2001en (+18d). Note that the velocity of the partial to complete Si burning transition is very sensitive to the transition density parameter () in DD models Höflich (1995); Höflich & Khokhlov (1996); Höflich et al. (2002). Higher resolution spectra have the potential to constrain this important parameter.
7 Conclusions
We have studied a set of thirteen early time, near NIR-spectra (0.8 to 2.4 m) of “Branch-normal” Type Ia supernovae. The observations more than double the number of SNe Ia in the literature for which NIR spectra are available near maximum light. The spectra were obtained at the NASA Infrared Telescope Facility at resolutions between 250 and 1200 at an apparent brightness between +14 and +18 mag. NIR observations are critical because certain elements have no lines at optical wavelengths, are heavily blended in the optical region or are so strong that even solar metallicities produce highly saturated lines. The wide wavelength range of our sample allows testing of line identifications by the presence of lines of the same ion or element at other wavelengths. The low brightness limit of our program enabled us to guarantee appropriate targets for observations scheduled months in advance. We are unable to observe individual SNe Ia in a time sequence but the measurements in our sample are spread over a range of epochs. The calibration of the flux distribution has been tested based on both broad band filters and background subtraction using the data. The methods are consistent within . The quality of the spectra is sufficient to put strong constraints on models for SNe Ia.
As a reference, and to identify the spectral features, we have chosen a delayed detonation model for Branch-normal SNe Ia. The use of a particular model and explosion scenario does not a priori exclude other scenarios. Pure deflagration models and mergers are similar in the element production. However, edge-lit Helium detonation models show Ni and He at high velocities which should be observable, but are not found in the spectra from our sample. The various explosion scenarios and individual realizations due to variation in model parameters can be differentiated by the separation of spatial element distributions of several thousand km s-1. Consequently, the resolution of our spectra is sufficient to distinguish between models.
To analyze the expansion velocity of individual SNe Ia, we used the Doppler shifts of the absorption component. Based on the model, this approach yields an internal accuracy of about 5 to 7 % which is consistent with the resolution of the observations. The uncertainties from the measurements are dominated by the S/N ratio and are of the order of 1,000 to 1,500 km s-1.
All strong features in the spectra could be identified in the entire set of our observations. They are consistent with the reference model. If ordered as a time sequence, the expansion velocities recede with time as expected for the homogeneous group of Branch-normal SNe Ia. We find no correlation between the parameter and the expansion velocity of explosion products.
No evidence for the He I line at m was found. He is the characteristic feature for sub-Chandrasekhar mass WDs which are edge-lit by a He layer (Nomoto et al. 1980, Woosley & Weaver, 1994).
One of the main results is that the overall chemistry shows a radially layered structure for the matter which has undergone explosive carbon, incomplete and complete Si burning. In our reference model, the photospheric velocity is at km s-1 three days before maximum light and 9,500 km s-1 at five days after maximum. Based on the observations between -6 and +1 days, Mg II expansion velocities are between 12,000 and 15,000 km s-1. These values are consistent with values observed in 1994D (14,000 km s-1, Wheeler et al. 1998) and SN 2000el (18,000 km s-1, Rudy et al. 2002). (Note that our velocities are based on the measurement of two Mg II lines which increases the level of confidence in the results.) We conclude that the photosphere must be inside and well separated from the entire Mg II envelope. That means that we are observing the low velocity edge for Mg II in each supernova. Consequently, there is a well defined transition from layers that experienced explosive C burning which produces Mg II to layers with both C and O burning as predicted by the model (Fig. 3).
Similarly, the Fe II emission-feature at 1.5 to 1.9 m indicates a well-defined transition from incomplete Si burning to burning up to NSE at km s-1. This result is consistent with optical spectra which typically give lower limits for the Si II velocity km s-1(Barbon et al. 1990).
The presence of Mg II in the NIR provides a limit for the amount of unburned material in the outer layers of . This is an upper limit because if Mg is present further out, then the amount of unburned material will be even less. The use of the blue edge of the Mg II may provide better limits, but the S/N in our data does not allow measurement of the extension in the line wing.
In addition, we do not see evidence for large scale mixing. Iron peak elements are not observed at high velocities and intermediate mass elements are not observed at low velocities. No unburned carbon is found in our data.
Distinct chemical layering, as suggested by our observations, is a signature of a detonation. Combined with the lack of carbon, our results strongly favor the presence of a detonation phase during the explosion. As discussed in the introduction, deflagration fronts seem to produce structures that are dominated by large scale mixing. They include unburned or partially burned material close to the center. Current 2-D Livne (1993); Lisewski et al. (2000); Reinecke et al. (1999) and 3D calculations Khokhlov (1995, 2001) of pure deflagration models show that remain unburned. The existence of a layered structure and the limit of a very small amount of unburned matter are inconsistent with a pure deflagration and suggest the presence of a detonation.
For merger scenarios, we expect the burning front to propagate as a detonation (Benz et al. 1992, Khokhlov et al. 1994, Höflich & Khokhlov 1996). That would produce a layered chemical structure, but a significant amount of unburned, C/O rich, matter is predicted to remain in the outer layers and should be observed during the early times (Khokhlov et al. 1994, Höflich & Khokhlov 1996, Höflich et al. 2002). Again, the lack of C I in our seven earliest spectra is inconsistent with merger models.
Overall, the supernovae in our sample are rather homogeneous; however, measured expansion velocities show variations between SNe at a given epoch of a few thousand km s-1 (see Figure 3 and Table 3). This clearly points towards variations among the group of Branch-normal SNe Ia. We find no correlation between expansion velocity and the decline rate parameter, . Since NIR lines contain independent information, the properties of NIR lines may be used to get a handle on the variety in the observations and to provide the refinements needed to improve the accuracy of relative distances determined by SNe Ia beyond the level of the brightness decline relation. Given the lack of calibrated LCs, a detailed evaluation is beyond the scope of this paper.
The possible identification of a Mn II line at 0.94 m in the spectra obtained after +3 days post maximum is an important result. This identification is consistent with the theoretical model prediction both with respect to the time it appears and the Doppler shifts. Mn II promises to be a valuable diagnostic as more measurements are obtained. It is a unique probe of the region of incomplete silicon burning due to the gradient of Mn II production through this region while the level of other burning products remains nearly constant.
In conclusion, the results of our analysis are consistent with delayed detonation (DD) models of SNe Ia. The data strongly favor models where the entire progenitor, including the outermost layers, undergo burning and that there is no strong mixing of the chemical layers.
Finally, we mention the limitations of this work which should be seen as a step toward further and more detailed studies. Detailed optical spectra and calibrated light curves were not available for this study. Consequently, we are unable to test whether or not it is possible to explain or compensate for the variations in our sample using variations in peak brightness. For most of the objects, corresponding data have been obtained elsewhere and will be available at a later time. After testing maximum brightness data, the variations will be analyzed using changes in the model parameters that define the progenitor WD, such as central density, mass on the main sequence and metallicity.
Although our measurements represent a significant increase of the number of the available NIR spectra, we are still dealing with small number statistics. Better statistics are needed to understand the variations within our sample. Moreover, merging WD are apparently not found in our sample, but this class of objects may contribute to the SNe Ia population in a significant number. Higher signal to noise ratios are needed to accurately measure the extension of the blue wings of Mg II to improve the limits on the unburned, outer layers, and to increase the accuracy of velocity measurements. Higher S/N would provide tighter limits on the possible mixing of different elements, and detailed fits to individual observations should be performed, including detailed 3-D models.
Acknowledgments:
We thank W. D. Li and M. Papenkova for providing light curve data for many of the SNe in our sample. We thank the individuals at the IRTF for guidance and help with the observations. In particular, Alan Tokanaga, Bobby Bus, John Rayner, Mike Cushing, Karen Hughes, Tony Denault, Bill Golisch, Dave Griep, and Paul Sears have been most helpful. We would also like to thank the TAC of the IRTF for support and instructive comments. GHM would like to thank Dan Jaffe and Weidong Li for support and helpful comments. This research has made use of the NASA/IPAC Extragalactic Database (NED) which is operated by the Jet Propulsion Laboratory, California Institute of Technology, under contract with the National Aeronautics and Space Administration. This research is supported in part by NSF grant 0098644 and by NASA grant NAG5-7937.
Appendix A The Supernovae (in order of discovery)
Observational details are compiled in Table 1 and Table 2. Additional information on the techniques used to establish the epoch of observation and are found in § 3. We attempt to establish the date and apparent maximum brightness in the V-band for each SNe in our sample. Where we have good B-band data, the date of is taken to be the date of days. The values are measured directly from the photometric data and are not calculated by fitting to template light curves.
A.1 SN 2000dk
SN 2000dk is the only event in our sample to be hosted by an elliptical galaxy. The SN was discovered in NGC 382 on Sept. 18, 2000 Beckmann & Li (2000). The recession velocity for this galaxy is 5228 km s-1. At discovery, the V-band magnitude of the object was 16.0. A spectrum taken Sept. 20 (JD 2451808) by the CfA group Jha et al. 2000a , established SN 2000dk as a Type Ia and estimated the epoch to be d which corresponds to a maximum light date of d. Photometry from the CfA group indicates a date of 2451812.5 Jha et al. (2002). A relative B-band light curve for SN 2000dk finds d. AUDE suggests that the maximum light was d at . The VSnet light curve suggests a maximum light date was d at .
We estimate for SN 2000dk that maximum V light occurred JD d, at apparent . The decline parameter mag.
A.2 SN 2000dm
SN 2000dm was discovered in the spiral (Sab) galaxy UGC 11198 on Sept. 24, 2000 by Aazami and Li Aazami_7495 (2000) at . The recession velocity for this galaxy is 4507 km s-1. The supernova type was determined by the CfA group from a spectrum obtained Sept. 25.1 (JD 2451812.5) Jha et al. 2000b . The estimated epoch of d, corresponds to a maximum light date of 2451813.5. In the same circular, Fillipenko and Chornock Filippenko_7497b (2000) confirm the supernova type and define the epoch as very close to maximum brightness. The relative B-band light curve for SN 2000dm indicates that occurred between JD 2451815.6 and 2451817.6. The VSnet light curve shows SN 2000dm becoming brighter up to Sept. 30.8 (JD 2451817.6) at , but there is a subsequent gap in the data until Oct. 08 at . The AUDE data reveal increasing brightness up to JD 2451817.3 at .
We estimate for SN 2000dm that maximum V light occurred JD d, at apparent . The decline parameter mag.
A.3 SN 2000dn
SN 2000dn is the most distant SN in our sample with a recession velocity for the host galaxy of 9613 km s-1. It was discovered in the spiral ((R’)SAB0+ pec) galaxy IC 1468 on Sept. 27, 2000 Yu & Li (2000) at . A CfA spectrum obtained Sept. 29.3 (JD 2451816.8) Jha et al. 2000c established the type and estimated the epoch to be d, corresponding to a maximum light date of JD 2451819.8. The VSnet light curve agrees with a maximum light date of JD 2451820 at . A relative B-band light curve for SN 2000dn indicates that d.
We estimate for SN 2000dn that maximum V light occurred JD d, at apparent . The decline parameter mag.
A.4 SN 2000do
SN 2000do was discovered in the spiral (Sc) galaxy NGC 6754 on Sept. 30, 2000 White (2000). The recession velocity for this galaxy is 3257 km s-1. At discovery . Suntzeff Suntzeff_7500b (2000) established the type from a spectrum obtained Sept. 30 and estimated the epoch to be a few days after maximum. Unfiltered magnitude estimates by Bembrick Bembric_7509 (2000) show the object becoming dimmer beginning at on Sept. 30 (JD 2451818.5). The maximum light date must therefore precede discovery. There are no light curves available for this object.
We estimate for SN 2000do that maximum V light occurred JD d, at apparent .
A.5 SN 2001bf
The unclassified galaxy MCG +04-42-022 was host to SN 2001bf which was discovered on May 3, 2001 Hurst 2001a at . The recession velocity for the host is 4647 km s-1. The supernova type was determined by the GAO group from a spectrum obtained May 11 (JD 2452040.8) Kawakita & Kinugasa 2001b . The epoch is estimated to be shortly before maximum light. Unfiltered magnitude estimates by West West (2001) show the object becoming brighter from May 7 to May 8 and reaching on May 14.4 (JD 2452043.9). Although Phillips and Krisciunas tentatively identified SN 2001bf as a Type Ic Phillips_7636 (2001), Chornock, Fillippenko and Li Chornoc_7701 (2001) confidently reconfirmed the original designation of the object as a Type Ia. Their spectrum, obtained May 17 (JD 2452046.8), affirms the supernova type and the epoch is estimated to be near maximum light. VSnet data suggest a maximum light date of JD at . The AUDE data provide JD as the maximum light date at . A relative B-band light curve for SN 2001bf gives d. Given that the measurement corresponds to and the scatter in the amateur data favor a small reduction in maximum brightness for SN 2001bf, we estimate .
We estimate for SN 2001bf that maximum V light occurred JD d, at apparent . The decline parameter mag.
A.6 SN 2001bg
SN 2001bg was discovered at in the spiral (SBb/Sc) galaxy NGC 2608 on May 8, 2001 Hurst 2001b . With a recession velocity for the host of 2135 km s-1NED this is the closest SN in our sample. Separate determinations of the supernova type were made by the Tel Aviv University group Gal-Yam & Shemmer (2001) and GAO group Kawakita & Kinugasa 2001a from spectra obtained May 10 (JD 2452040). The epoch is estimated to be near or shortly before maximum light. A CfA spectrum obtained May 15 (JD 2452045) Matheson et al. 2001a confirms SN 2001bg to be a Type Ia supernova and the epoch is estimated to be days after maximum light corresponding to a maximum light date of JD 2452040. CCD R-band photometry by Horoch Hornoch_7639 (2001) provides a maximum light date of JD 2452041. The relative B-band light curve for SN 2001bg finds d. The VSnet data suggest a maximum light date of JD at . AUDE data imply a JD maximum light date at .
We estimate for SN 2001bg that maximum V light occurred JD d, at apparent . The decline parameter mag.
A.7 SN 2001br
The host for SN 2001br is the spiral (SBa) galaxy UGC 11260. The SN was discovered on May 13, 2001 Hurst 2001c at . The recession velocity for this galaxy is 6184 km s-1. The discovery announcement also reported the object to be brightening from on May 13 to on May 21 (JD 2452051). The supernova type was established by the CfA group from a spectrum obtained May 21 (JD 2452051) Matheson et al. 2001b . The epoch was estimated to be d, corresponding to a maximum light date of JD 2452052. No amateur data is recorded for this SN. The relative B-band light curve for SN 2001br finds d.
We estimate for SN 2001br that maximum V light occurred JD d, at apparent . The decline parameter mag.
A.8 SN 2001dl
SN 2001dl was discovered in the spiral (Sc/I) galaxy UGC 11725 on July 30, 2001 Yu & Li (2001). The recession velocity for this galaxy is 6204 km s-1. At discovery . A spectrum obtained August 8 (JD 2452130) Patat et al. (2001) determined the supernova type and the epoch was estimated to be at maximum light. The VSnet data suggest a maximum light date of August 7 (JD d) at . AUDE data imply a Aug. 7 JD maximum light date at . A relative B-band light curve for SN 2001dl indicates that d.
We estimate for SN 2001dl that maximum V light occurred JD d, at apparent . The decline parameter mag.
A.9 SN 2001en
SN 2001en was discovered in the peculiar, triple cored galaxy NGC 523 at on Sept. 26, 2001 by Hutchings and Li Hutching_7724 (2001) and also on Sept. 27 by Zhou and Li Zhou_7725 (2001). The recession velocity for the host galaxy is 4758 km s-1. The supernova type was established from a NIR spectrum obtained Oct. 8 by Marion et al. (2001). They estimated the epoch to be near maximum light. The type was confirmed by an optical spectrum obtained Oct. 11 (JD 2452194) by Matheson et al. (2001c). That group estimated the epoch to be at maximum light . A V-band light curve by The Lick Observatory and Tenegra Observatory Supernova Searches LOTOSS (2001) suggests a maximum light date of JD at . The maximum light date from the VSnet data is JD at . The AUDE data suggest JD for the maximum light date at . A relative B-band light curve for SN 2001dl finds d.
We estimate for SN 2001en that maximum V light occurred JD d, at apparent . The decline parameter mag.
A.10 SN 2002fk
SN 2002fk was discovered in the spiral galaxy (SA(s)bc) NGC 1309 at on Sept. 17.7, 2002 by R. Kushida kushida_7973 (2002) and also by J. Wang and Y. L. Qiu wang_7973 (2002). The recession velocity for the host galaxy is 2135 km s-1. The supernova type was established by an optical spectrum obtained Sept. 20 (JD 2452538) K. Ayani and H. Yamaoka (2002). The epoch was estimated to be before maximum light. The maximum light date from the VSnet data is JD at . A relative B-band light curve for SN 2002fk finds d.
We estimate for SN 2002fk that maximum V light occurred JD d, at apparent . The decline parameter mag.
A.11 SN 2002ha
SN 2002ha was discovered in the spiral galaxy (SAB(r)ab) NGC 6962 at on Oct. 21.2, 2002 by Graham, Panankova and Li graham_7997 (2002). The recession velocity for the host galaxy is 4211 km s-1. The supernova type was established by an optical spectrum obtained Oct. 25.0 (JD 2452572.5) M. Hamuy (2002). The epoch was estimated to be three days before maximum light. The maximum light date from the VSnet data is JD at . The AUDE data suggest JD for the maximum light date at .
We estimate for SN 2002ha that maximum V light occurred JD d, at apparent .
A.12 SN 2002hw
SN 2002hw was discovered in the spiral galaxy (SAc) UGC 52 at on Nov. 9.2, 2002 by Schwartz and Li schwartz_8014 (2002). The recession velocity for the host galaxy is 5257 km s-1. The supernova type was established by an optical spectrum obtained Nov. 11.0 (JD 2452589.5) by three teams cited in IAUC 8015 (Hamuy 2002, Filippenko & Chornock 2002, Matheson, Challis and Kirshner 2002). The epoch was estimated by Hamuy and Filipenko and Chornock to be near maximum light. Matheson, Challis and Kirshner estimated the epoch as before maximum and suggested that the slope of the continuum indicated significant extinction due to dust. The maximum light date from both the VSnet and AUDE data is between JD 2452590 and 2452605 at .
We estimate for SN 2002hw that maximum V light occurred JD d, at apparent .
References
- (1) Aazami, A. B. and Li, W. D. 2000, IAU Circ. 7495
- Arnett & Livne (1994) Arnett D., Livne E. 1994, ApJ 427, 330
- K. Ayani and H. Yamaoka (2002) Ayani, K. and Yamaoka, Y. 2002, IAU Circ. 7976
- (4) AUDE, Association des Utilisateurs de Détecteurs Electroniques, Supernova Webpages, 2000, 2001, http://www.astrosurf.com/snweb/
- Barbon et al. (1990) Barbon R., Benetti S., Cappellaro E., Rosino L., Turatto M. 1990, A&A 237, 79
- Beckmann & Li (2000) Beckmann, S. and Li, W. D. 2000, IAU Circ. 7493
- (7) Bembrick, C. 2000, IAU Circ. 7509
- Benz et al. (1990) Benz, W. Cameron, A. G. W., Press, W. H., Bowers, R. L. 1990, ApJ, 348, 647
-
(9)
Bishop, D., The Latest Supernova Page
http://www.supernovae.net/snimages/ - Bowers et al. (1997) Bowers, E. J. C., et al. 1997, MNRAS, 290, 663
-
(11)
CfA, 2000, 2001, Supernovae Webpage
http://cfa-www.harvard.edu/cfa/oir/Research/supernova/RecentSN.html - (12) Chornock, R., Fillippenko A. V., and Li, W. D., 2001, IAU Circ. 7701
- Spextool v. 2.1; Cushing Vacca & Rayner (2002) Cushing, M. C., Vacca, W. D. and Rayner, J. T. 2003, PASP, (in prep.)
- Domínguez Höflich & Straniero (2001) Domínguez, I., Höflich, P., & Straniero, O. 2001, ApJ557, 126
- (15) Filippenko, A. V. and Chornock, R. 2000, IAU Circ. 7497
- A. Filippenko and R. Chornock (2002) Filippenko, A. V. and Chornock, R. 2002, IAU Circ. 8015
- Domínguez & Höflich (2000) Domínguez, I., & IHöflich, P. 2000, ApJ, 528, 854
- Fisher et al. (1998) Fisher, A., Branch, D., Höflich, P., Khokhlov, A. 1998, ApJ, 494, 47
- Gal-Yam & Shemmer (2001) Gal-Yam, A., and Shemmer, O. 2001, IAU Circ. 7622
- Garcia-Senz & Woosley (1995) Garcia-Senz D. Woosley S.E. 1995 ApJ 454, 895
- (21) Graham, J., Papenkova, M. and Li, W. 2002, IAU Circ. 7997
- Hamuy et al. (1996) Hamuy M., Phillips M.M., Suntzeff N.B., Schommer R.A., Maza J., Aviles A. 1996, AJ 112, 2398
- (23) Hamuy, M., et al. 2002, AJ accepted, astro-ph/0203491
- M. Hamuy (2002) Hamuy, M. 2002, IAU Circ. 7999
- M. Hamuy (2002) Hamuy, M. 2002, IAU Circ. 8015
- (26) Hamuy, M., et al. 2002, AJ accepted, astro-ph/0203491
- Hernandez et al. (2000) Hernandez, M., et al. 2000, MNRAS, 319, 223
- Höflich (1995) Höflich, P. 1995, ApJ, 443, 89H
- Höflich & Khokhlov (1996) Höflich, P. and Khokhlov, A 1996, ApJ, 457, 500
- (30) Höflich, P., Dominik, C., Khokhlov, A., Müller, E., & Wheeler, J. C. 1996b, Texas Symposium on relativistic Astrophysics, Annals of the New York Academy of Science, 759, 348
- Höflich et al. (1998) Höflich, P., Wheeler J.C., Thielemann F.K 1998, ApJ, 495, 617
- Höflich et al. (2002) Höflich P., Gerardy C., Fesen R., Sakai S. 2002, ApJ, 568, 791
- Höflich & Stein (2002) Höflich P., Stein J. 2002, ApJ 568, 779
- Höflich (2002) Höflich P. 2002, in: Stellar Atmospheric Modeling, eds. Hubeny, D. Mihalas & K. Werner, ASP Conference Series, in press & astro-ph/0207103
- Höflich et al. (2003) Höflich P., Gerardy C., Linder E., Marion H. 2003, in: Stellar Distance Indicators’, eds. Gieren et al., Springer Press, in press & astro-ph 0301334
- (36) Hornoch, K. 2001, IAU Circ. 7639
- Hoyle & Fowler (1960) Hoyle, P., & Fowler, W.A. 1960, ApJ, I132, 565
- (38) Hurst, G. M. 2001a, IAU Circ. 7620
- (39) Hurst, G. M. 2001b, IAU Circ. 7621
- (40) Hurst, G. M. 2001c, IAU Circ. 7629
- (41) Hutchings D. and Li, W. D. 2001, IAU Circ. 7724
- Iben & Tutukov (1984) Iben Jr, I. & Tutukov, A.V. 1984, IApJS, 54, 335
- Jha et al. (1999) Jha, S., et al. 1999, ApJS, 125, 73
- (44) Jha, S., Challis, P., Matheson, T. and Kirshner, R. 2000a, IAU Circ. 7494
- (45) Jha, S., Challis, P., Matheson, T. and Kirshner, R. 2000b, IAU Circ. 7497
- (46) Jha, S., Challis, P., Matheson, T. and Kirshner, R. 2000c, IAU Circ. 7499
- Jha et al. (2002) Jha, S., et al. 2002, in preparation
- (48) KAIT, The Katzman Automatic Imaging Telescope, 2000, 2001, 2002 http://astron.berkeley.edu/ bait/kait.html
- (49) Kawakita H. and Kinugasa, K. 2001a, IAU Circ. 7622
- (50) Kawakita H. and Kinugasa, K. 2001b, IAU Circ. 7625
- Khokhlov (1991) Khokhlov, A. 1991, ApJ, 245, 114
- Khokhlov (1995) Khokhlov, A. 1995, ApJ, 449, 695
- Khokhlov (2001) Khokhlov, A. 2001, ApJ, in press & (astro-ph/0008463)
- (54) Kushida, R. 2002, IAU Circ. 7973
- Lentz et al. (2001) Lentz, E. J., Baron, E., Branch, D., Hausschildt, P. 2001, ApJ, 557, 2001
- Livne (1993) Livne E. 1993, ApJ 406, 17L
- Lisewski et al. (2000) Lisewski, A. M.; Hillebrandt, W.; Woosley, S. E.; Niemeyer, J. C.; Kerstein, A. R. 2000, ApJ 537, 405L
-
LOTOSS (2001)
LOTOSS, The Lick Observatory and Tenegra
Observatory Supernova Searchs, 2001
http://cfa-www.harvard.edu/cfa/oir/Research/supernova/images/alex3.gif - Marion et al. (2001) Marion, G. H., Hoeflich, P., Wheeler, J. C., and Vacca, W. D. 2001, IAU Circ. 7732
- (60) Matheson, T., Jha, S., Challis,P. and Kirshner, R. 2001a, IAU Circ. 7626
- (61) Matheson, T., Jha, S., Challis, P. and Kirshner, R. 2001b, IAU Circ. 7629
- (62) Matheson, T., Jha, S., Challis, P. and Kirshner, R. 2001c, IAU Circ. 7732
- Matheson Challis and Kirshner (2002) Matheson, T., Challis, P. and Kirshner, R. 2002, IAU Circ. 8015
- Meikle et al. (1996) Meikle, W. P. S., et al. 1996 MNRAS, 281, 263
- Müller & Höflich (1994) Müller E. & Höflich P. 1994, A&A, 281, 51
-
(66)
NED, NASA/IPAC Extragalactic Database
http://nedwww.ipac.caltech.edu/index.html - Nomoto (1982) Nomoto, K. 1982, ApJ, 253, 798
- Nomoto et al. (1984) Nomoto, K., Thielemann, F. -K., & Yokoi, K. 1984, ApJ, 286, 644
- Nugent et al. (1995) Nugent, P., Branch, D., Baron, E., Fisher, A., Vaughan, T., Hauschildt, P. H. 1995, Phys.Rev.Let 75, 394
- Nugent et al. (1997) Nugent, P., Baron, E., Hauschildt, P., & Branch., D. 1997, ApJ 485, 812
- Paczyński (1985) Paczyński, B. 1985, in: Cataclysmic Variables and Low-Mass X-Ray BinaRiess, eds. D.Q. Lamb, J. Patterson, I. Reidel, Dordrecht, p.1
- Patat et al. (2001) Patat, F., Contreras, C., Prieto, J., Altavilla, G., Benetti, S., Cappellaro, E., Pastorello A. and Turatto, M. 2001, IAU Circ. 7680
- (73) Phillips, M. and Krisciunas, K. 2001, IAU Circ. 7636
- Perlmutter et al. (1999) Perlmutter, S. et al. 1999, ApJ, 517, 565
- Phillips et al. (1999) Phillips, M.M., Lira P., Sunzeff N.B., Schommer R.A., Hamuy M., Maza J. 1999, AJ 118, 1766
- Rayner et al. (1998) Rayner. J. T., Toomey, D. W., Onaka, P. M., Denault, A. J., Stahlberger, W. E., Watanabe, D. Y. and Wang S.-I. 1998, Infrared Astronomical Instrumentation, ed. A. M. Fowler, Proc. SPIE, 3354, 468-479
- Rayner et al. (2002) Rayner, J. T., Toomey, D. W., Onaka, P. M., Denault, A. J., Stahlberger, W. E., Vacca, W. D. and Cushing, M. C. 2003, PASP in press
- Reinecke et al. (1999) Reinecke M., Hillebrandt W., Niemeyer J., Klein R., Gröbl A. 1999, A&A 347, 724
- Ries et al. (1995) Riess A.G., Press W.H., Kirshner R.P. 1995, ApJ438, L17
- (80) Riess A.G., et al. 1998a, AJ116, 1009
- (81) Riess A.G., Nugent P., Filippenko A.V., Kirshner R.P., Dekel A. 1998b, ApJ504, 935
- Rudy et al. (2001) Rudy R.J., Lynch D.K., Mazuk S., Venturini C.C., Puetter R.C., Höflich P. 2002, ApJ 565, 413
- (83) Schlegel, D. J. Finkbeiner, D. P., Davis, M. 1998, ApJ, 500, 525
- (84) Suntzeff, N. B. 2000, IAU Circ. 7500
- (85) Schwartz, M., and Li, W. 2002, IAU Circ. 8014
- Umeda et al. (2000) Umeda, H., Nomoto, K. 2000, ApJ513, 861
-
(87)
VSnet, The Variable Star
Network, Supernova Webpages, 2000, 2001
http://www.kusastro.kyoto-u.ac.jp/vsnet/SNe.html - (88) Vacca, W.D., Cushing, M. C., & Rayner, J. T. 2003. PASP, in press
- (89) Wang, J. and Qiu, Y. L. 2002, IAU Circ. 77973
- Webbink (1984) Webbink, R. F. 1984, ApJ, 277, 355
- Weller & Albrecht (2001) Weller J., Albrecht A. 2001, Opportunities for future supernova studies of cosmic acceleration, astro-ph/0008314
- West (2001) West, J. D. 2001, IAU Circ. 7625
- Whelan & Iben (1973) Whelan, J., & Iben Jr., I. 1973, ApJ, I186, 1007
- White (2000) White, B. 2000, IAU Circ. 7500
- Wheeler et al. (1998) Wheeler, J. C., Höflich, P., Harkness, R. P., Spyromilio, J. 1998, ApJ, 496, 908
- Woosley & Weaver (1994) Woosley, S. E., & Weaver, T. A. 1994, ApJ, 423, 371
- (97) Yamaoka, H., Nomoto, K., Shigeyama, T., & Thielemann, F. 1992, ApJ, 393, 55
- Yu & Li (2000) Yu, C. and Li, W. D. 2000, IAU Circ. 7498
- Yu & Li (2001) Yu, C. and Li, W. D. 2001, IAU Circ. 7675
- (100) Zhou, W. and Li, W. 2001, IAU Circ. 7725
| SN | Obs. Date | JD | Max. LightaaData for supplied by Weidong Li, University of California at Berkeley (private communication). | Epoch (V)bbEpoch of observation in days from maximum light in V-band. ( is taken to be 2 days after .) | Est. ccEstimated magnitude of target in V-band at time of observation. | Exp. TimeddTotal integration time on target. | Inst. Res. | S/NeeSignal to noise ratio of combined spectrum before smoothing. |
|---|---|---|---|---|---|---|---|---|
| (UT) | (2450000+) | (2450000+) | (days) | (mag) | (mins.) | () | ||
| 2000dk | Oct. 2.5 | 1820.0 | 16.0 | 50 | 1200 | 16 | ||
| 2000dm | Oct. 1.3 | 1818.8 | 16.1 | 50 | 750 | 21 | ||
| 2000dn | Oct. 2.4 | 1819.9 | 17.9 | 25 | 250 | 32ffSpectrum obtained in Low Resolution (single prism) mode. | ||
| 2000do | Oct. 2.2 | 1819.7 | 15.6 | 25 | 750 | 11 | ||
| 2001bf | May 22.4 | 2050.9 | 16.0 | 150 | 750 | 34 | ||
| 2001bg | May 23.3 | 2052.8 | 14.0 | 50 | 1200 | 18 | ||
| 2001br | May 23.7 | 2053.1 | 16.6 | 100 | 750 | 16 | ||
| 2001dl | Aug. 12.4 | 2129.9 | 17.4 | 25 | 750 | 6 | ||
| 2001en_1 | Oct. 8.3 | 2190.8 | 14.5 | 50 | 1200 | 14 | ||
| 2001en_2 | Oct. 30.3 | 2212.8 | 17.2 | 50 | 250 | 36ffSpectrum obtained in Low Resolution (single prism) mode. | ||
| 2002fk | Sept. 19.5 | 2537.0 | 14.0 | 125 | 1200 | 36 | ||
| 2002ha | Nov. 14.3 | 2592.7 | 15.5 | 25 | 250 | 36ffSpectrum obtained in Low Resolution (single prism) mode. | ||
| 2002hw | Nov. 14.5 | 2592.9 | 16.3 | 100 | 750 | 24 |
Note. — Details and references for these data may be found in Appendix A.
| SN | Date | EpochaaEpoch of observation in days from maximum light in V-band. | Host | bbData from the NASA/IPAC Extragalactic Database. | E(B-V)bbData from the NASA/IPAC Extragalactic Database. ccGalatic extinction. | obs. | ddUsing , . | |
|---|---|---|---|---|---|---|---|---|
| 2000dk | Oct. 2.5 | NGC 382 | 5228 | 0.070 | 15.2 | |||
| 2000dm | Oct. 1.3 | UGC 11198 | 4507 | 0.186 | 15.1 | |||
| 2000dn | Oct. 2.4 | IC 1468 | 9613 | 0.046 | 17.0 | |||
| 2000do | Oct. 2.2 | NGC 6754 | 3257 | 0.070 | 14.6 | |||
| 2001bf | May 22.4 | MGC +04-42-022 | 4647 | 0.098 | 14.8 | |||
| 2001bg | May 23.3 | NGC 2608 | 2135 | 0.039 | 13.7 | |||
| 2001br | May 23.7 | UGC 11260 | 6184 | 0.064 | 16.0 | |||
| 2001dl | Aug. 12.4 | UGC 11725 | 6204 | 0.053 | 16.0 | |||
| 2001en_1 | Oct. 8.3 | NGC 523 | 4758 | 0.054 | 15.0 | |||
| 2001en_2 | Oct. 30.3 | NGC 523 | 4758 | 0.054 | 15.0 | -19.5 | ||
| 2002fk | Sept. 19.5 | NGC 1309 | 2135 | 0.040 | 13.2 | -19.5 | ||
| 2002ha | Nov. 14.3 | NGC 6962 | 4211 | 0.098 | 14.7 | -19.6 | ||
| 2002hw | Nov. 14.5 | UGC 52 | 5257 | 0.111 | 16.2 | -18.7eeMatheson, Challis & Kirshner report probable extinction due to dust (2002, IAUC 8015) |
| SN | EpochaaEpoch of observation in days from maximum light in V-band. | Ca II | Mn IIccThe Maganese detection is suggestive but not definitive. | Mg II | Mg II | Fe II-edge | Si II | |
|---|---|---|---|---|---|---|---|---|
| (days) | (1.268 m)bbVacuum wavelength. | (0.944 m)bbVacuum wavelength. | (0.922 m)bbVacuum wavelength. | (1.091 m)bbVacuum wavelength. | ( m)bbVacuum wavelength. | (1.691 m)bbVacuum wavelength. | ||
| 2002fk | ||||||||
| 2000dn | ||||||||
| 2000en_1 | ||||||||
| 2001dl | ||||||||
| 2001br | ||||||||
| 2002hw | ||||||||
| 2000dm | ||||||||
| 2000do | ||||||||
| 2001bf | ||||||||
| 2000dk | ||||||||
| 2001bg | ||||||||
| 2002ha | ||||||||
| 2001en_2 |
Figure Captions:
Fig. 1: Near infrared spectra of Type Ia supernovae obtained at the IRTF. The ordinate is log flux and the spectra have been shifted by a constant. The abscissa is wavelength in microns. The spectra are labeled with the epoch (in days) relative to maximum light (in V) with the earliest spectrum at the top. The resolution for each spectrum after smoothing is given in the top right corner. Labels for each SN are have the same order and color as the spectra.
Fig. 2: Velocity (solid) and density (dotted) as a function of mass (in ) for the delayed detonation model used as reference (5p028z22.25; from Höflich et al. 2002).
Fig.3: Abundances of stable isotopes as a function of expansion velocity for our reference model (see Fig. 2). The ordinate is log of the mass fraction. The curves with the highest abundance found close to the center of the supernova ( km s-1) correspond to 54Fe, 58Ni, and 56Fe.
Fig. 4: Evolution of NIR synthetic spectra from the reference model at three epochs: maximum light in B, at one week, and at two weeks later. The fluxes are normalized at , and the spectra are shifted by 2 and 4 units at +1 and +2 weeks, respectively. As reference, the V light curve and the evolution of B-V are given in the right panels.
Fig. 5: Log plot of seven spectra from pre-maximum to +1 day (see Section 5.1). The ordinate is log flux and the spectra have been shifted by a constant. The abscissa is wavelength in microns. Each spectrum is labeled with the epoch (in days) relative to maximum light in V. Only wavelengths from 0.80-1.80 m are displayed to facilitate the identification of features in this region. The resolution for each spectrum after smoothing is noted in the top of the figure. Labels for each SN are in the same order and color as the spectra. Complete spectra (0.80-2.5 m) are found in Figure 1.
Fig. 6: Log plot of six spectra from +4 to +18 days after (see Section 5.2). The ordinate is log flux and the spectra have been shifted by a constant. The abscissa is wavelength in microns. The spectra are labeled with the epoch (in days) relative to maximum light in V. The resolution for each spectrum after smoothing is noted in the top of the figure. Labels for each SN are in the same order and color as the spectra. The full sample of ten spectra are found in Figure 1.
Fig. 7: Doppler velocities of all SNe Ia combined are plotted against epoch for lines of Mn II, Ca II, Mn II, and the edge of the iron group feature discussed in Section 5.2. The abscissa is epoch in days from maximum light in V. The ordinate is expansion velocity in km s-1 (See Table 3). It can be seen that the measured velocities for Mg II and Ca II remain above 12,000 km s-1 through +1 day after maximum light even though photospheric velocity has dropped below 10,000 km s-1at this time. The Edge of the region of incomplete silicon burning (labeled “Fe edge” in the figure) also remains above 10,000 km s-1 through +18 days while the photosphere is less than 5,000 km s-1at this time. Contrast the Mn II velocity which seems to follow the photosphere.