Precise measurement of cross section of 3He(3He,2p)4He by using He-3 doubly charged beam
Abstract
The fusion cross section of 3He(3He,2p)4He at a center of mass energy of 30 to 50 keV has been measured by using helium-3 doubly ionized beam at a low-energy high current accelerator facility, OCEAN. Free from molecular interference in the beam, the measurement determines the astrophysical S-factor with better statistical and systematical errors than previous data. By using singly and doubly charged helium-3 ions the facility envisages to provide the data from high energy to Gamow energy regions.
pacs:
26.65.+t, 25.55.HpI Introduction
Of the reactions involved the solar combustion, namely d + p 3He + , 3He + 3He 2p + , and 3He + 7Be + , we have focused on the cross section measurement of the 3He + 3He reaction at an effective energy of Ecm=30-50 keV. Among many experimental works, the only experiment which has been conducted in or lower than the Gamow energy is the 3He + 3He 2p + reaction at the LUNA in Gran Sasso laboratory LUNA . The latter was performed near the Gamow energy without measurement at Ecm=25-45 keV due to accelerator limitations that lower voltage could not be applied with a high voltage static accelerator while higher voltage more than 50 kV could be impossible at the LUNA. For a wider energy range Ecm=17.9 to 342.5 keV, the experiments done by Krauss et al slightly extended the data over this energy gap LUNA2 . For the nuclear astrophysics discussion, in particular, standard solar model or nucleo-systhesis continuous data down to low energy is crucial to deduce the astrophysical S-factor, S17. Therefore, successive and precise data from around 50 keV to 20 keV center of mass energy are needed. For this purpose, we have constructed a low energy and compact accelerator facility which provides doubly charged 3He ions for the measurement in the region between 50 keV to 25 keV and also singly charged 3He ions in the region less than 25 keV center of mass energy. This is the first report of a series experiments done at our low-energy high current accelerator facility, OCEAN. We obtained precise results from 45.3 to 31.2 keV in center of mass energy for the 3He+3He2p+ reaction with a doubly charged incident 3He beam. It has the substantial advantage of eliminating the molecular interference in the proton spectra by the 3He + d reaction caused by the incident HD+ beam.
II Experimental apparatus
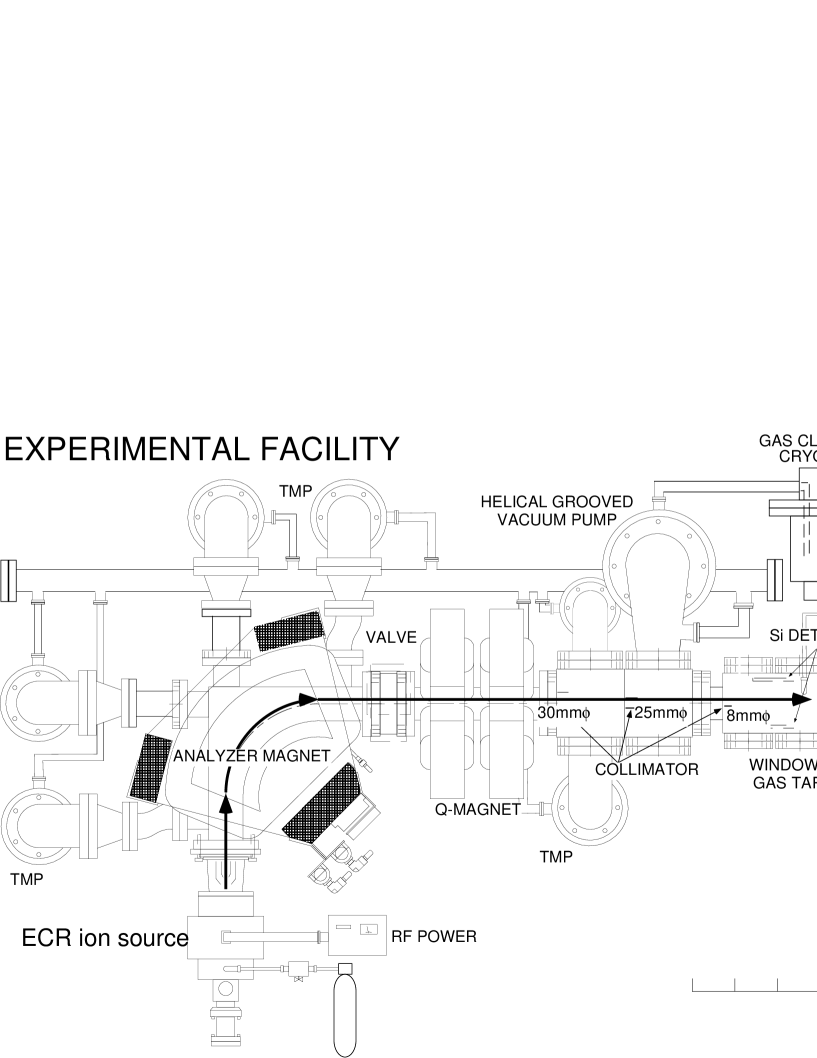
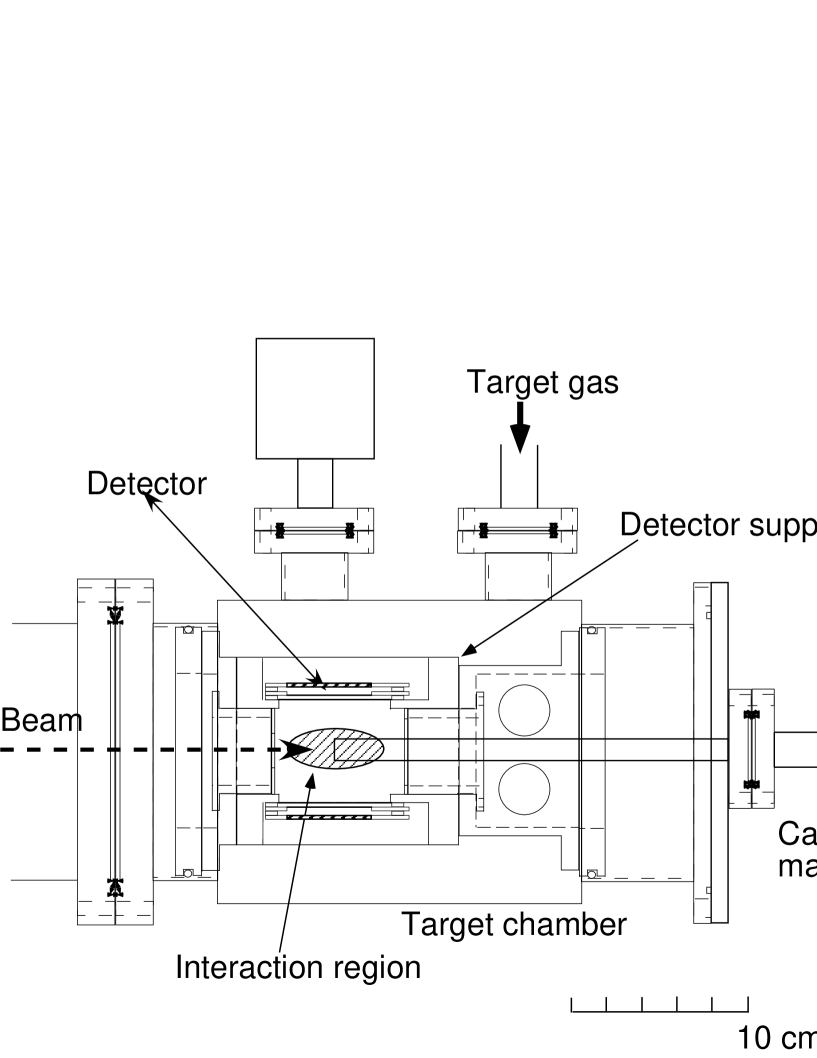
The experimental apparatus, OCEAN (Osaka University Cosmological Experimental Apparatus for Nuclear Physics) consists of: (1) a powerful ion source that provides an intense current of more than 1 mA for 3He1+ ions at incident energies of 30-50 keV, or 200 A for 3He2+ at incident energies of 90.6 to 62.4 keV. (2) low energy beam transport with good transmission, (3) a windowless gas target and recirculation / purification system, (4) a reliable calorimeter, (5) detectors for reaction identification, and (6) an electronics and data acquisition system based on CAMAC. The layout of the OCEAN is shown in Fig. 1.
II.1 Ion source and extraction electrodes
An intense ion source that can produce 3He2+ ions is essential for the present study. The NANOGUNTM, which was obtained from PANTECH, confines high-temperature electrons produced by the electron cyclotron resonance (ECR) and is assembled into an ECR ion source with 10 GHz, 200 watt RF generator (model VZX-6383G5, CPI). The original NANOGUN ECR ion source made by PANTECH can provide 40 A for 40Ar8+ at 20 kV extraction voltage with an RF power of 60 W. From these data we could easily foresee the possibilities of obtaining 3He1+ or 3He2+ ion beams of more than 100 A, although an applied potential to the extraction is not enough to use this ion source for astrophysical applications in a wider enery range. For this purpose, we redesigned the ion source extraction system to meet the ion optical condition for the present window-less gas target. Leroy et al. reported an improvement for the analyzed current and beam emittance of 3He1+ beam by the a system called Multielectrodes Extraction for CAPRICE-type ECR ion source. It supplied with an analysed current of 2.3 mA of 3He1+ giving a transmission of more than 75 % in the beam line Leroy . did you also do this). Based on several experimental studies and computer simulations we designed and applied a two-electrode extraction system for the NANOGUN ECR ion source Ita_ION . This improves the beam emittance under the influence of a strong space charge force, and secondly, it moderates the electric field gradient ascribed to high operational voltage. The optimization process for applying a suitable voltage to the intermediate electrode progressed considerably during experiments measured at each center of mass energy. For the present experiment between 45 keV and 31.2 keV center of mass energy, around 100 A of double charged 3He beam could pass through the three stages collimators to the gas target. A specially designed ceramic insulator (SUMIKIN CERAMIC Co-Ltd) with two folds on the surface could support up to 50 kV potential without any surface discharge at a distance of 170 mm from the surface. We fabricated conic type and straight type extraction electrodes. It consists of a beam forming electrode which has a long straight part similar to the original NANOGUN’s design and a conic structure for the beam forming electrode nearly parallel to the end surface of the plasma chamber. The performance and design have been described in previous papers Ita_ION .
II.2 Low energy beam transport
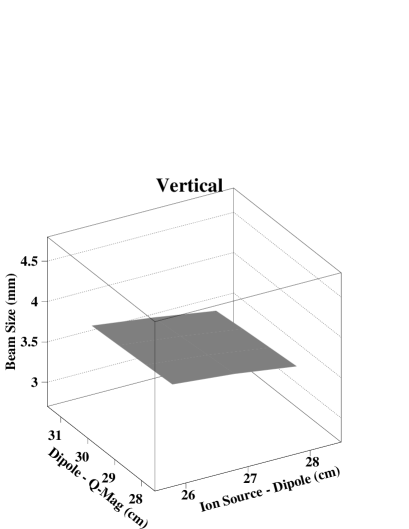
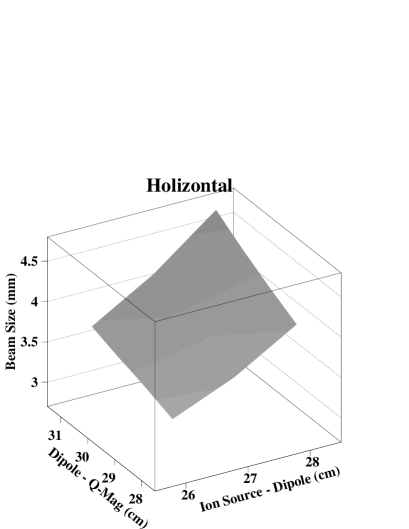
The low energy beam transport system between the ECR ion source and the gas target achieved a high beam intensity and other desirable beam qualities, thereby allowing for precision measurements of the present 3He+3He2p+ experiment. Generally, it is known that there a strong space charge effect in the beam transport at ion currents of more than 1 mA. It is essential that this effect is accounted for when calculating the beam optics. We used a GIOS code developed by Wollnick et al. for incorporating this effect wollnic . We adopted the D (dipole, 90-degree deflection angle) + Q + Q transport scheme for our system since it is easier to operate fewer elements. In this calculation we assumed a beam source of 100 mm mrad and 5mm in diameter. Despite the variance in total potential of the beam, a nearly invariant beam form could be realized at the source exit using the extraction system stated before. To maintain the minimum slit aperture, we calculated the dimension of the beam at the target position by varying the various parameters of elements and drift lengths so as to achieve smaller and . Very attractive results such as a constant and and a nearly parallel beam form are shown in Fig. 2. The beam transmission efficiency from the ion source through the target is about 30 % (Table 1).
II.3 Window-less gas target
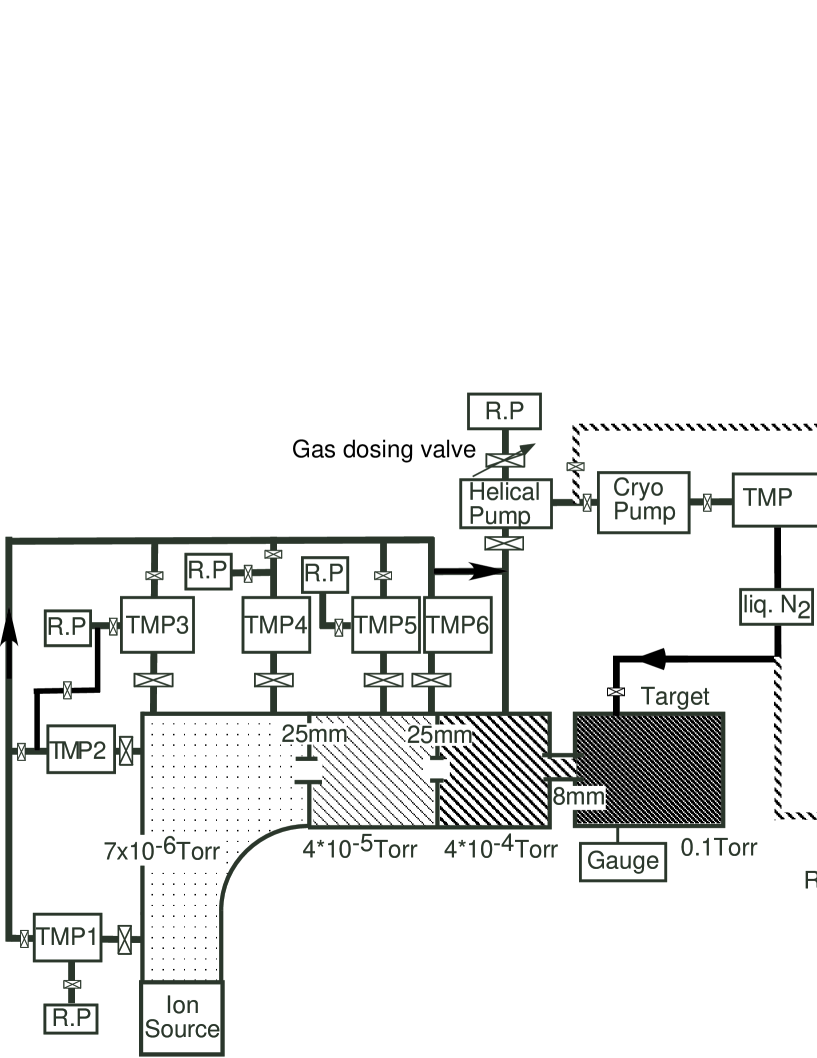
The window-less gas target for the study of the 3He+3He reaction consists of a differential pumping and gas circulation/purification system as shown in Fig. 3.
In order to maintain a pressure of 1 mbar in the chamber of the 3He gas target without window. the pumping system should be composed of several stages between the target chamber and beam transport system. Thus we prepared a helical groove vacuum pump (model TS-440, OSAKA VACUUM Co.Ltd TS-440) as the main pump for evacuating the gas flow at the viscose region as well as at the higher vacuum region. The sizes of collimators at every stage were estimated by calculation in order to maintain a pressure of about 0.3 Torr in the target chamber. During the experiment, the pressure in the target chamber was maintained at 3.1(0.1) Torr for about four days.
The recirculation system consists of a helium tight pump, an oil free diaphragm membrane compressor, reserver vessels, compound gauges, ultra fine regulated valves and a quadruple mass spectrometer as shown in Fig. 3. Since all evacuation pumps connected to the helical pump, a gas dosing system has been employed in order to maintain a constant target pressure to evacuate the input gas amount at the ion source. Because during experiments, gas injection into the ECR ion source had the effect of gradually increasing the target pressure. Thus, a constant target pressure was maintained by controlling the signal from the capacitance manometer (Barocel-655) located at the target chamber with a gas dosing apparatus (model EVR 116 and RVC 300 controller).
The new purification system developed for the present experiment is quite different from the usual method. It exploits a cryo-pump (model U-140W, DAIKIN) as a purifier without a special absorbent and liquid nitrogen, although high heat input could be expected at the high operating pressure. This has been overcome by adding another oil free turbo-molecular pump (model A30FC, ANELVA) between the cryo-pump and the target chamber. As pointed out by A. Krauss et al. LUNA2 , the deuterium contamination both in the target and the beam, resulting from the water vapor, is a crucial problem for obtaining low energy data, since the d + 3He reaction cross section is six orders of magnitude higher than that of the 3He + 3He reaction. In the case of 3He2+ beam (e/m=2/3), we can avoid molecular interference of the HD+ beam (e/m=1/3), with analyzer magnet (Fig. 1) contaminating the incident 3He1+ (e/m=1/3) beam, whereas this could not be avoided if we had employed a single charged 3He beam (e/m=1/3), we have measured the deuterium contamination in commercial 3He gas by detecting HD+ separately via Accelerator Mass Spectrometry (AMS). The experiment was carried out using the RCNP K=140 AVF cyclotron. The cyclotron accelerator and the NEOMAFIOS ECR (NEOMAFIOS) ion source were operated only for the experiment on the beam injection line at an anex leading to the post accelerator (RCNP Ring cyclotron). The present result is HD+/3He = (3.820.69)10-5. It is noticed that even if an ECR ion source uses electrons with higher energy than that of a duo-plasmatron ion source there is a considerable amount of HD+ production from the surface of the ion source and from the bottle of 3He gas.
Deuteron contamination in the target was also estimated during operation of the recirculation and purification system. Then the pressure at the target chamber was 1.210-2 Torr, and 7.610-7 torr at the helical pump. The H2O component in the residual gas was measured by means of a quadrupole mass spectrometer, to be about 20 %. Assuming that the amount of H2O at the target gas is the same as the residual gas, and the deuteron abundance is the same as the natural abundance (0.014 %), we can deduce that the deuteron contamination (D2O) is in the order of ppm. This is satisfactory for the present measurement as will discussed later. In addition, the amount of deuterium contamination in the target gas was also evaluated by means of the 3He + 3He experiment, by detecting the 14.7 MeV proton, and was found to be about 0.1 ppm.
II.4 Calorimeter
A calorimetric device has been developed to measure the projectile flux in the present experiment, since the conventional method of charge integrating to determine the number of incident particles is not applicable due to the neutralization of the incident charged particles with the gaseous target.
Many types of calorimeters have been developed calori . There are two types of calorimeters. One type measures the temperature difference between two parts thermally isolated with large heat resistance material. The other type measures the power needed to stabilize the temperature of water used to cool the calorimeter cup which is bombarded with energetic particles.
We developed the calorimeter by using a heat flux sensor with an accuracy of better than 5 % in the dynamical range of 1-30 watts calori_kudomi .
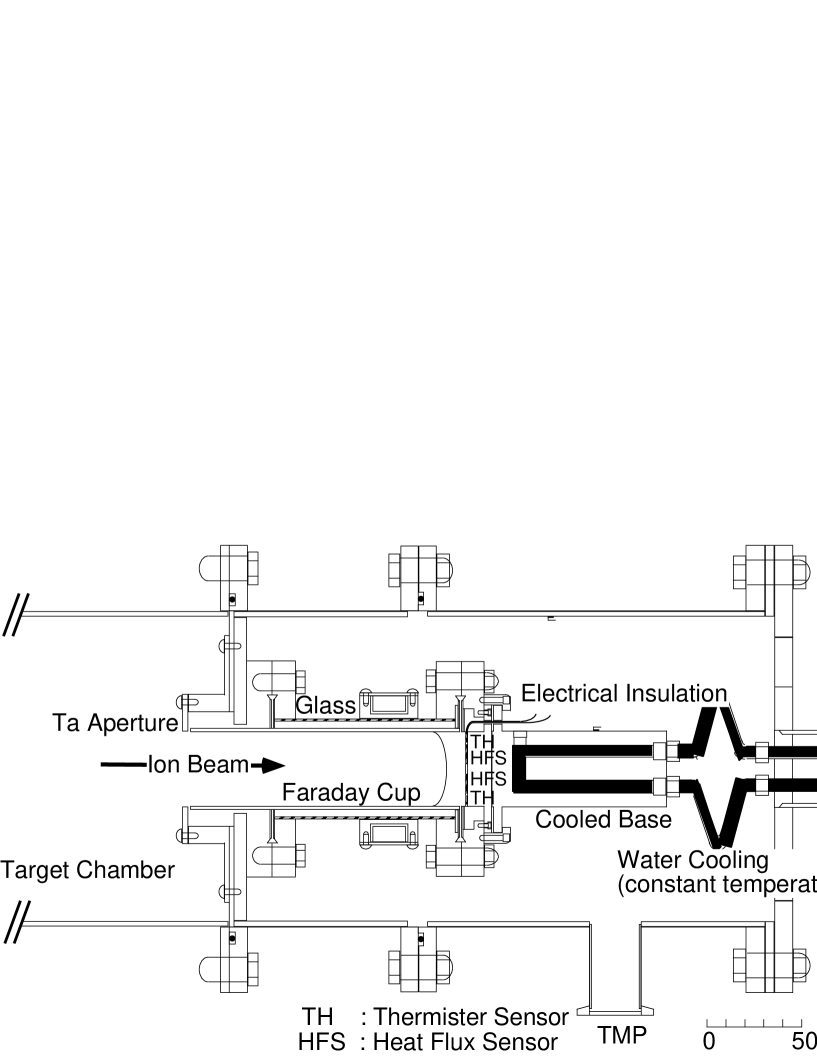
The structure of calorimeter is shown in Fig. 4. It consists of a solid copper heat sink (100 mm length, 38 mm diameter) with water channels, and a Faraday cup (140 mm length, 38 mm diameter, 1.5mm wall thickness) in front of the heat sink. The Faraday cup is supported by a Pyrex glass insulator as well as a metal flange with a Teflon gasket. This organic gasket served as a vacuum seal as well as an electric insulator. Therefore, this calorimeter can also measure the number of incident particles, when the target chamber is in vacuum, by an electrical method. At the entrance of the cup, a secondary electron suppressor is installed. Around 100 volt was applied to the suppressor for the current measurement.
After passing through the window-less gas target, the incident 3He1+ and 3He2+ beam is neutralized and captured in a Faraday cup and calorimeter. In order to be applicable to a wide current range, a heat flux sensor (HFS) (OMEGA HFS-3) was used to measure the heat transfer from the hot part to the cold part. The HFS is a thermister bolometer which can measure the heat flux to or from a surface with minimum disturbance of the exiting heat flow. In this method, a self-generating thermopile is arranged around a thin thermal barrier to produce a voltage that is a function of the thermal energy passing through the sensor. The response of the sensor to the thermal energy input is 1.10 to 1.11 mV/W/m2. For precise measurements of the heat transfer, we made use of the following procedures: 1) In vacuum, the current of the ion beam can be measured by standard charge integration where the calorimeter cup serves as a Faraday cup. 2) To reduce the conduction and convection losses, the heat capacity of the calorimeter should be reduced by as much as possible in order to get a better time response. With the present heat flux sensor, temperature differences of less than 0.001 ∘C can be detected easily. Therefore, the temperature of the heat sink of the calorimeter should be stabilized to better than 0.1 ∘C with heat exchange. As shown in Fig. 4, between the copper base and the thin plate of the calorimeter, two heat flux sensors are sandwiched with thermister temperature sensors. These are originally insulated electrically. As shown in Fig. 4, termister temperature sensors are also located to measure the temperature of the ambient or Faraday cup base and the cooled heat sink. These are installed in a stainless steel pipe (40 mm length, 10.5 cm diameter), which can be evacuated by a small turbo-molecular pump.
The calorimeter was tested by using a 3He2+ beam of energy of 40 kV. The relation between beam current(I) and heat flux(H) can be written as,
| (1) |
where is the temperature of the calorimeter and is the heat capacitance. The term shows that the temperature of the calorimeter depends on the incident beam current. Thus, if the intensity I is changed, the converted heat is used to heat the calorimeter and is also transferred to the cold base.
Since the transferred heat may approximated to be proportinal to the temperature difference between the the front and cold base, the second term in equation 1 can be rewritten as . Thus, equation (1) can be written as,
| (2) |
In order to determine the parameters and ,
an experiment was carried out with a 3He2+ beam of 40 keV
(
Ecm).
The beam current was calculated from the HFS output by comparison
with the Faraday cup measurements.
The HFS output was measured by a KEYTHLEY 2000 multimeter.
The parameters and were determined as follows:
1) Parameter : If the system is stable, that is,
incident beam and temperature are stable,
the second term of Eq. (2) can be ignored.
In this condition, the parameter can be determined
by a least square fit as shown in Fig. 5(a).
2) Parameter : This papameter can be determined
once parameter is known, as seen in Eq. (2).
The term was measured for averaged time scales of
3, 7, 15, and 30 s.
It was found that the scale of 30 s was appropriate.
Fig. 5(b) shows as a function of .
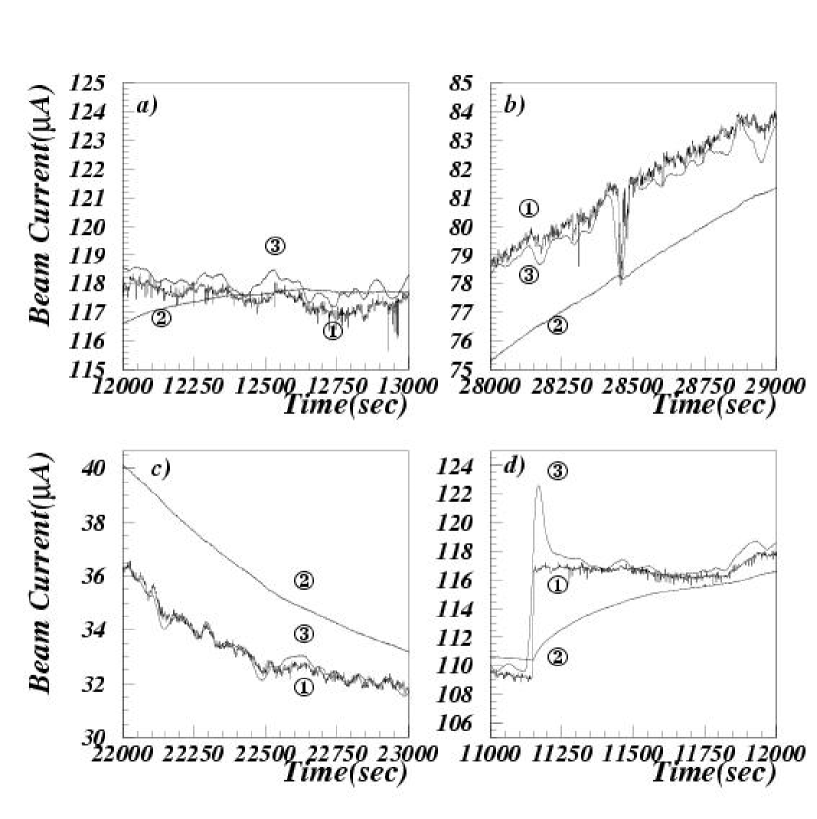
3) Comparison with beam current: Fig. 6 shows the beam current
as a function of time measured using a Faraday cup,
, and
with different beam conditions, i.e.,
stable, slowly increasing, and decreasing beam current.
The calculated currents measured with the HFS reproduce the measurements with the Faraday cup as shown in Figs. 6(a) to 6(c). On the other hand, if the beam current is suddenly changed as shown in Fig. 6(d), the calculated currents from the HFS output overestimate the value measured by the HFS. Further improvements of this system are necessary. Fortunately, this case should not be a fatal problem for an astrophysical experiment with long term measurement times of typically one day or one month, since this occurs rarely, at most one or two times in a day. Thus, in the experiment, the error caused by this overestimate can be neglected.
II.4.1 Reproducibility of beam current for different energies
The reproducibility of the beam current determined from the HFS output was verified for several beam energies. Measurements were carried out on 3He2+ beam at incident kinetic energies of 35, 30, 25, and 20 keV. The beam currents were calibrated using the parameters determined with the 40 keV beam. Fig. 7 shows the accuracy of the calculated beam current in the form of , where and are the beam currents measured by the HFS and the Faraday cup (FC), respectively. The accuracy was better than 2 % for the measured energies.
II.4.2 Estimation for transferred heat in HFS
The heat transferred through HFS can be calculated from the calibration parameter of HFS (OMEGA HFS3: 1.10 1.11 V/W/m2 at 70 ∘F). Also the kinetic energy of incident particles can be calculated from the charge integration. Table 2 shows the results of these calculations. It was found that in the equilibrium state most of the heat is transferred through the HFS.
II.4.3 Heat exchange with the surroundings
Because of the different vacuum conditions during the calibration (10-6 Torr) and during the experiment (0.1 Torr), the effects of convection heat losses by the flowing gas in the target chamber have to be estimated. The heat transmission by convection was measured by comparing the transferred heat through the HFS for the two conditions of vacuum (10-6 Torr and 0.1 Torr) in the target chamber. The temperature of cool base was 30 ∘C. The difference of HFS output was 0.04 W corresponding to about 1.7 % for a 35 keV 100 A beam.
II.5 dE-E counter telescope
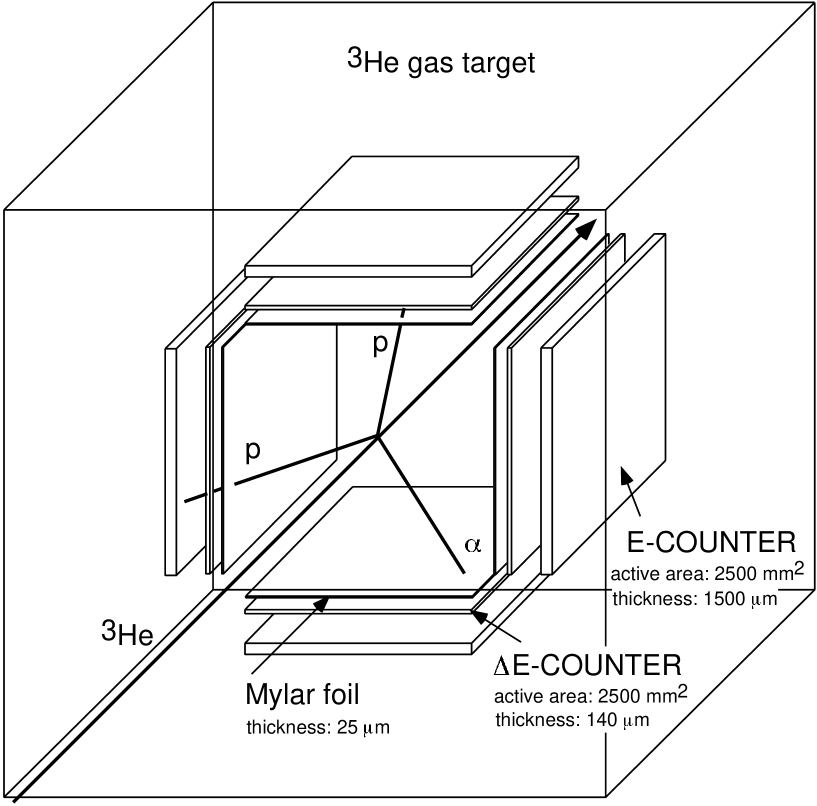
In order to ensure a large detection efficiency and a clear discrimination of real events, we exploit four dE-E counter telescopes by using semiconductor detectors for the measurement of the 3He(3He, 2p)4He reaction. These detectors are installed into the target chamber filled with 3He gas and are capable of identifying the 3He+3He reaction (Q = 12.86 MeV) as shown in Fig. 8.
The reaction generates two protons which have kinetic energies of 0 to 10.7 MeV, and an alpha particle which has kinetic energies of 0 to 4.3 MeV. The dE and E detectors in each telescope have an active area 2500 mm2, the dE detector has a thickness of 140 m and the E detector has a thickness of 1500 m (MICRON Ltd. ).
To stop the generated alpha, photons and elastically scattered 3He from the beam, an aluminized Mylar films with thickness of 25 m are located in front of all dE counters. The distance between the dE-counter or E counter and the beam axis is 32.5 mm and 37.1 mm, respectively. These detectors are fixed to a cylindrical and four faced base of oxygen free high conductive copper (OFHC). It is helpful to avoid microphonic noise and natural background.
II.6 Data acquisition system
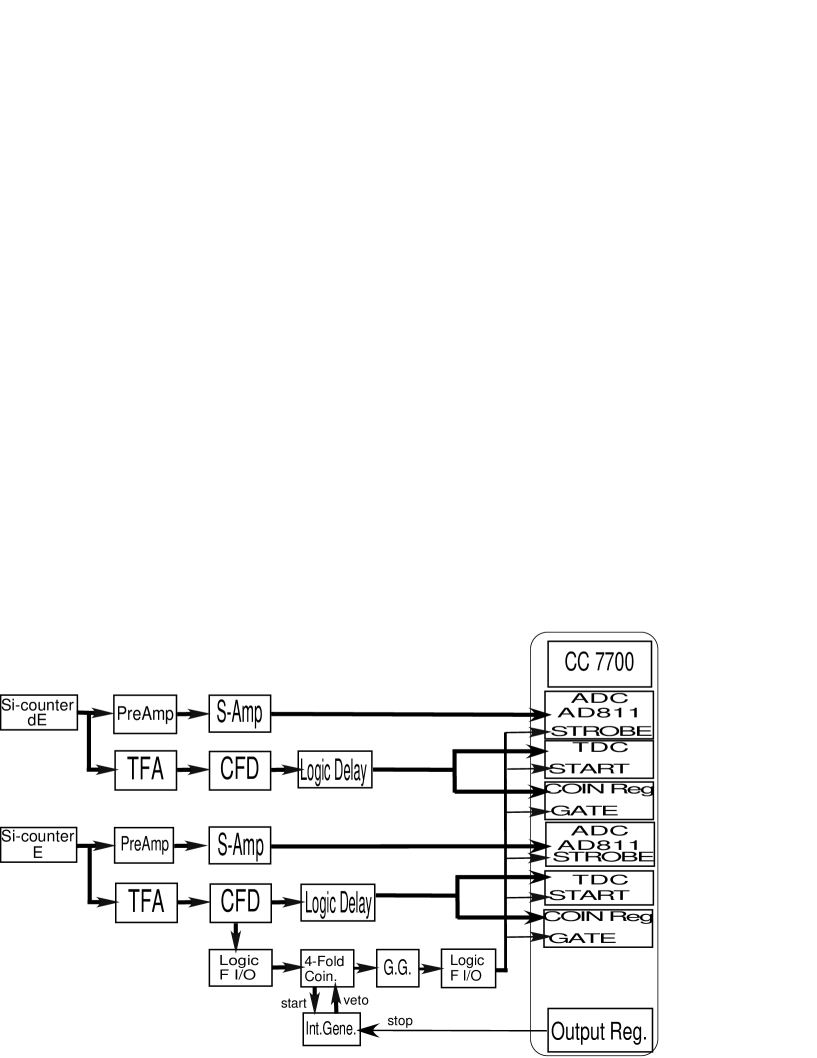
Analog signals from each detector are fed into preamplifiers (model 142IH, ORTEC, for dE counters model 142B, ORTEC, for E-counter) with inorganic coaxial cables (Cu-S5ESS-05 DIPSOL CHEMICAL Co.,Ltd.). Since a shorter distance between the detector and preamplifier is desirable to reduce electrical noise, the distance is 45 cm. The signals from the preamplifiers are amplified by both spectroscopy amplifiers (SAMP, model 472 ORTEC) and timing filter amplifiers (TFA, model 454, ORTEC). The signals from the SAMP are led to a CAMAC peak sensitive analog-digital-converter system (ADC ,model AD811, ORTEC) while the signal from the TFA’s are sent to a system of constant fraction discriminators (CFD, model 935, ORTEC) where the thresholds are set above the noise level of the detectors. The logic output of the CFD is fed into a logic Fan-In/Fan-Out (Fan-I/O, model 429A, ORTEC) delivering a gate signal for the CAMAC ADCs with a gate width of 400 nsec. The logic output provides a start signal for a time spectrum via a CAMAC time-digital-converter system (TDC, model 2228A, Lecroy). The stop signal of the TDC’s is provided by the CFD with a 100 nsec delay. The signals from the ADC and TDC systems are contlolled by a CAMAC crate controller (model CC7700, TOYO). The data from the crate controller is transferred to Linux station (model L400c, DELL), via a CAMAC bus, and stored on hard disk. A schematic diagram of the present data acquisition system is shown in Fig. 9.
The dead time of this data taking system is 400 sec for 1 event. The typical counting rate of the measurement of the 3He + 3He reaction, which includes the background events caused by 3He + d reaction, cosmic ray, and electrical noise is usually about 3 counts/sec. Therefore, the total dead time of these measurements is about 0.1 %.
Before the reaction experiments, all the counters were calibrated using a 241Am source (5.48 MeV). The energy resolution of the dE-counters was 100 120 keV (FWHM) for a 5.48 MeV particle, and for the E-counter it was 70 100 keV(FWHM). The energy gain of S-amp was optimized to be able to measure the energy range up to 10 MeV for the dE-counter and 20 MeV for the E-counter. This energy range is required to measure not only 3He + 3He events but also 3He + d events, since 3He + d events are needed for estimation of background and they are useful for checking the energy scale of each counter telescope. The linearity of the present amplifier system was measured by use of a precision pulse generator (model 419, ORTEC). Linearity was observed to within 0.05 % for all of the energy range of each counter. The stability of the energy gain of the amplifiers was checked and the resultant gain shifts were less than 2 % for 6 months.
III Analysis of experiments
For evaluation of the cross section, the number of counts for the 3He(3He,2p)4He reaction, the 3He target density and the 3He beam intensity should be measured. The values for the effective reaction energy and the integral term for detection efficiency were calculated by means of a Monte Carlo simulation developed in the frame of the present work.
The number of counts per unit of time with respect to a length of the extended 3He gas target is given by the expression
| (3) |
where is the number of counts for the 3He(3He,2p)4He reaction, is the 3He target density, is the 3He beam intensity per unit time, and is the absolute detection efficiency.
Introducing the stopping power (i.e. the energy loss per unit length), equation (3) can be rewritten in the form
| (4) |
The total number of counts for the full target length is then given by
| (5) |
For the case of a thin target, introducing an effective reaction energy corresponding to the mean value of the projectile energy distribution in the detection setup, one arrives at
| (6) |
III.1 Effective reaction energy
The effective reaction energy was the mean value of the beam energy derived from an energy loss calculation in the target gas. As we could not apply any measurement for the absolute energy of ion beam, such as time of flight techniques or an Wien filter, we determined the value by measuring a voltage divided with a precise register chain of a ratio of 1/10000(STANDARD ENERGY, S-100) for the applied voltage to the ion source (SPELLMAN, SL-1200 (60 kV/20mA)). This resistive voltage divider was investigated by applying the exact voltage calibrated with the second standard and the resultant absolute accuracy is 0.2 %. It was measured at intervals of 1.5 second for all measurements. The stability of the voltage was less than 0.1 % for about one day.
Compared with an ion source of a quiescent plasma such as a duoplasmatron ion source an ECR ion source has a finite plasma potential. Thus, we took into account this plasma potential for the acceleration voltage. The adopted value was 21.32.4 eV as reported by JAERI group for the NANOGUN ECR ion source Saitoh .
For the extended geometry in the present gas target experiment, the reaction energy distribution due to the energy loss of the ion beam along the beam path should be estimated precisely as possible. In low energy experiments this might raise the ambiguity for the electron screening potential; we had to take care of experimental conditions such as target pressure or its difference along the beam axis. In this series experiments for energies less than 30 keV center of mass energy, this problem should be treated more rigorously.
There are quite number of experimental and theoretical works for stopping powers of charged particles in matter. Charged particles lose their energy through collisions with nuclei and with atomic electrons in matter. Although the greatest part of the energy loss occurs by collisions with electrons, low-energy ions lose their energy by collisions not only with electrons but with nuclei. Since it is impossible to deduce stopping powers data near the zero energy, using present-day technology, we have to use updated compilations with an accuracy of ranges between 2 % and 10 % SP . Therefore to calculate the energy loss in the target, we used the stopping power values estimated by the SRIM computer code SRIM , which gives results which are consistent with the experimental energy losses to within a 10 % difference at most.
For example, the stopping power of incident 3He with an energy of Elab=90.00 keV is 9.310-15 eV/atom/cm2. The energy distribution of this particle in the 3He gas target with pressure of 0.1 Torr is simulated by the Mote Carlo program and the result is shown in Fig. 10.
We employ the full target length of =30 cm as the distance between the entrance of the target just after the collimator and the entrance of the beam calorimeter. Since the rapid reduction of the cross section is about 11.2 % at ELAB(3He)=90 keV over the target thickness when we assumed a constant factor, the effective energy loss is evaluated to be (50050) eV. This value roughly agrees with the back-of-the-envelope value of 493 eV for the energy loss between the entrance and the center of the counter telescope on the beam axis. As shown in Fig. 10, we simulated the effective target length and estimated energy spread of 79 eV as the error of the incident beam energy. The energy loss due to the residual gas between the ion source and the target entrance is 3.710-3 % of incident beam energy.
In summary, at an incident beam energy of (90.00.13) keV, the effective reaction energy is Elab = (89.500.13 ) keV, taking into account the accuracy of 0.1 % for the acceleration voltage, 10 % for the stopping power and 0.09 % for the energy spread in the target.
III.2 Beam current
The incident projectile number () is deduced from the deposited power measured with our calorimetric device as described in the former section. It was calibrated using a charged beam in vacuum by comparing with the electrical beam current in the Faraday cup. The electrical charge collected in the Faraday cup was measured with the current integrator (KEYTHLEY 616 digital electrometer). The absolute value of the current integrator was calibrated by measuring the current which was supplied with a precise current source (R6161 ADVANTEST). It has an accuracy and a stability better than 0.001 %. The difference between current measured by current integrator and the value of the current source is less than 3 % and it was corrected. The following was taken into account to evaluate the incident particle number . The beam current measured by calorimeter was corrected because of the energy loss of incident beam in the target gas. The energy loss was estimated by SRIM program and was 1.600.16 keV when incident beam energy was 90.0 keV (ECM=45.0 keV). This energy loss was 1.8 % lower than the incident energy.
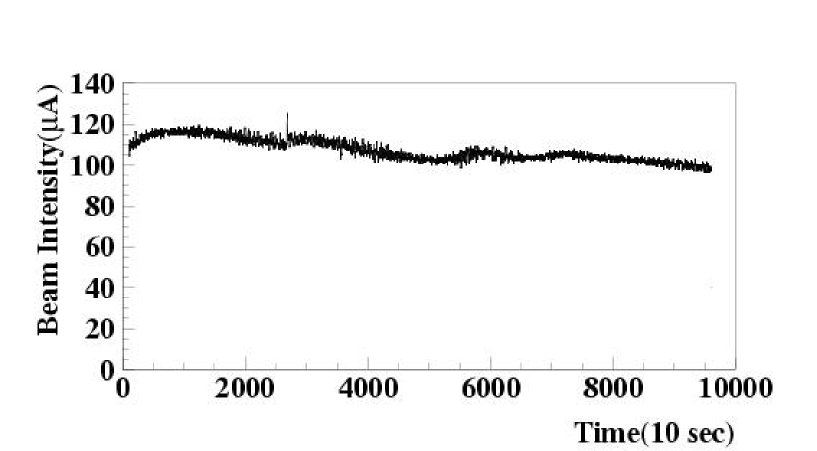
The intensity was simultaneously corrected by recording the beam energy and the target gas pressure at intervals of 1.5 seconds. The typical beam intensity was about 100 A at an incident energy of 90 keV for the 3He2+ beam. The beam intensity measured by the present system during experiment is shown in Fig. 11.
III.3 Target density
There are several factors which affect the target density such as the gas temperature and a pressure gradient in the target chamber. We measured the target gas temperature with a termister (103AT-2) inside the chamber which was likely to be different from that of the laboratory room since the target gas was heated by the beam and cooled by the circulated gas for the purification system.
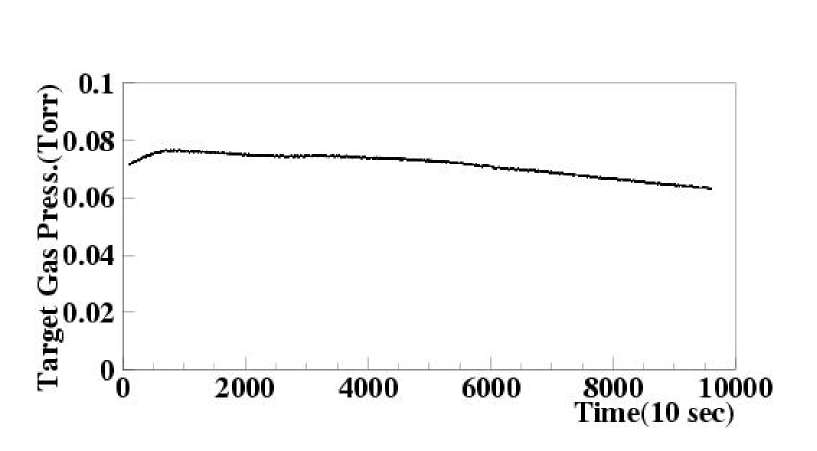
As the target pressure could not be measured directly at the beam-target interaction region during the experiment, the pressure was measured at the top of the target chamber as shown in Fig. 12. The pressure distribution caused by the geometry of detector holder, collimators and gas circulation was measured by extending the stainless tube directly from the capacitance manometer set downstream of the target chamber. The capacitance manometer, which is usually installed at the top of the target chamber, was removed to the end of the chamber only at this measurement, as shown in Fig. 12. Simultaneously, we used another gauge just before the inlet to the chamber for a normalization. The difference between the target gas pressure at the top of the chamber and that measured at the interaction region was rather small, which might be a shorter mean-free path at gas pressure of the order of 0.1 Torr. The absolute pressure at the target should be corrected by 5 % less than that measured at the top of the chamber. Owing to these corrections, the target density can be determined to an accuracy of 1.3 %, considering the accuracy of 0.16 % from the target gas pressure, 1 % from the correction due to the gas temperature, and 0.8 % from the correction due to the measurement position. The measured and corrected target gas pressure at the every interval of 1.5 seconds is shown in Fig. 13.
IV Data analysis
IV.1 Monte Carlo simulation for the OCEAN experiment
In order to find an optimum detector setup for a high efficiency and background free measurement, we exploit the Monte Carlo simulation program based on GEANT3. It was used to calculate the interaction between the ejectiles and the detectors. Also, the GENBOD code was used to generate the ejectiles. Thus the program takes into account the following aspects: 1) the detector geometry, 2) the energy loss and energy straggling of the ejectiles in both the target gas and i the thin foil in front of the detector, 3) kinematic effects on the energy of the ejectiles in the target, 4) yield dependence of the ejectiles over the passage of the target, and 5) the non-uniform depletion thickness for the E counter.
IV.2 Measurement of the D(3He,p)4He reaction
To verify the validity of the simulation program, that is to estimate the systematic error, the experimental results of the D(3He, p)4He reaction (Q=18.4 MeV) are compared with those of simulations. The comparison to this reaction has several advantages: 1) The generated protons from the 3He + d reaction have a definite energy of 14.7 MeV. 2) The energy of the protons from this reaction is almost the same as that from the 3He + 3He reaction. 3) the cross section of the 3He + d reaction is six orders of magnitude larger than that of 3He + 3He reaction.
The D(3He,p)4He reaction was performed by using 90 keV (Ecm=45 keV)3He2+ beam at the OCEAN facility. The target pressure of the deuterium gas was maintained around 1.010-4 Torr.
Fig. 14 shows observed and simulated energy spectra obtained with the dE-E are compared. The broad energy spectra for E = 514 MeV at E = 1 MeV arise from an insufficient depletion depth for protons incident on the surface at angle near 90 degree. We applied a bias voltage of 180 V to the E-counter, which corresponds to the depletion depth of 900 m, to avoid a discharge in the gas target thicker depth needs more voltage. The other two structures arise from kinematics effects in combination with protons which are incident at angular ranges of 135∘180∘ and 0∘45∘. These three remarkable features are well simulated in the energy spectrum as shown in Fig. 14 (b).
IV.3 Background analysis
It is crucial for the present measurement of the 3He(3He,2p)4He reaction to identify the background origin and to discriminate the true events from the fake events. As already stated, deuterium contamination in the target are the most serious. The number of deuterons in the gas target was determined from the data during the measurement of the 3He(3He,2p)4He reaction as shown in Fig. 15. For this estimate, the value of the cross section for the D(3He,p)4He reaction was taken from ref. HED . We conclude that the deuterium contamination is 0.2 ppm in the target gas, and that such a level could make background events at least 0.1 % of the observed events of the 3He (3He,2p)4He reaction at the energy of Ecm=45 keV.
Another source of background events arises from electrical noise and cosmic rays. These are observed during the measurement without 3He beam for 38 days of operation of OCEAN as shown in Fig. 16. The contribution from this background to the window of the 3He(3He,2p) reaction is 3.6 counts/day. Of these, the cosmic muon events are located around dE = 70 keV and E =450 keV because of the minimum ionization loss of 2 MeV cm2/g. We attempted to reject these events by applying the veto-counter upper and lower places for the target chamber. Finally the expected rate of the present reaction at lower energy is around a few events per day or less, and a typical single background rate of silicon detectors is one event per hour or more. In order to remove such accidental events, two proton coincidence should inevitably be required for the identification of the present reaction near the Gamow peak (next series of OCEAN experiment).
IV.4 Detector efficiency
We developed a reasonable method to determine the acceptable area for the real events of the 3He(3He,2p)4He reaction in the dE-E scatter plot without a redundant and ambiguous procedure. Four types of data such as observed events of the reaction, simulated events for the 3He(3He,2p)4He reaction and for the D(3He,p)4He reaction, and observed background events are summarized for the analysis of each experimental run. The energy distribution of the dE-E scatter plot is divided into 16000 parts of 100 keV 100 keV parts as shown in Fig. 17. The signal to noise ratio which should be derived from the Monte Carlo MC ( 3He + 3He ) divided by MC (3He + D) and measured background was allotted for 16000 parts. All parts are ordered as a function of their S/N; parts having a better S/N are located at the right hand side while worse parts are located to the left, as shown in Fig. 18. Fig 18(a) shows the distribution of the simulated events from the 3He + 3He reaction as a function of S/N ratio. Many events are located in the right hand side in the figure, that should correspond to the better S/N. Also, Figs. 18(b) and (c) show the distribution of the simulated events for 3He + d reaction events and the observed background events as discussed above. It is usual that these background events should be located in the left hand side of each figure. Fig. 18(d) shows the distribution of the observed event for 3He + 3He reaction at Ecm=45 keV, as a function of S/N. The contribution from the background events is apparently very small. Therefore the observed distribution as shown in Fig. 18(d) is particularly similar to the simulated one, shownn in Fig. 18(a), without subtraction of any background events as shown in Fig. 18(d).
Since, most of the background events exist in channels less than 13000 (Fig. 18) the acceptable area for the 3He + 3He reaction could be assigned to channels larger than 13000 channel. The region of that is shown in Fig. 19.
Experimental results are as follows; 3344 counts are observed in the acceptable region, while the contribution from the 3He + D events to the region is 20.9 counts, and that from the other background component is 2.46 counts. After subtracting the number of these background events from the number of observed events in the acceptable region, the number of true events for the 3He + 3He reaction is 3337.4, with a statistical error of 1.8 %. According to this procedure, the detection efficiency can be written as
| (7) |
where to 16000, is the number of counts for the simulated distribution, and is the parameter of the boundary cut point for the accepted events. The accepted event have been derived as
| (8) |
where, refers to accepted events for the 3He(3He,2p)4He reaction, , , are the number of counts for the observed events, for the d(3He,p)4He and for other background events, respectively. Finally the ratio of corresponding to the cross section of the 3He(3He,2p)4He reaction can be obtained. The ratio slightly depends on the boundary parameter as shown in Fig. 20. Thus, the accuracy of the simulated energy distribution in a scatter plot should be derived from the fluctuation of this ratio. When we include the geometrical uncertainty of the counter telescope, i.e., 0.5 % uncertainty of the detection efficiency simulated with Monte Carlo program, the systematical error of the detection efficiency is evaluated to be 3 %.
V Experimental results and discussion
The experimental results for the cross section and S-factors obtained for the first series of OCEAN experiments as from the year 2000, together with the experimental conditions such as the live time, beam current, the target gas pressure, and the target temperature are shown in table 3. The observed events for the 3He(3He,2p)4He reaction and the background events from various sources are also shown in the same table 3.
The cross section for the 3He(3He,2p)4He reaction has been derived from the following equation,
| (9) |
where is the number of counts for 3He(3He,2p)4He reaction, is the 3He target density, is the 3He beam intensity, is the effective reaction energy, is the absolute detection efficiency, and is the stopping power.
The astrophysical S-factors were deduced from the equation
| (10) |
where is the Sommerfeld parameter given by:
| (11) |
where and are the nuclear charges of the interacting particles in the entrance channel, is reduced mass (in units of amu) and is the center of mass energy (in units of keV).
Our present data between Ecm= 45 keV to 31 keV of S(E) are in good agreement with the results of existing data of Krauss et al LUNA2 . The accuracy of both statistical and the systematical data of the present measurement is better than that in ref. LUNA2 .
For the last two decades, studies of the 3He(3He,2p)4He reaction have been carried out over a wide range of energies (Bacher and Tombrello Bacher , Dwarakanath and Winkler Dwarakanath , Krauss et al LUNA2 , and LUNA LUNA ). Of the previous studies, experiments between 17.9 to 342.5 keV center of mass energy by Krauss et al cover a wider energy range than others since they used two accelerators of 350 kV accelerator in Munster University and 100 kV facility at Bochum University. Recently the LUNA group in the LNGS has presented data down to 16.50 keV center of mass energy, although the data was obtained with two separate experimental set-ups,namely at the 450 kV accelerator at Bochum and also 50 kV at LNGS. There remains unaccesible region of energy between 45.82 keV and 24.80 keV. The data in this energy region has been supplied by Krauss et al.
In these previous experiments there were many efforts to obtain the true scarce events from the contaminated background events, such as deuterium contamination both in the incident beam and in the target gas, cosmic rays (mainly muon) or heavy particles, and electric noise. There have been several solutions for these difficulties; Krauss et al., pointed out in 1987 the purity of the ion beam and of the target were of special interest and they estimated that at 350 keV the mass-3 beam contamination HD+ was of the order of 10-5 LUNA2 . Also they applied proton-proton coincidences to discriminate the real events from intruded events for the D(3He,p)4He reaction. They surrounded the target chamber with NE102A plastic scintillator in order to identify for cosmic events. In this way the unidentified cosmic background coincidence event rate was estimated to be less than 1 event/200h in the measurements at Ecm 50 keV. Another source of background events due to occasional discharges of the accelerator high voltage could be avoided by amplifier filter or noise filter. In spite of these efforts, they still consider the contribution of the events caused by the high energy protons from the 3He(d,p)4He reaction (e.g. 2.5 % contribution at Ecm=25 keV ). They also evaluated that the background contribution to the 3He+3He region is 0.40 % of the observed counts of the d-3He events.
The measurements at the DTL showed that cosmic rays produced events within the dE-E region of the 3He(3He,2p)4He reaction amounts to 3.510-4 events/s, while in the latter place at LNGS this rate was observed to be reduced by at least a factor 200, that is, 1.810-6. It will be negligibly small for the low energy measurement less than 30 keV center of mass energy.
We now argue that the OCEAN facility could overcome these difficulties by applying the following, while there still exist the possibilities of background due to the target gas:
1) Only OCEAN exploits doubly charged He-3 ions produced with an ECR ion source and it could avoid the background events due to D (beam) + 3He. Krauss et al performed a p-p coincidence experiment to discriminate the true event, but it could not be applied for the center of mass energy less than 25 keV.
2) Our facility OCEAN has been located in an experimental area of the cyclotron and shielded with 5 m of thick concrete. We have observed the background events arising from cosmic rays in 38 days and also observed the effect from the induced events due to the high energy particles by using Veto-counters composed of plastic scintillators located up and down the target chamber. By this condition of the OCEAN sight we still have a sufficient signal to noise ratio of 10 times larger than unknown fake events as listed in table 3.
Generally, there are still many discussions for the screening potential which enhance the cross section remarkably for low energy fusion reactions. A recent result of the 3He(3He,2p)4He reaction data assumed for electron screening with Ue = 330 eV and adopted a polynomial function for factor,namely . The value is close to the recommended value of AD98 (5.4 + 0.4 MeV b). In a review article concerning synthesis of the elements in stars REVM , it cited LUNA data as MeV b. It still includes a value which suggests that the effective value of may be larger than the adiabatic limit.
Furthermore, it is mentioned that improved data should be obtained at energies from E = 25 keV to 60 keV to confirm or reject the possibility of a relatively larger systematic error in the data around these energies.
VI Conclusion and perspectives
The present experiment with OCEAN has proved to reinforce the compilation data for nuclear astrophysics in solar fusion rates. High current and low background system could measure the cross section in the center of mass energy range from 50 to 30 keV. As a second series of experiments, we have started to measure at energies less than 30 keV, and these results will be reported in the near future. Better results with respect to reduced stematic and statistical errors compared to existing data are expected. When we apply a beam intensity of 1 mA for the 3He2+ beam at Ecm = 20 to 30 keV and a target gas pressure of 0.1 Torr, we can expect 70 2 events per day for real events, while the fake event will be 6 1.8 events per day. Hence, we expect a measurement with a statistical error of about 10 % in this energy range.
Acknowledgements.
The authors gratefully acknowledge Professor Claus Rolfs for the design of the OCEAN accelerator facility. We acknowledge Professor T. Hasegawa for introducing ECR ion source as a bright 3He particle source. We thank Dr. Uwe Greife and Dr. Mathias Junker for many suggestions to measure the reaction cross section of rare events from their experience. We thank Prof. H. Ejiri, Prof. Y. Nagai and Prof. H. Toki for various suggestions and discussions. We also thank Prof. G. Hillhouse for reading critical manuscript. This work was supported by the Grant-in-Aid of Scientific Research, Ministry of Education, Science, Culture and Sports, No. 08404015, and No. 0041120.References
- (1) U.Grief, C. Ascella, C.A.Barnes, F.Bartok’s, E.Ballot, C. Bragging, P.Crosier, et. al, , Nucl. Instr. and Meth. in Phys. Research A 350, 327(1994); U. Griefe, F. Gorris, M. Junker, C. Rolfs, D. Zahnow, Z. Phys. A 351, 107((1995); M. Junker, A. D’Alessandro, S. Zavaterelli, et al., Phys. Rev. C 57, 2700(1998); R.Bonetti, C.Broggini, L. Campajola, P.Corvisiero, A.D’Alessandro et al, Phys. Rev. Lett. 82, 5205(1999); H. Constantini, A. Formicola, M. Junker, R. Bonetti, C. Broggini, et al., Phys. Lett. B 482, 43(2000).
- (2) A. Krauss, H. W. Becker, H. P. Trautvetter and C. Rolfs, Nucl. Phys. A 467, 273(1987).
- (3) P. Sortais, C. Bieth, P. Foury, N. Lecesne, R. Leroy, J. Mandin, C. Marry, J.Y. Pacquet, E. Robert and A.C.C. Villari, Proc. of the 12th Intern. Workshop on ECR ion sources, RIKEN, Japan (1995) pp. 45; R. Leroy, J.C. Angelique, P. Bertand, G.B. Blank, M. Ducourtieux, P. Foury, N. Lecesne, A. Lepine, M. Lewitowicz, C.F. Liang, J. Mandin, C. Marry, L. Maunoury, J. Mercier, J. Obert, N.A. Orr, J.Y. Pacquet, P. Paris, J.C.Potier, J.C. Putaux, E. Robert, M.G. Saint-Laurent, P. Sortais and A.C.C. Villari, Proc. of the 12th Intern. Workshop on ECR ion sources, RIKEN, Japan (1995) pp. 57.
- (4) T. Itahashi, K. Takahisa, N. Kudomi, et al., Rev. of Scientific Instruments 69, 1032(1998); T Itahashi, N. Kudomi, K. Kume et al., Rev. of Scientific Instruments 71, 1075(2000).
- (5) A. Wollnik, WINGIOS(IONTECH), version 2.0
- (6) K. Langanke, et al., Phys. Lett. B 369, 211(1996).
- (7) C.H. Thomann and J.E. Benn, Nucl. Instr. and Meth. 293, 138(1976); A.E. Vlieks, M. Hilgemeier and C. Rolfs, A.E. Vlieks, et al., Nucl. Instr. and Meth. 213, 291(1983); J.M. Nitschke, Nucl. Instr. and Meth. 355, 206(1983).
- (8) N. Kudomi, T. Itahashi, K. Takahisa, et al., , Rev. of Scientific Instruments 72, 2957(2001).
- (9) Y. Saitoh, March 1998, private communication.
- (10) J.F.Ziegler, The stopping and Ranges of Ions in Matter, Vol. 4, Pergamon Press.
-
(11)
J.F. Zieglar, Program SRIM-2000, IBM Research.
http://www.research.ibm.com/ionbeams/SRIM/SRIMINTR.HTM. - (12) G.S. Chulick, Y.E. Kim, R.A. Rice, M. Rabinowitz, Nucl.Phys. A 551, 255(1993)
- (13) A.D. Bacher and T.A. Tombrello, Rev. Mod. Phys. 37, 433(1965).
- (14) M.R. Dwarakanath and H. Winkler, Phys. Rev. C 4, 1532(1971).
- (15) E.G. Adelberger, S.M. Austin, J.N. Bahcall, et al., Review of Modern Physics 70, 1265(1998).
| H.V. | Target(A) | Ion source(A) | |
|---|---|---|---|
| 40 kV | 1+ | 1208 | 3010 |
| 2+ | 103 | 3000 | |
| 30 kV | 1+ | 1200 | 3800 |
| 2+ | 35 | 1900 |
| Beam Current | Voltage at IS | HFS Output | Energy of Beam | Heat Transfer |
|---|---|---|---|---|
| (A) | (kV) | (mV) | (W) | (W) |
| 0. | 0. | -0.83 | 0. | 0.17 |
| 96.4 | 40.0 | 20.86 | 3.84 | 3.75 |
| 69.7 | 20.0 | 7.65 | 1.39 | 1.37 |
| 74.3 | 25.0 | 9.88 | 1.86 | 1.78 |
| 82.5 | 35.0 | 15.66 | 2.89 | 2.81 |
| Ecm | L.T. | B.C. | T.P. | T.T. | True | BG1 | BG2 | C.S. | S-Fac |
|---|---|---|---|---|---|---|---|---|---|
| (keV) | (sec) | (A) | (Torr) | (∘C) | (Cnt) | (Cnt) | (Cnt) | (barn) | (MeVb) |
| 45.3 | 92567 | 104. | 7.46 | 27.1 | 3276 | 20.9 | 2.46 | 1.53 | 5.390.09 |
| 43.3 | 78647 | 91.4 | 6.72 | 27.3 | 1374 | 7.50 | 2.09 | 9.55 | 5.430.14 |
| 41.3 | 80687 | 100. | 6.74 | 27.1 | 939 | 7.08 | 2.15 | 5.79 | 5.510.18 |
| 39.3 | 83109 | 87.4 | 7.26 | 27.0 | 542 | 6.08 | 2.21 | 3.44 | 5.690.25 |
| 37.3 | 155442 | 112. | 8.24 | 29.3 | 770 | 17.0 | 4.14 | 1.83 | 5.460.20 |
| 35.2 | 338862 | 100. | 8.21 | 29.3 | 770 | 21.4 | 9.02 | 9.46 | 5.620.21 |
| 33.1 | 615814 | 103. | 8.25 | 30.4 | 691 | 11.4 | 16.4 | 4.52 | 5.480.22 |
| 31.2 | 528134 | 93.6 | 8.28 | 30.3 | 293 | 5.02 | 14.1 | 2.46 | 6.400.39 |