A Synoptic X-ray Study of M31 with the Chandra-HRC
Abstract
We have obtained 17 epochs of Chandra High Resolution Camera (HRC) snapshot images, each covering most of the M31 disk. The data cover a total baseline of 2.5 years and contain a mean effective exposure of 17 ks. We have measured the mean fluxes and long-term lightcurves for 166 objects detected in these data. At least 25% of the sources show significant variability. The cumulative luminosity function (CLF) of the disk sources is well-fit by a power-law with a slope comparable to those observed in typical elliptical galaxies. The CLF of the bulge is a broken power law similar to measurements made by previous surveys. We note several sources in the southwestern disk with . We cross-correlate all of our sources with published optical and radio catalogs, as well as new optical data, finding counterpart candidates for 55 sources. In addition, 17 sources are likely X-ray transients. We analyze follow-up HST WFPC2 data of two X-ray transients, finding F336W (-band equivalent) counterparts. In both cases, the counterparts are variable. In one case, the optical counterpart is transient with F336W mag. The X-ray and optical properties of this object are consistent with a 10 solar mass black hole X-ray nova with an orbital period of 23 days. In the other case, the optical counterpart varies between F336W = 20.820.06 mag and F336W = 21.110.02 mag. Ground-based and HST observations show this object is bright ( = 18.80.1) and slightly extended. Finally, the frequency of bright X-ray transients in the M31 bulge suggests that the ratio of neutron star to black hole primaries in low-mass X-ray binaries () is 1.
1 Introduction
M31 contains hundreds of X-ray sources in a relatively small field. Precision measurement of their positions allows identification of optical and radio counterparts. Long-term monitoring of these sources provides variability information on timescales which are not probed by single observations. This information can help determine the nature of the X-ray sources. For example, X-ray binaries containing high and low mass secondaries have somewhat different variability, and SNR are not expected to show any variability at all. By using the X-ray variability and luminosity information to determine the nature of the sources one can establish links to the stellar populations in which the sources reside. These links include the effects of star formation on the X-ray source population and the effects of galaxy evolution on X-ray source production.
Several surveys of M31 have been completed in X-rays, finding hundreds of sources, a large fraction of which are variable. Most surveys have concentrated on the central bulge region, which contains most of the bright X-ray sources. These studies began with van Speybroeck et al. (1979), who used Einstein data to catalog 69 objects brighter than 91036 in the M31 bulge and northern M31 disk. Collura et al. (1990) found 2 variable X-ray point sources in the Einstein data of M31. Later Trinchieri & Fabbiano (1991) performed a deeper survey of more than half the M31 disk by combining all Einstein data of M31. They found 108 sources brighter than 51036 including fourteen additional variable sources. The central 34 arcmin of M31 was surveyed with the ROSAT HRI (Primini et al., 1993), revealing 86 sources brighter than 1036. By comparison with previous Einstein observations, they found nearly half of the sources in the bulge to be variable. Two more ROSAT surveys were completed with the PSPC (Supper et al., 1997, 2001). These surveys together covered most of the disk (10.7 deg2) and revealed 560 X-ray sources down to a detection limit of 51035 ; they found 34 sources varied in the 1 year between observations.
Recently, M31 has been studied with the Chandra X-ray Observatory and XMM-Newton. The improved resolution and sensitivity have led to additional interesting observations. For example, Chandra observations have revealed several new X-ray transients (Kong et al., 2002b; Garcia et al., 2002, 2001a; Kong et al., 2001; Murray et al., 1999), as have XMM observations (Trudolyubov et al., 2002a; Shirey, 2001). Trudolyubov et al. (2001) discussed XMM-Newton and Chandra observations of three of these which were discovered in the year 2000. Using XMM-Newton observations, Barnard et al. (2003) showed that the variability properties of one of the brighter sources in M31 indicate that it is a stellar mass black hole binary. Kong et al. (2002a) performed a survey of the central 17 of M31 with the Chandra ACIS-I, finding 204 X-ray sources down to a detection limit of 21035. About half of the sources were variable on timescales of months, and 13 sources were transients. Kaaret (2002) used HRC-I data of the nuclear region to detect 142 sources brighter than 21035, finding nearly half of the bright sources to be variable on timescales of 10 hours. Trudolyubov et al. (2002b) performed a deep XMM-Newton survey of the northern half in the disk, finding that the M31 disk is deficient in bright X-ray sources. Further XMM-Newton observations have discovered diffuse soft X-ray emission associated with the northern disk (Trudolyubov et al., 2004). Kong et al. (2003a) surveyed three widely separated portions of the M31 disk with ACIS-I, finding possible differences between the X-ray source populations in these different regions. Di Stefano et al. (2002) found that M31 globular clusters can be more X-ray luminous than those of the Galaxy and suggested that this was due in part to the larger number of M31 globular clusters (GCs) rather than a difference in the shape of the luminosity function (LF). Finally, Di Stefano et al. (2003) have completed a survey for supersoft X-ray sources (SSSs) and quasisoft sources (QSSs) in four regions of M31, finding 33 such objects.
We have obtained Chandra HRC-I data covering most of the M31 optical disk. These data provide the first opportunity to perform a large area survey of M31 with Chandra, including regular information about the state of the detected sources over a period of two and a half years. While the sensitivity and coverage (0.9 deg2) are not as extensive as that of Supper et al. (1997, 2001) which covered an area of 10.7 deg2, the time baseline is well sampled. We have also obtained 3-epoch HST (WFPC2) images of 2 newly discovered X-ray transients in order to search for their optical counterparts. Among the deepest ground based images of M31 are those that were obtained as part of the Local Group Survey project (Massey et al., 2001); we analyze unpublished sections of these data in order to search for new optical counterparts. In this paper we use the Chandra data to create an X-ray source catalog covering most of M31 and to measure long-term variability in the X-ray emission from these sources, and we use the newly obtained optical data to search for long wavelength counterparts. In §2 we present the X-ray data, source list and lightcurves. In §3, we discuss the X-ray results, including LFs and variability studies. In §4 we describe the optical data used to search for counterparts to the X-ray sources. In §5 we discuss the results of the search for counterparts. Section 6 describes our detailed analysis of 2 X-ray transient sources detected in the optical with HST. Finally, §7 provides a summary of our conclusions.
2 X-ray Observations
2.1 HRC Observations and Data Reduction
The data for this project are originally part of a survey program to look for X-ray transients in M31. Nearly every month from November of 1999 to February of 2001, Chandra took HRC-I images of 5 fields covering most of M31. Observations were then made every few months until June of 2002. Each image was shallow (1 ks) but sufficient to detect any strong X-ray transients in the observed epoch. Individual epochs of these data were of limited use for survey purposes because of their short exposure times, but herein we stack the data into a deeper 17 ks HRC-I mosaic of M31. The observation ID (OBSID) numbers, dates, exposure times and pointing coordinates of all of the observations are given in Table 1. An exposure map of the stacked data is shown in Figure 1, where the thick white outline marks the region of the data where the 6 sensitivity is at least 1.31037(0.9 deg2). Our LFs are complete to this luminosity (see §3.1). We focused on this region in our analysis to provide a constant area of known sensitivity limit. The combined, exposure corrected, background subtracted source image is shown in Figure 2. The image shows the majority of the sources are near the center of M31. The areas near center of the galaxy with the highest exposure have a detection limit of 1.5 1036.
In order to combine the data, they were first aligned using the CIAO script align_evt, which corrects for small errors in the aspect solutions of different exposures by aligning the detected sources in the field. The images of the bulge contained 5 sources suitable for this purpose, which allowed alignment to an rms accuracy of . Unfortunately, in the disk, where there are fewer bright sources, this technique was less successful. In these outer regions, the fields were aligned using the Chandra aspect solution, which is accurate to 1′′. In the uncrowded outer regions, we binned the data to a resolution of 2′′. This binning provided better detection of faint objects by removing the effects of the less precise alignment between exposures in the disk fields. In the central 18′ 18′ of the galaxy, where the alignment was better, we binned the data to 1′′ resolution in order to better match the instrumental point spread function (PSF). Finally, we combined the data into 3 data sets using the task merge_all. One set contained the data for the northern half of the galaxy, another contained the southern half and the last contained the center.
2.2 Source List
2.2.1 Source Detection
We searched for sources in the three data sets using the CIAO task wavdetect. We ran this task searching for sources on 4 size scales: 1, 2, 4 and 8 pixels. The pixels in the merged images were 1′′ in the central 18′ 18′ and 2′′ outside of this region. By searching on several scales wavdetect is able to overcome the large changes in the size of of the Chandra PSF from about 0.5′′ near the center of the field to over 10′′ in the outer regions of the field. One hundred sixty-six sources were detected above our 3.5 detection threshold. Their short names, positions, detection counts, signal-to-noise ratios (), mean X-ray luminosities (; 0.1–10 keV), values for a fit to a constant source, counterparts or previous X-ray detections, and references for those counterparts and previous detections are provided in Table 2. Detailed descriptions of all columns, including a definition of the source naming convention (r1, r2, n1, s2, etc.) are given in the notes to Table 2. To convert our measured mean X-ray fluxes to luminosities, we assumed a distance to M31 of 780 kpc, a photon index , and absorption cm-2. These assumptions provided a constant conversion factor of 2.5 1041 erg cm2 ct-1 from HRC flux in ct cm-2 s-1 to luminosity ( 0.1–10 keV).
We consulted previous surveys of the X-ray source background to set a limit on the number of possible background sources in our sample. ROSAT observations of the Lockman Hole (Hasinger et al., 1998) show that there are 40 sources per square degree with luminosities greater than 41036. Our large-area disk LF quickly falls off below this luminosity due to completeness (cf. §3.1). Therefore we estimate that our entire catalog contains 40 background and/or foreground sources. Near the center of M31, our data contain an area of 0.01 deg2 complete at 6 to 2.5 1036 (see the area of highest exposure near the center of M31 in Figure 1). This area should contain 100 background sources per deg2 (Hasinger et al., 1998), or 1 source in our most sensitive area, where we detect 41 sources. Therefore contamination near the galaxy center is very small.
Within the central 10 arcmin of M31, all but one of the non-transient sources in our list has been previously detected in the X-ray band. This region has been well studied with Chandra already (Kong et al., 2002a; Kaaret, 2002). Source r2-68 appears to be a clean new detection, with 19 counts and a S/N ration of 4.6. While we do not detect any variations in the HRC snapshots of this source (), the fact that it is not detected in the much deeper ACIS (Kong et al., 2002a) and 50ks HRC exposures (Kaaret, 2002) indicates it is variable. As shown in Figure 9 and discussed in §3.2, our sensitivity to variability in the fainter sources of our survey, such as r2-68, is limited.
Outside of the central region, we detect several new objects. Of the new objects, s1-76, s1-82, and n1-84 are well detected, with of 9.3, 8.4, and 4.8 respectively. These objects are all brighter than 1036 ; therefore their non-detection in the ROSAT surveys (which reached 51035 ) indicates that they could be variable on timescales as long as a decade. While we do not detect variability in these four sources between the individual HRC-I snapshots, the counting rates are low enough that variations of a factor of two may be undetected. In addition, there are several new sources that varied significantly during our survey. Among these variable sources are s1-79, which is a strong transient with a peak luminosity of 1.51038 and peak of 35, and s1-1, which is variable on year long timescales with a test for a steady source giving of 1.4 (probability = 13%).
2.3 Lightcurves
By combining the data from our fields, we were able to construct lightcurves covering more than 2 years for all of the objects we detected. Initial lightcurves for the objects were measured using the CIAO task lightcurve, which measures the number of counts in a square aperture around the detected object in each epoch. We measured source fluxes in each of the 17 epochs detailed in column 3 of Table 1. The lightcurves were measured using boxes with 0.7′′ sides within 3′′ of the nucleus where the sources are separated by only 1′′. This box size was increased to 2′′ in the central 1′, where the sources are generally separated by more than 2′′. The box size was increased to 8′′ in the central 18′ 18′ (outside of the central 1′), where the sources are generally separated by more than 8′′. Outside of this region, the sources are generally separated by over an arcminute. Because these sources are typically located farther off-axis, where the PSF is larger, we used a 16′′ box to measure them. The average radius of a circle that encloses 90% of the energy at 1.49 keV in the HRC-I is 1′′ at 1′ off-axis, 4′′ at 6′ off-axis, and 8′′ at 8′ off-axis. These box sizes therefore insured that we measured most of the source counts in off-axis areas where crowding of the sources was not an issue. The 8′′ box size typically contained only 1 background count per ks timebin, while the 16′′ boxes typically contained 4 background counts per ks timebin.
The background subtracted count rates from lightcurve were used as a starting point for our lightcurve measurement for each source. We converted the lightcurve output from units of counts to flux units using exposure maps which take into account the aspect histograms and instrumental flat field. As the instrument’s effective area depends on the source spectrum, we made the exposure maps assuming a typical M31 source spectrum of an absorbed power law with an index of 1.7 and an absorption column density of cm-2. These maps were created for each epoch of the lightcurve to measure the effective exposure for each object in each epoch individually. The lightcurve output was then converted to flux units using the effective exposure of each object in each observation. Finally, the fluxes were multiplied by our conversion factor of 2.5 1041 erg cm2 ct-1 to estimate the source luminosity. Table 2 lists the fit of each lightcurve to a constant flux at its mean value. The objects have a wide range of variability. Sources with values of greater than 1.47 are discussed as variables in §3.2. Several of those with the highest values (10) are transients, discussed in detail in §3.2 and §6.
The 2′′ box size used for the central arcmin of M31 was appropriate for measuring the lightcurves for all of the central sources except for the well-known 3 bright sources in the nucleus of the galaxy (Garcia et al., 2000a). Our wavdetect analysis detected these sources as the single (extended) source r1-9. The lightcurve of these three sources blended together is shown in the top panel of Figure 3. The combined lightcurve reveals variability of the nuclear region by a factor of 10 on timescales of about 6 months. We attempted to create 3 separate lightcurves for the 3 known objects by dividing the blended nuclear region into 3 parts. We made lightcurves for each of these parts using a boxsize of 0.7′′. While the northernmost of these three is closest to the nucleus (Garcia et al., 2001b), it is unclear if the source is associated with the central massive black hole.
The 3 lightcurves are shown in Figure 3, but the lightcurves appear to be influenced by one another, revealing the spatial limitations of our data set. Even so, we see that the part closest to the nucleus, corresponding to CXOM31 J004244.3+411608, shows the least variability. It appears as constant and faint throughout the observations. The highest level of variability among the three central sources is shown by the bright, soft source immediately to the south (CXOM31 J004244.3+411607) which was initially (and incorrectly) associated with the central black hole (Garcia et al., 2000a). The lightcurve of the source furthest to the south (CXOM31 J004244.3+411605) shows less variability but mirrors that of its neighbor to the north, suggesting that the two are not completely resolved. In addition to looking for long-term variability in the nuclear region, we were also able to look for short-term variability using the long exposure of Kaaret (2002), where 3 sources are clearly resolved. The lightcurves of the three objects showed no variability on this timescale. They all had values of less than 1 when fit to a constant flux, including the soft source which is so highly variable on longer timescales ( = 18.4).
In order to better constrain our lightcurves for the objects in the central region we used the data from Kaaret (2002) which covers 18′ 18′ about the center. This deep observation provided excellent for the November 2001 data points in our lightcurves. Objects near the center of the galaxy therefore show very small errors for their fluxes during that epoch (cf. Figure 8).
Farther out in the M31 disk, the density of bright X-ray sources is small. This low density of sources allowed larger spatial binning. This binning was especially useful in the outer parts of the HRC fields because the effective exposure is lower in these outer portions and the Chandra PSF is significantly broader on the outskirts of the field. Aside from the lower resolution, the lightcurves were measured the same way as described for the central region. The lightcurves for the variable objects in our sample are shown in Figures 8, 10, 12, and 14. These sources will be discussed further in §3.2 and §6.
2.4 ACIS Spectral Analysis of r2-67 and r3-16
In addition to our HRC analysis of the LF and variability of the X-ray sources detected in our survey, we analyzed ACIS observations of the X-ray transients r2-67 and r3-16, the two transients for which we found counterparts in our HST followup data. We applied two analysis techniques to attempt to recover the spectra of r2-67 from the ACIS observations. First, we used the pile-up model of Davis (2001) as coded in ISIS 1.0.50 (Houck & Denicola, 2000), CIAO 3.0/Sherpa (Freeman et al., 2001) and XSPEC V11.2 (Arnaud, 1996). Second, we extracted counts only from the wings of the PSF which are not piled-up due to their lower counting rates. Each technique has limitations as described in the Appendix. Fitting the spectrum of r3-16 was more straight-forward, as it was not piled-up. The spectrum was only fit using CIAO 3.0/Sherpa.
In all cases we corrected the instrumental response for the contamination build up on the ACIS detectors, and we limited our analysis to the 0.3–0.7 keV range where the background is low and the calibration is secure. Counts were grouped into bins containing 15 counts to allow standard statistics, and error ranges are 68% as determined from contours. The details of the fitting procedures are provided in the Appendix. The fitting results of r2-67 are discussed in detail in §6.3, and those of r3-16 are discussed in §6.4.
3 X-ray Results
3.1 Luminosity Functions
In order to look for differences between the disk and bulge source populations, we measured the LF of the source population within 5 arcmin of the nucleus (the bulge) and outside 7 arcmin of the nucleus (the disk). To facilitate comparisons to previous work (i.e., Kong et al., 2003b; Trudolyubov et al., 2002b; Kaaret, 2002), we excluded GCs from our disk sample, and we generated LFs for the bulge both excluding and including globular clusters within 5 arcmin of the nucleus. We also provide the globular cluster luminosity function (GCLF; cf. Figure 7). We always excluded 3 sources likely to be foreground stars and 2 sources associated with M32 (see Table 2). X-ray fluxes were converted to luminosities using the conversion described in §2.2.
The differential luminosity functions (DLFs) of the disk and bulge (cf. Fig. 4) show some interesting differences. The LFs of the bulge with and without GCs are statistically equivalent (cf. Table 3). The difference in completeness between the disk and bulge samples is evident. The bulge sample contains a large number of sources at 2.51036 , faintward of which the DLF falls off steeply, revealing the depth of the data. In the disk, the DLF falls off in a similar fashion at 41036 , reflecting the shallower depth in the disk observations. This difference in completeness is due to the variable PSF of Chandra, which is smaller in the bulge region therefore allowing fainter sources to be detected.
We created histograms for our source list, revealing a peak in the number of sources with 6 detections. We therefore consider our sample complete for detections of 6 and higher. A source near the center of the bulge with a luminosity of 2.51036 will be detected at 6, while a luminosity of 3.5 is required for a 6 detection in the disk. The increase in the Chandra PSF with off-axis angle and corresponding drop in sensitivity is somewhat mitigated by the fact that the field-of-view of the observations overlaps at the largest off-axis angles, doubling the exposure time in these regions. The detection limit is in these high exposure regions, but in nearby non-overlapping areas. In the non-overlapping areas farthest off-axis, the detection limit is . For the remainder of the analysis of the disk LF, we only considered sources with , and for the remainder of the analysis of the bulge LF, we only considered sources with .
Interestingly, the lack of disk sources with luminosities 1037 is not as pronounced as seen in the XMM survey of the northern disk (Trudolyubov et al., 2002b). While there is certainly a decrease in the number of bright sources with distance from the center of M31, our study hints at an additional, more subtle effect. The southern half of the disk contains a large fraction of the most luminous disk sources. These sources are shown in Figure 6, which shows objects with luminosities as crosses in the right panel, and objects with luminosities as circles in the center panel. The effect discovered by Trudolyubov et al. (2002b) is apparent: there are very few bright sources in the northern disk. However, the same panel shows several bright sources in the southern disk. There is also a hint of this effect in the data set of Kong et al. (2003a) who compared several regions of the disk. Their field 2, which lies in the southern disk, contains most of the bright sources in their sample as well, but this field was also located closest to the galaxy center. Of the 9 bright sources south of 41 degrees Declination, tests to a steady source find only for 3 of them; the rest have .
The cumulative luminosity functions (CLFs) of the disk and bulge are shown in Figure 5, and the results of the broken power-law fits are provided in Table 3. The bulge CLF appears qualitatively more complex than that of the disk, but it is adequately fit by a broken power-law with a break at about 7.0 1037. This break is higher than the typical values of 2.1 seen in previous surveys (e.g. Primini et al., 1993; Kong et al., 2002a). Our luminosities are 0.1–10 keV while the luminosities of those surveys were for narrower energy ranges (e.g., 0.3–7 keV; Kong et al., 2002a); our wider energy range accounts for only 40% of the discrepancy, assuming a typical spectrum (, cm-2). Our break luminosity is more easily compared to that measured by Kaaret (2002) which was measured with luminosities of the same energy range by applying the Maximum Likelihood technique to deeper (50 ks) HRC data. Our CLF break measurements agree at the 1 level with his measurement of . Our Maximum Likelihood fit broken power-law has a sharp break, with slope indices of 1.70.7 and 0.50.2 above and below the break, respectively. These values for the slopes are also consistent with those measured by Kaaret (2002). The measured values for these parameters were statistically unaffected by the presence of GCs in the sample. The fit is shown on the CLF in the bottom panel of Figure 5; this CLF contains no GCs. Monte Carlo tests show that 50% of samples taken from such a broken power-law distribution provide better fits than our sample.
The disk sample also shows a possible broken power-law consistent with previous observations (Kong et al., 2002a). A Maximum Likelihood fit to these data gives slopes of 0.60.3 below the break and 1.50.5 above the break with the break at 1037 . This fit is shown in the top panel of Figure 5. This distribution is comparable to the inner disk sample of Kong et al. (2002a). Monte Carlo tests show that 56% of samples taken from such a broken power-law distribution provide better fits than our sample. The best-fit single power law (cf. Fig. 5 top panel; Table 4) has slope 0.90.1. Monte Carlo tests show that 71% of samples taken from such a power-law distribution provide a better fit than our sample. While the broken power-law fit is better, both fits are adequate. Our most conservative CLF for the disk only includes sources brighter than 1.31037 . Above this luminosity, the entire region of our survey is complete. This sample is well-fit by a single power-law with index 1.40.2, also shown in Figure 5. Monte Carlo tests show that only 7% of samples taken from such a power-law distribution provide a better fit than our sample. This index is similar to the value of 1.30.2 found for the northern disk by Trudolyubov et al. (2002b) to a faint limit of 1036 .
The higher break luminosity, and slightly flatter CLF below the break of the bulge is consistent with the brightest sources being in the bulge. The steeper CLF in the disk was also seen by Kong et al. (2002a); however, their sample did not extend more than 9 arcmin from the galaxy center. In contrast, this disk sample contains sources from 7 to 72 arcmin from the nucleus, showing that the steep CLF extends far out into the disk and the bulge contains most of the bright sources.
Our disk CLF can be compared to that seen in the spiral galaxy NGC 6946 in a survey by Holt et al. (2003) with a similar sensitivity limit (1037 ). Their sample is clearly disk dominated, as the source distribution traces the spiral arms of the galaxy. Holt et al. (2003) found that the CLF of NGC 6946 is a well-behaved power-law with slope 0.680.03. The slope in NGC 6946 is consistent with the recent conclusion by Colbert et al. (2003), from a sample of X-ray point sources in 32 galaxies, that the CLFs in late-type spiral galaxies have slopes of 0.5–0.8. A steeper slope is seen in the M31 disk in both the large (0.90.1) and the most conservative (1.40.2) samples. The slope difference may reflect the difference in star formation rates of the galaxies, which are 4 and 1 M⊙ yr-1 in NGC 6946 (Sauty et al., 1998) and M31 (Williams, 2003b), respectively. The lower current star formation rate in the M31 disk may not replenish its short-lived, high-luminosity X-ray sources. Such a process has been shown to be responsible for steeper CLFs in X-ray population models (Kilgard et al., 2002).
It is interesting to note that the disk CLF for our most conservative sample is similar to the typical slopes found in elliptical galaxies (1.4) in the Colbert et al. (2003) sample. The only one of these early-type galaxies with a measured star formation rate is NGC 5128 (1.7 M⊙ yr-1), which has a CLF slope of 1.28. Because elliptical galaxies typically have little or no current star formation, the rate measured for NGC 5128 may be taken as an upper limit for the other early-type galaxies in the Colbert et al. (2003) sample. Then the CLF slope and star formation rate of the M31 disk are typical of what is seen in the early-type galaxies of their sample. Colbert et al. (2003) were not able to remove GC sources from their sample or break down the sources into bulge and disk populations. Ideally, we would like to compare the M31 disk-only sample to disk-only samples of more distant galaxies. Assuming that the Colbert et al. (2003) disk galaxy samples are dominated by disk sources, the slope of the X-ray CLF of the M31 disk bears a stronger resemblance to those of typical ellipticals than to those of typical spirals.
The GCLFs of our sample are shown in Figure 7. The figure shows the DLF of all GCs in the sample as well as a break-down of the sample into GCs near the center of M31 and farther out in the M31 disk. The outer GC sample contains the brightest objects in the survey. A power-law fit to the total GCLF down to 1.31037 yields a slope of 0.840.03 (cf. Table 4). Only 0.4% of 10000 Monte Carlo tests provided a better fit to this slope than our GC sample.
It should be noted that our LFs for M31 could be affected by the long baseline and short exposure times of our data set. For example, a typical transient is likely to be detected at near its peak luminosity in one (or a few) exposures, and undetected in the majority of the remaining exposures. In the extreme case where it is detected at its peak in a single exposure, and undetected in all other exposures, the mean luminosity (used in constructing the LF) is 1/17 of peak. Given that the duty cycle of transients is likely 1%, this extreme example overestimates the mean luminosity by a factor of 6. The more typical observational mode, consisting of a single long exposure, may contain only a single (or few) transient(s) at intermediate luminosity, but our survey detected over a dozen transients. This bias will be most severe for sources in the bulge, where the majority of the transients are located. To test the effect of the transients on the CLF of the bulge, we created a bulge LF with the transient sources removed. The results of a broken power-law fit to this CLF is also given in Table 3, and is consistent with the fits to bulge samples both including and excluding GCs.
3.2 Variability and Transients
Any source for which a fit to a constant source at the mean flux yields has a 90% probability of being variable in our 17 epoch survey. When fitting a model to a data set with 16 degrees of freedom (), a value of leaves a 10% chance that the model is the correct representation of the data set (see Bevington & Robinson, 2003 for details). There are 44 objects with in our sample. The lightcurves for these objects are shown in Figures 8, 10, 12, and 14. Among these 44 are 1 (r1-9) quasisoft source (QSS) and 1 (r2-12) supersoft source (SSS), as diagnosed by Di Stefano et al. (2003), and 9 transient candidate objects. There are also 8 transient sources with ; one of these (r3-115) is also a SSS.
We defined transient candidates as those objects whose luminosities reached 1.51037 for at least one epoch, but less than 6 epochs. These objects were also required to have luminosities consistent with 0 in at least 2 epochs. All of the timebins where the luminosity was consistent with 0 were combined to measure upper limits of these objects during quiescence. We also required a 1 upper limit below 2.51036 during the combined quiescent epochs. The peak luminosities and 1 upper limits of the quiescent luminosities for the transient candidates are listed in Table 5. Some of the candidates have low values due to large errors in the unbinned quiescent epochs.
A few of these transient candidates have been detected in previous surveys. Object r3-125 was detected by Primini et al. (1993) at a luminosity of 1037, but this object did not appear in ACIS observations with a detection limit of , confirming its transient nature. Objects r3-126 and n1-85 have been seen in previous surveys and are known to be repeating transients (Osborne et al., 2001; White et al., 1995). Object r3-115 has been recently identified as a supersoft source (SSS) by Di Stefano et al. (2003); this is the only transient source in our catalog corresponding to an SSS in their catalog. The position of n1-85 is coincident with a known SNR candidate. While the high variability rules out the possibility of this source being the SNR itself, the source could be associated with the SNR. Objects r1-5, r2-16, r2-3, r2-63, and r3-16 have been classified as transients in previous surveys (Kong et al., 2002a; Di Stefano et al., 2003); however, they were active too often during our survey to meet our criteria. Figure 11 shows a histogram of the number of active transients for each epoch of the survey. On average there are 21 active transients in M31 during any given epoch. A new (or recurrent) transient becomes active about once every 1–2 months.
It is interesting to note that half of our transient candidates did not fit our variability criteria, highlighting the fact that the fraction of variables we quote truly is a lower limit. This fact is made clear in Figure 9, which shows the fraction of variables, and the fractional change in flux necessary to show a 1 change, as a function of luminosity in our data set. Forty of the 44 variables had mean luminosities greater than 71036 , where a flux change of more than 40% could be detected. Half of our sources were below this luminosity. Therefore, about half of the sources for which our data set is sensitive to variability at the 40% level ( 71036 ) are variable. It is entirely possible that half of the sources with mean luminosities 71036 are also variable at the 40% level.
The X-ray transient population of M31 is discussed in further detail in §6, including a discussion of the X-ray spectral properties of 2 X-ray transient sources, r2-67 and r3-16, as measured with ACIS.
4 Optical Observations
During the course of our survey, wide-field data from the Local Group Survey (LGS) covering most of the M31 disk became available (Massey et al., 2001). In addition, new optical data were obtained by HST through coordinated observations to search for optical counterparts of five new bright X-ray transient events. We report on the detection of 2 counterparts in §6.3 and §6.4, and will report on the 3 non-detections in a future paper. In this section we detail our analyses of the LGS and HST data and report the results of our search for potential optical counterparts to all the HRC X-ray sources.
4.1 Local Group Survey Data
New optical data used for this project were generously supplied by the
CTIO/KPNO Local Group Survey (LGS) collaboration
(Massey
et al., 2001;
http://www.lowell.edu/users/massey/lgsurvey)
which is acquiring 1 arcsec resolution, photometric data with the 8 k
8 k Mosaic cameras on the 4-m telescopes at KPNO and CTIO,
entirely covering ten local group galaxies in , and narrow-band
H, [S II] (6717, 6731) and [O III]
(5007). The LGS is working on their own, more rigorous,
calibration of these data leading towards a complete catalog
of stars. However, for the purposes of this paper, we have simply
used photometry from the literature to perform a rough calibration.
The analysis used in this paper is described in full detail, including
tests of the photometry routine, in Williams (2003a). In short,
the data consisted of 7 fields from the MOSAIC camera on the KPNO 4-m
telescope. Observation dates are shown along with the HST observation
dates in Tables 7 and 8. These fields cover
most of the active portions of the M31 disk, but do not cover the
bulge. In order to look for bright, blue stellar counterparts to the
X-ray sources, the Johnson and broadband images were analyzed.
The dithered frames in each filter were stacked and reduced using the
DAOPHOT II and ALLSTAR packages (Stetson
et al., 1990), and the zero points
for each field were determined using published photometry from
previous surveys of Mochejska
et al. (2001) and Magnier
et al. (1992).
4.2 HST Data
Optical data for the X-ray transients r2-67 and r3-16 were obtained within weeks of the X-ray outbursts through the F336W (-band equivalent) filter of the WFPC2 camera aboard the Hubble Space Telescope (HST). Eight exposures of 500 seconds each were taken at 3 separate visits for each of the 2 fields observed. Observation dates and exposure times are listed in Tables 7 and 8. These 8 images from each visit were analyzed using the automated photometry package HSTPHOT (Dolphin, 2000), which is optimized for the processing and photometric measurement of undersampled CCD images like those of WFPC2. The package masks out all known bad pixels in the field as well as hot pixels flagged by their deviations from the measured HST PSF. The images are then corrected for minor misalignments between exposures and combined. The combined images are searched for all source detections with a greater than 4. The quality of the PSF fit to each source is measured to distinguish blends, and the WFPC2 magnitudes are measured by correcting for the charge transfer efficiency and applying the photometric calibration of Holtzman et al. (1995).
We applied this analysis method to the 8 exposures from the 3 different epochs for each transient observed. The combined final images of each epoch for each object are shown in Figure 13. The detections of the UV counterparts of the X-ray transients via HSTPHOT was therefore objective and provided the F336W (-band equivalent) magnitudes and errors listed in Tables 7 and 8. The implications of these measurements are discussed in §6.3 and §6.4.
5 Optical Results
5.1 Literature Counterparts
The range in optical magnitudes to be expected for counterparts of X-ray sources in M31 can be estimated by scaling the optical magnitudes of the counterparts of Galactic sources. Galactic high-mass X-ray binaries (HMXBs) typically contain stars of spectral type O8–B3 (Liu et al., 2001). These stars have -5MV-2, or 19.822.8 when scaled to the distance (780 kpc) and reddening () of M31. Galactic low-mass X-ray binaries (LMXBs) typically have -5MV5 (van Paradijs & McClintock, 1994), or 19.829.8 when scaled to M31. These estimates suggest that we may find optical counterparts for HMXBs and bright LMXBs by searching currently available wide-field surveys, which go to a depth of (e.g. Mochejska et al., 2001; Williams, 2003b) outside of the bulge. Only 17 stellar counterpart candidates have been found for our sample. The small number of high-mass stellar counterparts in the disk is consistent with the disk XLF, which suggests that the M31 disk contains very few young bright X-ray sources (cf. §3.1). Only such young sources are likely to have short-lived, high-mass stellar companions. The small number of optical counterpart candidates found in the bulge is consistent with the effects of crowding in ground-based surveys of the bulge, which limit the depth to (see upper limits for bulge sources in Table 6). Finding counterparts for most X-ray binaries in the bulge will require deeper, higher resolution, optical data.
Some HMXBs are transient X-ray sources. The broad-band optical flux of these objects is dominated by the high-mass donor star and varies by 0.4 mag (e.g. Larionov et al., 2001; Negueruela et al., 2001; Pigulski et al., 2001). Even this low-amplitude variability in the broad-band optical flux may not be correlated with the variability of the X-ray flux (e.g. Negueruela, 1998; Clark et al., 1999; Larionov et al., 2001). The optical magnitudes of these sources are therefore given by the magnitudes of the high-mass companions, which are typically Be stars with spectral type O8.5–B2 (Negueruela, 1998). These stars have optical magnitudes of -4.8MV-2.4, or 20.022.4 when scaled to M31.
Some LMXBs are transient X-ray sources. V404 Cyg, one of the most optically luminous Galactic X-ray transients, had an outburst with =12.7, , and a reddening of (Liu et al., 2001) at a distance of 3 kpc (Casares et al., 1993; Shahbaz et al., 1994). Scaling to M31, we would expect =22.4, =22.7, and =22.1. An example of an optically fainter Galactic X-ray transient LMXB is the short-period system A0620-00. Such short-period systems are less luminous than long-period systems such as V404 Cyg (van Paradijs & McClintock, 1994). The outburst of A0620-00 had =11.2, , and (Liu et al., 2001) at a 1.2 kpc distance (Gelino et al., 2001). Scaling to M31, we would expect =23.4, =24.3, and =24.4. Assuming these two Galactic examples bracket the typical optical luminosity range for X-ray outbursts in LMXBs, the expected range in the visual magnitude of LMXBs in outburst in M31 is 22.124.4. While bright low-mass transients should be detectable in outburst, they are 5 mag fainter, and therefore undetectable, in quiescence.
In addition, typical GCs in M31 have magnitudes of 15–19 (Barmby et al., 2001), so that GC counterparts are easily identified. There are also numerous catalogs of emission line sources in M31 that include potentially X-ray bright objects, such as supernova remnants. Some of these optical counterparts may also be identified by cross-correlating the positions in the optical catalogs with the X-ray source positions.
We searched the literature for previous detections of our sources in X-rays and at longer wavelengths. The vast majority of these sources have no known counterparts at longer wavelengths, as has historically been the case for X-ray sources in M31. All but 7 of these sources have been previously detected in X-rays while only 55 (out of 166) of them have been detected outside the X-ray band. Twenty-six of these are known GCs. Seventeen are stars from recent ground-based broad band surveys and the Local Group Survey (cf. §5.2). One is a radio source classified as a BL Lac candidate. Three are coincident with SNR candidates. One more is a radio source likely to be an SNR. Six are classified as planetary nebulae (PNe), but are more likely SNR since they are X-ray bright, and one is an emission line object of unknown nature that is optically bright. Shifting our X-ray positions by 14′′ and applying an identical search for counterparts yields 0 globular clusters, 3 stars, 3 PNe, and 0 SNRs. The 14′′ shift was larger than the PSF to avoid any real counterparts, but was not so large as to change the surface density of M31 objects. The number of counterparts found for the shifted positions therefore indicates the expected number of random coincidences between X-ray and optical sources in our sample.
In some cases, the variability of an object was helpful for determining the validity of possible counterparts. For example, r1-15 and r1-2 have coordinates consistent with the coordinates of planetary nebulae Ford 17 and Ford 13 respectively. On the other hand, these sources are unlikely to be planetary nebulae because they are luminous ( ), and they are unlikely to be SNRs because they are significantly variable. These sources are therefore more mysterious in origin than we may have suspected in the absence of the long-term variability information. Four other objects r1-24, r1-23, r1-26, r3-7 are likely to be SNRs since they have been classified as PNe and also have constant strong X-ray flux.
5.2 Local Group Survey Counterparts
By comparing our X-ray positions to optical data from the Local Group Survey (LGS) obtained with the MOSAIC camera on the KPNO 4-m at 1′′ resolution (Massey et al., 2001; Williams, 2003a), we were able to find several new optical counterpart candidates. These candidates are listed in Table 6. The regions currently surveyed include 75% of the disk, but very little of the bulge, where most of the bright X-ray sources lie. Crowding in ground-based images of the M31 bulge severely limits searches for counterparts, so that comparisons to future LGS data from the bulge is unlikely to yield many new counterparts.
Four of these new candidates have appropriate colors and magnitudes to be foreground stars (s1-74,s1-45,n1-82,n1-59). Typically, Galactic foreground stars in the direction of M31 have colors of with the highest number having colors of (Hodge et al., 1988). Many M31 stars have these colors as well, so that the only way to be sure a star redder than is in M31 is with spectroscopy. Because such spectra are not available to us, we assume the stars most likely to be foreground are bright red stars (, V18). Of these foreground candidates, objects s1-74 and n1-82 were too faint to obtain a reliable measurement of variability, and s1-45 is unlikely to be variable, with a value of 1.25. Object n1-59 is especially interesting, as it is a transient candidate.
On the other hand, there were also 11 counterparts with colors and magnitudes typical of M31 upper main sequence or giant stars (s1-75, s1-78, s1-64, r3-28, r2-8, r2-67, r3-115, r3-16, r3-13, r3-7, n1-81). Object s1-75 is associated with a BL Lac candidate. Objects r2-8, and r3-115 have colors appropriate for M31 red giants. The X-ray transients r2-67 and r3-16 are discussed in detail in §6.3 and §6.4. Objects s1-78, s1-64, r3-28, r3-13, r3-7 and n1-81 have the colors and magnitudes of evolved and/or reddened M31 upper main sequence stars. The counterpart candidates most likely to be in M31 are those with B-V0.4 (s1-64, r3-28, r3-13 and r3-7). Although these candidates are all slightly 1′′ from their possible X-ray counterparts, their X-ray positions have errors (given by wavdetect) of 0.6′′, 0.5′′, 0.5′′, and 0.4′′ respectively, and the LGS coordinates are accurate to about 1′′, allowing the possibility that these are the true optical counterparts The majority of these possible stellar counterparts have too few X-ray photons per 1 ks exposure to generate meaningful lightcurves, but s1-75, s1-64, and n1-59 are brighter. The X-ray lightcurves for these 3 are shown in Figure 12. Tests to a constant source find , and 0.68 for s1-75, s1-64, and n1-59 respectively. Variability is therefore detected only in s1-75, the known BL Lac candidate.
There were also several X-ray sources in regions observed by the LGS that did not correspond to any point sources in the LGS optical images. For these objects, we obtained lower limits for their band magnitudes by measuring the completeness of the area of interest as a function of magnitude. The lower limit was chosen as the V magnitude where the mean completeness of the LGS data fell below 50%. These limits are provided in Table 6.
6 X-ray Transients
6.1 The X-ray Transient Population
X-ray transient sources located in the bulge (within 7′ of the nucleus) are labeled with a (B) in Table 5. These are likely to be LMXB transients because most stellar population and interstellar medium studies of the M31 bulge suggest that it is dominated by old stars and contains very few, if any, young stars (e.g. Stephens et al., 2003; Davidge, 2001; Brown et al., 1998; van den Bergh, 1991). Indeed, the central 44′′ contains no stars earlier than B5 (King et al., 1992), and only an upper-limit to the star formation rate of the bulge has been measured from the far-UV luminosity (; Deharveng et al., 1982). In addition, with deep HRC imaging taken during the outburst of r2-67, Kaaret (2002) found no evidence for the existence of X-ray pulsars in the M31 bulge, suggesting it lacks HMXBs.
While the possibility of a high mass secondary in the bulge is low, it is not zero. The bulge is extremely crowded, and the highest resolution surveys have not covered the entire region or analyzed spectra of all bright blue stars. In addition, the discovery of molecular clouds (Melchior et al., 2000) and supernova remnants (Kong et al., 2003b; Sjouwerman & Dickel, 2001) in the M31 bulge allow the possibility for some recent star formation. The LGS optical counterpart candidates for r2-8, r2-67 and r3-115 have absolute magnitudes (neglecting absorption) of M and , respectively, consistent with high mass (e.g., Be binary) counterparts. The colors measured for these objects from the ground-based data are not completely reliable, as the and observations were separated by nearly 1 year and Be stars are typically variable (Pigulski et al., 2001). However, we note that apart from times of major outbursts, the scale of variability is small so that these colors should be reasonable estimates. In addition, the ground-based data are very crowded in these regions which often causes the optical luminosity to be over-estimated.
Within the disk the star formation rate is higher and there are numerous high mass stars, so transients within the disk may have high mass secondaries. HMXB transients often contain Be secondaries and pulsing neutron star primaries (Tanaka & Shibazaki, 1996), and are therefore called Be transients. Only one optical counterpart was found for a disk transient: n1-59 in the northern disk. This source has a very bright optical counterpart candidate, . If this object is indeed the optical counterpart and the source is in M31, then M (or even brighter if we include the likely 1 mag of reddening), which makes it at least as bright as an early O star. Be stars typically have spectral types between O8.5–B2 (Negueruela, 1998) and optical magnitudes of M (Cox, 2000). The counterpart candidate for n1-59 is therefore likely a foreground object.
6.2 Ratio of Black Hole to Neutron Star X-ray Binaries
The relative numbers of X-ray binaries containing black hole vs. neutron star primaries within the M31 bulge may be estimated from the relative numbers of transients vs. persistent sources. We follow the same argument that has been used to estimate this ratio within the Galaxy (Verbunt & van den Heuvel, 1995; Portegies Zwart et al., 1997).
The argument goes as follows. Within the bulge, the binary population is dominated by low-mass (1 ) systems because the secondaries are old. Within the Galaxy, persistent LMXBs are observed to often contain neutron star primaries. On the other hand, a large fraction of the transient low-mass systems are observed to contain black hole (BH) primaries (Charles, 1998). The duty cycle of these transient black hole X-ray novae (BHXNe) is believed to be 1% (Tanaka & Lewin, 1995). Thus the ratio of persistent to transient sources, divided by the duty cycle of the transients, yields an estimate of the ratio of number of neutron star containing LMXBs to the number of black hole containing LMXBs. Within the Galaxy, it appears that there are approximately equal numbers of neutron star and black hole containing LMXBs. This result is surprising, as evolutionary calculations predict that neutron star containing systems should be 100 times more common than those containing black holes (Portegies Zwart et al., 1997).
Within the bulge of M31, there are 100 persistent LMXBs. In any individual snapshot, there is on average 1 new bright transient within the bulge (e.g., Figure 11). The majority of these are detected in more than one snapshot, and therefore have decay times consistent with BHXNe (Chen et al., 1997). If the duty cycles of the BHXNe in M31 are the same as in the Galaxy (and there is no reason to suspect otherwise), then the problem observed in the Galaxy is also seen in the M31 bulge: the number of black hole containing LMXBs is approximately equal to the number of neutron star containing LMXBs.
6.3 X-ray Transient r2-67
6.3.1 ACIS Observations
Source r2-67 was observed several times with the ACIS detectors. Herein, we limit our discussion of the spectra to OBSID 1585 and OBSID 2897. Spectral analysis of these observations was performed to estimate the X-ray luminosity of this transient, as well as its optical extinction. These values were critical to our determination of its orbital period. The other ACIS detections will be discussed in detail in future publications. Given the long decay time of this transient, the X-ray luminosity from OBSID 1585 is close enough in time to the measurement of the optical luminosity from HST that the luminosities can be used in the correlation of van Paradijs & McClintock (1994). Analysis of this observation is complicated because the source was bright and piled-up (cf. Appendix). During OBSIB 2897 the transient had faded and pileup was negligible. When the transient is faint, spectral fitting is more straightforward, but given the possibility that the spectrum may be time variable, it is desirable to measure it contemporaneously with the HST -band measurements.
6.3.2 OBSID 1585
The counting rate during 2001 Nov. 19 (OBSID 1585), at 0.18 , was high enough to give a pileup fraction of 30% (as fit by Sherpa and ISIS). In order to apply the pileup model, we follow the prescription as described by Davis (2001, 2003). As this method is relatively new, we include a detailed discussion of our use of it in the Appendix. ISIS quickly converges to a pileup model with a grade migration parameter , with a fixed PSF fraction of 0.95.
Using these pileup parameters, we fit an absorbed disk blackbody model to the spectrum. The best fit absorption value was cm-2, corresponding to (Predehl & Schmitt, 1995) and for a standard extinction law with R (Cox, 2000). The best fit disk parameters were keV and , where is the temperature of the inner edge of the accretion disk, is the normalization parameter, is the distance to the source, and is the inclination angle of the disk. Assuming a distance of 780 kpc, provides a lower limit to the radius of the inner edge of the accretion disk, km. These parameters provide a fit with = 1.2 (probability=0.2). The observed flux is 1.3 10-12 (0.3-7.0 keV), and the modeled emitted luminosity is (0.3-7.0 keV). The km corresponds to for a 10 black hole, and for the best fit values assuming cos() = 1. These are reasonable values for an accretion disk around a 10 solar mass black hole during this bright stage of the outburst.
6.3.3 OBSID 2897
By 2002 Jan. 8, the flux had decayed sufficiently that pileup was no longer a problem. We extracted 177 counts from a radius, and found that a simple power-law with ISM absorption models fit the data well (). The observed 0.3–7.0 keV flux was , and the modeled emitted 0.3–7.0 keV luminosity at 780 kpc was . The best fit value of cm2 is consistent with that due to the Galaxy alone, and corresponds to (Predehl & Schmitt, 1995) and for a standard extinction law with R (Cox, 2000). This measurement is consistent with the measurement from OBSID 1585 of cm2. When the two measurements are combined, the best estimate of the absorption to r2-67 is cm2, which corresponds to .
We note that the best fit slope is substantially harder than that found when the source was bright (see Appendix for a power-law fit to the bright state data). The harder slope is consistent with the source having entered the ‘low-hard’ or ‘intermediate’ state from the ‘high-soft’ state in OBSID 1585 (Esin et al., 1997). As these transitions are believed to occur at luminosities between 10% and a few % of Eddington, this transition is consistent with the source having a mass of 10 M⊙.
6.3.4 Counterparts for r2-67
Two HST observations taken 1 month apart, both when the X-ray source was bright, reveal a -band source with F336W = 22.30.1 mag. A third observation several months later, when the X-ray source was faint, did not detect the counterpart and set a limit of F336W 22.8 mag. The disappearance of the optical counterpart in concert with the X-ray decline confirms this identification of the optical counterpart of the X-ray transient. The observations are shown in Figures 13 and 14 and summarized in Table 7.
Fortuitously, most of the HST images contained an X-ray bright GC, which we used to register with our Chandra-HRC mosaic to the HST images. X-ray position errors were estimated by dividing the full-width at half maximum (FWHM) of the X-ray source, as measured with the IRAF111IRAF is distributed by the National Optical Astronomy Observatory, which is operated by the Association of Universities for Research in Astronomy, Inc., under cooperative agreement with the National Science Foundation. task imexamine, by the square-root of the number of counts in the X-ray detection. The final position errors were dominated by the X-ray position errors; the optical position errors were always 0.1′′. The first 2 HST observations of r2-67 were aligned with our X-ray image using the GC Bol 148. The final HST observation of r2-67 was aligned using GC Bol 144. Our Chandra positions of the GC sources had errors of 0.15′′ and 0.08′′, respectively, and the X-ray position of the r2-67 had an error of 0.2′′. Therefore, in Figure 13, the 0.8′′ error circles marked on the first two HST images of r2-67, and the 0.6′′ error circle marked on the third HST image of r2-67, show the 3 position errors of our data.
Interestingly, a candidate was also found in the LGS data for r2-67. This candidate has =22.30.3 and =21.90.1. The counterpart for r2-67 seen from the ground was particularly unexpected because the -band images were taken October 6, 2000, when the X-ray source was quiescent, and the -band images were taken September 18, 2001, a few months before we detected the transient but during a 3 month gap in our X-ray monitoring. The LGS object may be the counterpart or a chance superposition of a different star along the line of sight, while the -band transient seen by HST is clearly the optical glow of the X-ray nova. The magnitude of the LGS star from the ground is likely a lower limit as crowding often causes the brightness to be overestimated.
The apparently persistent nature of the LGS candidate (i.e. it was detected when we believe the X-ray source was dim) and the clear transient nature of the HST counterpart calls into question the validity of the LGS candidate. However, the LGS candidate is well-detected in the -band, with of 9, but the detection is less robust in the -band, with of 4. The X-ray source is not a pulsar (Kaaret, 2002) and is therefore unlikely to have a high-mass (Be) companion which would be persistent optically. While the LGS and on-state HST magnitudes are approximately equal to those expected for a slightly evolved B3 star in M31 with , such an object would have been detected in all 3 HST observations. The LGS photometry allows the possibility that this optical detection is an interloping foreground main-sequence star with F336W 22.8 mag and . This possibility offers the simplest explanation for the candidate’s non-detection in the third HST image. The detection of this counterpart candidate in the LGS data underscores the confusion that crowding causes in ground-based images of the M31 bulge.
6.3.5 Determination of the Orbital Period
It is possible to estimate the orbital period for the transient using the period dependence within the correlation between X-ray and optical luminosity found by van Paradijs & McClintock (1994). In order to do so, estimates of the X-ray luminosity and the -band absolute magnitude are needed. While the former were directly available from the HRC and ACIS observations, the latter were estimated from the HST (F336W) measurements and corrected for the interstellar absorption to the transient, as estimated from the ACIS data (cf. §6.1) and converted to using the correlation between between and (i.e., Predehl & Schmitt, 1995).
Plugging the contemporaneous optical and X-ray luminosities into the van Paradijs & McClintock (1994) relation we can estimate the orbital period of r2-67. The indicated by combining our X-ray measurements of the absorption toward r2-67 (cf. §6.3.3) is . This implies an absolute M. We assume an intrinsic , typical for observations for LMXBs in the Galaxy (Liu et al., 2001). These assumptions supply an estimate for M. Along with the observed , this MV implies an orbital period days. This is not unreasonable compared to BHXNe within the Galaxy. For example V404 Cyg has days (Orosz, 2002), and GRS1915+105 has days (Greiner et al., 2001).
6.3.6 Disk Decay Time Determination of the Orbital Period
A second way to estimate the orbital period is from the decay time of the outburst. King & Ritter (1998) developed a model for the outburst of BHXNe disks, assuming that irradiation determines the disk temperature profile during the outburst and that the outburst cannot end until the irradiation allows the outer edge of the disk to cool below the hydrogen recombination temperature. This model predicts longer decay times for larger disks and approximately linear decay curves for systems with orbital periods longer than 1 day. Shorter orbital period systems are predicted to produce exponential decay curves. While the data herein do not constrain the shape of the lightcurve (cf. Fig. 14), they do provide a decay time estimate of 0.2 yr.
Equation 23 of King & Ritter (1998) describes the time variable mass transfer rate for such a large disk in outburst. Assuming , where is the central accretion rate and is the accretion efficiency (0.1) allows us to re-write this as
where is the disk-averaged kinetic viscosity, the constant (cgs units), is the mass of the hot zone and is the time in seconds after the start of the outburst decay.
Applying our observation that when to equation (1) allows us to write
Using the value in equation (2) as the first term in equation (1), applying our observation of the decay time of years, and assuming that the luminosity is 0 at this point (justified since it is at years) lets us write
Equation (3) lets us determine the viscosity, cm2 s, a value characteristic of the large disk implied by the day period. The Shakura & Sunyaev (1973) alpha-prescription states that
where is the angular momentum transport efficiency and is the disk thickness. In the thin disk approximation, (see Frank et al., 1992, p. 74). Assuming , the outer disk radius, where the disk cools below the ionization temperature, has the value of
where is the BH mass in 10 units, and is the local disk temperature in units of K. This is consistent with the binary separation,
calculated from the day period with Kepler’s law. The similarity of these values suggests that, in addition to the ratio, the outburst decay time is also consistent with that of a BHXN with a day orbital period.
6.4 X-ray Transient r3-16
Another highly variable source, r3-16, whose lightcurve is also shown in Figure 14, has a bright UV counterpart of unknown nature. HST images of the optical counterpart during 3 epochs are provided in Figure 13. The second and third HST observations of source r3-16 were aligned with our X-ray mosaic using the GC Bol 148. The error on the X-ray position of r3-16 was 0.4′′, and that of Bol 148 was 0.15′′. The 3 error circle for this source was therefore 1.3′′, and it is shown in Figure 13. The first HST observation of r3-16 did not contain any X-ray bright GC sources. For this observation, we had to rely on the original coordinate system assigned by the HST pipeline for our alignment. We added 1′′ to the radius of our error circle in this case to account for uncertainty in the registration between the Chandra and HST coordinates. Therefore, the error circle in the first image has a 2.3′′ radius. The F336W magnitudes from HST observations and magnitudes from ground-based observations are provided in Table 8. The first 2 HST observations were taken near the peak of the X-ray outburst, and the third during the decline. The HST F336W magnitudes are 21 and appear variable, while the LGS data yield =19.10.1 and =18.80.1.
Discerning the nature of object r3-16 is difficult without any high-quality optical spectral information. The object was classified as an emission line object of unknown nature by Wirth et al. (1985). However, the X-ray spectrum and optical size of the object provide some new hints about its nature. We extracted the spectrum from a January 8, 2002 ACIS observation (OBSID 2897) and found that it is well fit with an absorbed power-law with = 1.80.8 1021 cm-2 and slope (, probability = 74%).
Fits of the radial profile of r3-16’s optical counterpart candidate in the HST images to the HST PSF (described in detail in Dolphin, 2000) yield for all observations. This statistic is normalized to have a median value of 1 for single stars. In addition, sharpness measurements for the object all 3 epochs yield values . Tests of the HSTPHOT software suggest normal stars have and sharpness between -0.3 and 0.3 (Dolphin, 2000). These measurements suggest that the object is extended; such and sharpness values are typical of unresolved binaries. On the PC chip of WFPC2, where we measure 7 point sources to have a FWHM of 0.100.01′′, r3-16 has a FWHM of 0.230.01′′, implying an intrinsic size of 0.210.02′′ or 0.820.08 parsec if located in M31. An independent measurement on the WF3 chip, where 10 point sources have a FWHM of 0.180.04′′, has a FWHM of 0.390.03′′, implying an intrinsic size of 0.350.05′′, about 50% larger than the result from the PC. The width of the the same object in the LGS ground based -band images, where we measure 10 nearby point sources to have a FWHM of 1.150.15′′, is 1.530.10′′, implying an intrinsic width of the object of 1.010.18′′ or 3.90.7 parsec if located in M31.
The discrepancies between the implied sizes of the object in ground-based and HST images are difficult to reconcile. The larger size, like the brighter magnitude, measured in the ground-based images may be due to crowding in the M31 bulge. In any case, the object is not likely to be a single star, though it may be a blended foreground binary with a separation of 0.01 pc. The X-ray spectrum, optical size, brightness, variability and emission line properties of r3-16 allow the possibility that it is a background active galactic nucleus (AGN). Such AGN have been seen through several other Local Group galaxies at optical magnitudes similar to those measured for r3-16 (e.g., Tinney et al., 1997). This possibility is also consistent with the measured which is higher than the Galactic value to M31 of cm-2 , as the light of a background AGN would be heavily absorbed by M31. The increase in apparent angular size with increasing pixel size would then be a result of integrating more diffuse emission in the larger pixels.
Alternatively, r3-16 could be a CV at a distance of 1 kpc. This possibility is consistent with the optical brightness and colors. The X-ray luminosity would then be 1032 during the outburst, and 1030 during quiescence. This range is typical of that seen in CVs (Patterson & Raymond, 1985, Warner, 1995). The 0.3 mag drop in the -band along with the drop in the X-ray flux does not argue for nor against the CV hypothesis, as the expected relation between this relatively small (for a CV outburst) -band change and the X-ray flux is unclear. The ACIS spectrum measured during outburst is harder than that typically seen in CVs in outburst (Warner, 1995), but there are some CVs which show hard spectra during outburst (Silber et al., 1994). The ACIS spectrum also shows absorption above the value expected from the Galaxy alone, which may be somewhat unusual but not unheard of for CVs. The 1 kpc distance should be taken as an upper limit because, at the galactic latitude of M31 (), an object at that distance would be 360 pc below the Galactic plane, which is at the extreme range for CVs (Warner, 1995, Section 9.5). If r3-16 is a CV, the extended, persistent optical emission could be a nova shell from an earlier (unseen) nova eruption of this CV. Similar to the images of r3-16, many nova remnants are only slightly extended in ground-based and HST images (Gill & O’Brien, 2000, 1998). A high quality optical spectrum could uncover the true nature of this source.
7 Conclusions
We have combined 17 epochs of snapshot observations covering most of the M31 disk with the Chandra-HRC. These data have provided detections of 166 discrete X-ray sources. All but 7 of these have been previously detected. Comparison of the LF of the bulge sources to that of the disk sources reveals significant differences in shape. The slope of the disk LF is comparable to that of elliptical galaxies. This similarity is consistent with the link between star formation rate and LF slope, as the star formation rate in the M31 disk is rather low. Analysis of the spatial distribution of sources shows that most of the brightest sources in the disk lie in the southwestern half of the disk.
We have found candidate counterparts for 55 of the 166 sources at longer wavelengths in previous surveys. These counterparts come in a variety of types, including SNRs, globular clusters, stars and an extended optical source of unknown nature. Fifteen stellar counterpart candidates were detected in recent wide-field M31 data taken by the Local Group Survey (Massey et al., 2001). Counterparts were detected for 2 X-ray transients using data from HST. Analysis of one counterpart (r2-67) found it to be an optical transient. The properties of this system are consistent with a BHXN in M31. The ratio of the optical to X-ray flux yields an estimate of the period of this system of days. This period is consistent with the X-ray decline rate. The optical properties of the other transient (r3-16) are difficult to understand, but it may be a foreground blend, a CV with an associated nova remnant, or a background AGN.
The long-term lightcurves of these sources suggest that at least 44 of them varied significantly over the course of these observations, which cover a baseline of about 2.5 years. From the lightcurves, we have selected 17 good transient candidates, and we have determined that at any given time there are 21 active X-ray transients in M31. The frequency of occurrence for these bright transient events suggests that 1% of the bright X-ray sources in the M31 bulge are new transients. If these sources are black hole containing LMXBs with duty cycles of 1%, the ratio of black hole to neutron star primaries in LMXBs in M31 is 1, comparable to the ratio seen in the Galaxy but greater than expectations from evolutionary calculations.
Finally, it is unfortunate that we have been unsuccessful at finding counterparts for more than 100 sources. Many of these counterparts are located in the extremely crowded bulge and will require very high angular resolution optical data to recover. These objects are likely to be faint in the optical (V20), and they may be heavily absorbed. Currently undetected counterparts in the disk are likely even fainter or heavily absorbed. Spectral X-ray data of the disk, unavailable with the HRC data, will help to discern whether intrinsic faintness or absorption are the cause for the lack of detection of counterparts at longer wavelengths.
We thank Phil Kaaret for allowing us the use of his 50 ks observation of the M31 nucleus to help constrain our lightcurves in that region and for helping to measure the model fits. We thank the LGS team (Massey et al., 2001) for supplying the optical data to search for new optical counterparts for the X-ray sources. Support for this work was provided by NASA through grant number GO-9087 from the Space Telescope Science Institute and through grant number GO-3103X from the Chandra X-ray Center. MRG acknowledges support from NASA LTSA grant NAG5-10889. Finally we thank our referee, Phil Charles, for his many helpful and insightful comments which greatly helped to improve this paper.
References
- Arnaud (1996) Arnaud, K. A. 1996, in ASP Conf. Ser. 101: Astronomical Data Analysis Software and Systems V, 17
- Barmby et al. (2001) Barmby, P., Huchra, J. P., & Brodie, J. P. 2001, AJ, 121, 1482
- Barnard et al. (2003) Barnard, R., Osborne, J. P., Kolb, U., & Borozdin, K. N. 2003, A&A, 405, 505
- Battistini et al. (1987) Battistini, P., Bonoli, F., Braccesi, A., Federici, L., Fusi Pecci, F., Marano, B., & Borngen, F. 1987, A&AS, 67, 447
- Bevington & Robinson (2003) Bevington, P. R., & Robinson, D. K. 2003, Data reduction and error analysis for the physical sciences (Data reduction and error analysis for the physical sciences, 3rd ed., by Philip R. Bevington, and Keith D. Robinson. Boston, MA: McGraw-Hill, ISBN 0071199268, 2003.)
- Braun (1990) Braun, R. 1990, ApJS, 72, 755
- Brown et al. (2000) Brown, T. M., Bowers, C. W., Kimble, R. A., Sweigart, A. V., & Ferguson, H. C. 2000, ApJ, 532, 308
- Brown et al. (1998) Brown, T. M., Ferguson, H. C., Stanford, S. A., & Deharveng, J. 1998, ApJ, 504, 113
- Casares et al. (1993) Casares, J., Charles, P. A., Naylor, T., & Pavlenko, E. P. 1993, MNRAS, 265, 834
- Charles (1998) Charles, P. 1998, in Theory of Black Hole Accretion Disks, 1
- Chen et al. (1997) Chen, W., Shrader, C. R., & Livio, M. 1997, ApJ, 491, 312
- Clark et al. (1999) Clark, J. S., et al. 1999, MNRAS, 302, 167
- Colbert et al. (2003) Colbert, E., Heckman, T., Ptak, A., & Strickland, D. 2003, ApJ, submitted
- Collura et al. (1990) Collura, A., Reale, F., & Peres, G. 1990, ApJ, 356, 119
- Cox (2000) Cox, A. N. 2000, Allen’s astrophysical quantities (Allen’s astrophysical quantities, 4th ed. Publisher: New York: AIP Press; Springer, 2000. Editedy by Arthur N. Cox. ISBN: 0387987460)
- Davidge (2001) Davidge, T. J. 2001, AJ, 122, 1386
- Davis (2001) Davis, J. E. 2001, ApJ, 562, 575
- Davis (2003) Davis, J. E. 2003, “Talk at the HEAD 2002 meeting”, http://space.mit.edu/CXC/analysis/davis/head2002/
- de Vaucouleurs & Corwin (1985) de Vaucouleurs, G., & Corwin, H. G. 1985, ApJ, 295, 287
- Deharveng et al. (1982) Deharveng, J. M., Joubert, M., Donas, J., & Monnet, G. 1982, A&A, 106, 16
- Di Stefano et al. (2002) Di Stefano, R., Kong, A. K. H., Garcia, M. R., Barmby, P., Greiner, J., Murray, S. S., & Primini, F. A. 2002, ApJ, 570, 618
- Di Stefano et al. (2003) Di Stefano, R., et al. 2003, ApJ, submitted (astro-ph/0306440)
- Dodorico et al. (1980) Dodorico, S., Dopita, M. A., & Benvenuti, P. 1980, A&AS, 40, 67
- Dolphin (2000) Dolphin, A. E. 2000, PASP, 112, 1383
- Esin et al. (1997) Esin, A. A., McClintock, J. E., & Narayan, R. 1997, ApJ, 489, 865
- Ford & Jacoby (1978) Ford, H. C., & Jacoby, G. H. 1978, ApJ, 219, 437
- Frank et al. (1992) Frank, J., King, A. R., & Raine, D. J. 1992, Accretion power in astrophysics and Derek Raine. (Cambridge [England] ; New York, NY, USA : Cambridge University Press, 1992. 2nd ed.), F73
- Freeman et al. (2001) Freeman, P., Doe, S., & Siemiginowska, A. 2001, in Proc. SPIE Vol. 4477, p. 76-87, Astronomical Data Analysis, Jean-Luc Starck; Fionn D. Murtagh; Eds., 76
- Garcia et al. (2001a) Garcia, M., Kong, A., Primini, F., McClintock, J., Murray, S., & Di Stefano, R. 2001a, The Astronomer’s Telegram, 79, 1
- Garcia et al. (2001b) Garcia, M. R., Kong, A., Primini, F. A., Barmby, P., Di Stefano, R., McClintock, J. E., & Murray, S. S. 2001b, in Two Years of Science with Chandra, Abstracts from the Symposium held in Washington, DC, 5-7 September, 2001.
- Garcia et al. (2002) Garcia, M. R., Kong, A. K. H., McClintock, J. E., Primini, F. A., Murray, P. K., & Murray, S. S. 2002, The Astronomer’s Telegram, 82, 1
- Garcia et al. (2000a) Garcia, M. R., Murray, S. S., Primini, F. A., Forman, W. R., McClintock, J. E., & Jones, C. 2000a, ApJ, 537, L23
- Garcia et al. (2000b) Garcia, M. R., Murray, S. S., Primini, F. A., McClintock, J. E., & Callanan, P. J. 2000b, IAU Circ., 7498, 3
- Gelino et al. (2001) Gelino, D. M., Harrison, T. E., & Orosz, J. A. 2001, AJ, 122, 2668
- Gill & O’Brien (1998) Gill, C. D., & O’Brien, T. J. 1998, MNRAS, 300, 221
- Gill & O’Brien (2000) Gill, C. D., & O’Brien, T. J. 2000, MNRAS, 314, 175
- Greiner et al. (2001) Greiner, J., Cuby, J. G., & McCaughrean, M. J. 2001, Nature, 414, 522
- Hasinger et al. (1998) Hasinger, G., Burg, R., Giacconi, R., Schmidt, M., Trumper, J., & Zamorani, G. 1998, A&A, 329, 482
- Hodge et al. (1988) Hodge, P., Lee, M. G., & Mateo, M. 1988, ApJ, 324, 172
- Holt et al. (2003) Holt, S. S., Schlegel, E. M., Hwang, U., & Petre, R. 2003, ApJ, 588, 792
- Holtzman et al. (1995) Holtzman, J. A., Burrows, C. J., Casertano, S., Hester, J. J., Trauger, J. T., Watson, A. M., & Worthey, G. 1995, PASP, 107, 1065
- Houck & Denicola (2000) Houck, J. C., & Denicola, L. A. 2000, in ASP Conf. Ser. 216: Astronomical Data Analysis Software and Systems IX, 591
- Kaaret (2002) Kaaret, P. 2002, ApJ, 578, 114
- Kilgard et al. (2002) Kilgard, R. E., Kaaret, P., Krauss, M. I., Prestwich, A. H., Raley, M. T., & Zezas, A. 2002, ApJ, 573, 138
- King & Ritter (1998) King, A. R., & Ritter, H. 1998, MNRAS, 293, L42
- King et al. (1992) King, I. R., et al. 1992, ApJ, 397, L35
- Kong et al. (2001) Kong, A., Garcia, M., Murray, S., Primini, F., McClintock, J., & Di Stefano, R. 2001, The Astronomer’s Telegram, 76, 1
- Kong et al. (2003a) Kong, A. K. H., DiStefano, R., Garcia, M. R., & Greiner, J. 2003a, ApJ, 585, 298
- Kong et al. (2002a) Kong, A. K. H., Garcia, M. R., Primini, F. A., Murray, S. S., Di Stefano, R., & McClintock, J. E. 2002a, ApJ, 577, 738
- Kong et al. (2002b) Kong, A. K. H., Garcia, M. R., Primini, F. A., Murray, S. S., & McClintock, J. E. 2002b, The Astronomer’s Telegram, 97, 1
- Kong et al. (2003b) Kong, A. K. H., Sjouwerman, L. O., Williams, B. F., Garcia, M. R., & Dickel, J. R. 2003b, ApJ, 590, L21
- Larionov et al. (2001) Larionov, V., Lyuty, V. M., & Zaitseva, G. V. 2001, A&A, 378, 837
- Liu et al. (2001) Liu, Q. Z., van Paradijs, J., & van den Heuvel, E. P. J. 2001, A&A, 368, 1021
- Magnier (1993) Magnier, E. A. 1993, Ph.D. Thesis
- Magnier et al. (1992) Magnier, E. A., Lewin, W. H. G., van Paradijs, J., Hasinger, G., Jain, A., Pietsch, W., & Truemper, J. 1992, A&AS, 96, 379
- Massey et al. (2001) Massey, P., Hodge, P. W., Holmes, S., Jacoby, G., King, N. L., Olsen, K., Saha, A., & Smith, C. 2001, in American Astronomical Society Meeting, Vol. 199, 13005
- McClintock & Remillard (2004) McClintock, J. E., & Remillard, R. A. 2004, in Compact Stellar X-ray Sources (astro-ph/0306213)
- Melchior et al. (2000) Melchior, A.-L., Viallefond, F., Guélin, M., & Neininger, N. 2000, MNRAS, 312, L29
- Meyssonnier et al. (1993) Meyssonnier, N., Lequeux, J., & Azzopardi, M. 1993, A&AS, 102, 251
- Mitsuda et al. (1984) Mitsuda, K., et al. 1984, PASJ, 36, 741
- Mochejska et al. (2001) Mochejska, B. J., Kaluzny, J., Stanek, K. Z., & Sasselov, D. D. 2001, AJ, 122, 1383
- Murray et al. (1999) Murray, S. S., Garcia, M. R., & Primini, F. A. 1999, IAU Circ., 7291, 1
- Negueruela (1998) Negueruela, I. 1998, A&A, 338, 505
- Negueruela et al. (2001) Negueruela, I., Okazaki, A. T., Fabregat, J., Coe, M. J., Munari, U., & Tomov, T. 2001, A&A, 369, 117
- Nowak (2002) Nowak, M. 2002, “Pileup Correction in ISIS, Sherpa, and XSPEC”, http://space.mit.edu/CXC/analysis/PILECOMP/index.html
- Orosz (2002) Orosz, J. A. 2002, in IAU Conf. Proc. 212: A Massive Star Odyssey, from Main Sequence to Supernova, astro-ph/0212531
- Osborne et al. (2001) Osborne, J. P., et al. 2001, A&A, 378, 800
- Patterson & Raymond (1985) Patterson, J., & Raymond, J. C. 1985, ApJ, 292, 535
- Perlman et al. (1996) Perlman, E. S., et al. 1996, ApJS, 104, 251
- Pigulski et al. (2001) Pigulski, A., Kopacki, G., & Kołaczkowski, Z. 2001, A&A, 376, 144
- Portegies Zwart et al. (1997) Portegies Zwart, S. F., Verbunt, F., & Ergma, E. 1997, A&A, 321, 207
- Predehl & Schmitt (1995) Predehl, P., & Schmitt, J. H. M. M. 1995, A&A, 293, 889
- Primini et al. (1993) Primini, F. A., Forman, W., & Jones, C. 1993, ApJ, 410, 615
- Sauty et al. (1998) Sauty, S., Gerin, M., & Casoli, F. 1998, A&A, 339, 19
- Shahbaz et al. (1994) Shahbaz, T., Ringwald, F. A., Bunn, J. C., Naylor, T., Charles, P. A., & Casares, J. 1994, MNRAS, 271, L10
- Shakura & Sunyaev (1973) Shakura, N. I., & Sunyaev, R. A. 1973, A&A, 24, 337
- Shirey (2001) Shirey, R. 2001, IAU Circ., 7659, 1
- Silber et al. (1994) Silber, A., Vrtilek, S. D., & Raymond, J. C. 1994, ApJ, 425, 829
- Sjouwerman & Dickel (2001) Sjouwerman, L. O., & Dickel, J. R. 2001, in Young Supernova Remnants: Eleventh Astrophysics Conference. AIP Conference Proceedings, Vol. 565. College Park, Maryland, 16-18 Oct, 2000. Edited by Stephen S. Holt, and Una Hwang. American Institute of Physics, 2001, p.433-436, 433
- Smith et al. (2002) Smith, R. K., Edgar, R. J., & Shafer, R. A. 2002, ApJ, 581, 562
- Stephens et al. (2003) Stephens, A. W., et al. 2003, AJ, 125, 2473
- Stetson et al. (1990) Stetson, P. B., Davis, L. E., & Crabtree, D. R. 1990, in ASP Conf. Ser. 8: CCDs in astronomy, 289
- Supper et al. (2001) Supper, R., Hasinger, G., Lewin, W. H. G., Magnier, E. A., van Paradijs, J., Pietsch, W., Read, A. M., & Trümper, J. 2001, A&A, 373, 63
- Supper et al. (1997) Supper, R., Hasinger, G., Pietsch, W., Truemper, J., Jain, A., Magnier, E. A., Lewin, W. H. G., & van Paradijs, J. 1997, A&A, 317, 328
- Swartz et al. (2003) Swartz, D. A., Ghosh, K. K., McCollough, M. L., Pannuti, T. G., Tennant, A. F., & Wu, K. 2003, ApJS, 144, 213
- Tanaka & Lewin (1995) Tanaka, Y., & Lewin, W. H. G. 1995, in X-ray binaries (Cambridge Astrophysics Series, Cambridge, MA: Cambridge University Press, —c1995, edited by Lewin, Walter H.G.; Van Paradijs, Jan; Van den Heuvel, Edward P.J.)
- Tanaka & Shibazaki (1996) Tanaka, Y., & Shibazaki, N. 1996, ARA&A, 34, 607
- Tinney et al. (1997) Tinney, C. G., Da Costa, G. S., & Zinnecker, H. 1997, MNRAS, 285, 111
- Trinchieri & Fabbiano (1991) Trinchieri, G., & Fabbiano, G. 1991, ApJ, 382, 82
- Trudolyubov et al. (2004) Trudolyubov, S., Kotov, O., Priedhorsky, W., Cordova, F., & Mason, K. 2004, ApJ, submitted (astro-ph/0401227)
- Trudolyubov et al. (2002a) Trudolyubov, S., Priedhorsky, W., Borozdin, K., Mason, K., & Cordova, F. 2002a, IAU Circ., 7798, 2
- Trudolyubov et al. (2001) Trudolyubov, S. P., Borozdin, K. N., & Priedhorsky, W. C. 2001, ApJ, 563, L119
- Trudolyubov et al. (2002b) Trudolyubov, S. P., Borozdin, K. N., Priedhorsky, W. C., Mason, K. O., & Cordova, F. A. 2002b, ApJ, 571, L17
- van den Bergh (1991) van den Bergh, S. 1991, PASP, 103, 1053
- van Paradijs & McClintock (1994) van Paradijs, J., & McClintock, J. E. 1994, A&A, 290, 133
- van Speybroeck et al. (1979) van Speybroeck, L., Epstein, A., Forman, W., Giacconi, R., Jones, C., Liller, W., & Smarr, L. 1979, ApJ, 234, L45
- Verbunt & van den Heuvel (1995) Verbunt, F., & van den Heuvel, E. P. J. 1995, in X-ray binaries (Cambridge Astrophysics Series, Cambridge, MA: Cambridge University Press, —c1995, edited by Lewin, Walter H.G.; Van Paradijs, Jan; Van den Heuvel, Edward P.J.)
- Voges et al. (1999) Voges, W., et al. 1999, A&A, 349, 389
- Walterbos & Braun (1992) Walterbos, R. A. M., & Braun, R. 1992, A&AS, 92, 625
- Warner (1995) Warner, B. 1995, Cataclysmic variable stars (Cambridge Astrophysics Series, Cambridge, New York: Cambridge University Press, —c1995)
- White et al. (1995) White, N. E., Giommi, P., Heise, J., Angelini, L., & Fantasia, S. 1995, ApJ, 445, L125
- Williams (2003a) Williams, B. F. 2003a, MNRAS, 340, 143
- Williams (2003b) Williams, B. F. 2003b, AJ, 126, 1312
- Williams et al. (1995) Williams, B. F., Schmitt, M. D., & Winkler, P. F. 1995, in American Astronomical Society Meeting, Vol. 27, 883
- Wirth et al. (1985) Wirth, A., Smarr, L. L., & Bruno, T. L. 1985, ApJ, 290, 140
| OBSID | Date | Epoch | R.A. | DEC | Exposure (s) |
|---|---|---|---|---|---|
| 243 | 1999-11-30 | 1 | 0:40:27.00 | 40:40:12.0 | 1163.613 |
| 255 | 1999-11-30 | 1 | 0:42:08.00 | 40:55:17.0 | 1269.114 |
| 267 | 1999-11-30 | 1 | 0:42:44.40 | 41:16:08.3 | 1270.082 |
| 279 | 1999-11-30 | 1 | 0:44:07.00 | 41:43:16.0 | 2683.351 |
| 291 | 1999-11-30 | 1 | 0:45:20.00 | 41:49:47.0 | 1270.183 |
| 268 | 1999-12-23 | 2 | 0:42:44.40 | 41:16:08.3 | 5178.063 |
| 245 | 2000-01-19 | 3 | 0:40:27.00 | 40:40:12.0 | 1159.204 |
| 257 | 2000-01-19 | 3 | 0:42:08.00 | 40:55:17.0 | 1207.168 |
| 269 | 2000-01-19 | 3 | 0:42:44.40 | 41:16:08.3 | 1205.910 |
| 281 | 2000-01-19 | 3 | 0:44:07.00 | 41:43:16.0 | 1205.035 |
| 293 | 2000-01-19 | 3 | 0:45:20.00 | 41:49:47.0 | 1208.001 |
| 246 | 2000-02-13 | 4 | 0:40:27.00 | 40:40:12.0 | 1417.755 |
| 258 | 2000-02-13 | 4 | 0:42:08.00 | 40:55:17.0 | 1474.374 |
| 270 | 2000-02-13 | 4 | 0:42:44.40 | 41:16:08.3 | 1469.659 |
| 282 | 2000-02-13 | 4 | 0:44:07.00 | 41:43:16.0 | 1473.856 |
| 294 | 2000-02-13 | 4 | 0:45:20.00 | 41:49:47.0 | 1467.671 |
| 247 | 2000-03-08 | 5 | 0:40:27.00 | 40:40:12.0 | 2162.940 |
| 259 | 2000-03-08 | 5 | 0:42:08.00 | 40:55:17.0 | 2472.312 |
| 271 | 2000-03-08 | 5 | 0:42:44.40 | 41:16:08.3 | 2461.785 |
| 283 | 2000-03-08 | 5 | 0:44:07.00 | 41:43:16.0 | 2476.503 |
| 295 | 2000-03-08 | 5 | 0:45:20.00 | 41:49:47.0 | 2455.864 |
| 248 | 2000-05-26 | 6 | 0:40:27.00 | 40:40:12.0 | 1156.204 |
| 260 | 2000-05-26 | 6 | 0:42:40.80 | 40:51:54.0 | 1209.234 |
| 272 | 2000-05-26 | 6 | 0:42:44.40 | 41:16:08.3 | 1202.670 |
| 284 | 2000-05-26 | 6 | 0:44:07.00 | 41:43:16.0 | 1211.161 |
| 296 | 2000-05-26 | 6 | 0:45:20.00 | 41:49:47.0 | 1204.171 |
| 249 | 2000-06-21 | 7 | 0:40:27.00 | 40:40:12.0 | 1189.396 |
| 261 | 2000-06-21 | 7 | 0:42:40.80 | 40:51:54.0 | 1186.803 |
| 273 | 2000-06-21 | 7 | 0:42:44.40 | 41:16:08.3 | 1190.727 |
| 285 | 2000-06-21 | 7 | 0:44:07.00 | 41:43:16.0 | 1186.797 |
| 297 | 2000-06-21 | 7 | 0:45:20.00 | 41:49:47.0 | 893.869 |
| 251 | 2000-08-18 | 8 | 0:40:27.00 | 40:40:12.0 | 977.143 |
| 263 | 2000-08-18 | 8 | 0:42:40.80 | 40:51:54.0 | 1184.931 |
| 275 | 2000-08-18 | 8 | 0:42:44.40 | 41:16:08.3 | 1188.885 |
| 287 | 2000-08-18 | 8 | 0:44:07.00 | 41:43:16.0 | 1186.985 |
| 299 | 2000-08-18 | 8 | 0:45:20.00 | 41:49:47.0 | 1170.571 |
| 252 | 2000-09-11 | 9 | 0:40:27.00 | 40:40:12.0 | 1189.792 |
| 264 | 2000-09-11 | 9 | 0:42:40.80 | 40:51:54.0 | 1189.081 |
| 276 | 2000-09-11 | 9 | 0:42:44.40 | 41:16:08.3 | 1182.794 |
| 288 | 2000-09-11 | 9 | 0:44:07.00 | 41:43:16.0 | 1193.216 |
| 300 | 2000-09-11 | 9 | 0:45:20.00 | 41:49:47.0 | 1150.291 |
| 253 | 2000-10-12 | 10 | 0:40:27.00 | 40:40:12.0 | 871.491 |
| 265 | 2000-10-12 | 10 | 0:42:40.80 | 40:51:54.0 | 1189.515 |
| 277 | 2000-10-12 | 10 | 0:42:44.40 | 41:16:08.3 | 1187.209 |
| 289 | 2000-10-12 | 10 | 0:44:07.00 | 41:43:16.0 | 1190.742 |
| 301 | 2000-10-12 | 10 | 0:45:20.00 | 41:49:47.0 | 1162.660 |
| 254 | 2000-11-17 | 11 | 0:40:27.00 | 40:40:12.0 | 1182.351 |
| 266 | 2000-11-17 | 11 | 0:42:40.80 | 40:51:54.0 | 1180.444 |
| 278 | 2000-11-17 | 11 | 0:42:44.40 | 41:16:08.3 | 1182.300 |
| 290 | 2000-11-17 | 11 | 0:44:07.00 | 41:43:16.0 | 1176.379 |
| 302 | 2000-11-17 | 11 | 0:45:20.00 | 41:49:47.0 | 979.562 |
| 1565 | 2001-01-31 | 12 | 0:40:27.00 | 40:40:12.0 | 964.220 |
| 1567 | 2001-02-01 | 12 | 0:42:08.00 | 40:55:17.0 | 1172.113 |
| 1569 | 2001-02-01 | 12 | 0:42:44.40 | 41:16:08.3 | 1171.771 |
| 1571 | 2001-02-01 | 12 | 0:44:07.00 | 41:43:16.0 | 1187.686 |
| 1573 | 2001-02-01 | 12 | 0:45:20.00 | 41:49:47.0 | 1186.826 |
| 1566 | 2001-06-10 | 13 | 0:40:27.00 | 40:40:12.0 | 871.495 |
| 1568 | 2001-06-10 | 13 | 0:42:08.00 | 40:55:17.0 | 1183.653 |
| 1570 | 2001-06-10 | 13 | 0:42:44.40 | 41:16:08.3 | 1184.236 |
| 1572 | 2001-06-10 | 13 | 0:44:07.00 | 41:43:16.0 | 1184.442 |
| 1574 | 2001-06-10 | 13 | 0:45:20.00 | 41:49:47.0 | 1194.797 |
| 2886 | 2001-09-08 | 14 | 0:40:27.10 | 40:40:12.0 | 867.664 |
| 2890 | 2001-09-08 | 14 | 0:42:07.90 | 40:55:15.6 | 1182.953 |
| 2903 | 2001-09-08 | 14 | 0:42:44.40 | 41:43:15.6 | 1188.012 |
| 2907 | 2001-09-08 | 14 | 0:44:07.00 | 41:43:15.6 | 1179.696 |
| 2911 | 2001-09-08 | 14 | 0:45:19.90 | 41:49:48.0 | 1178.814 |
| 2887 | 2001-11-19 | 15 | 0:40:27.10 | 40:40:12.0 | 982.551 |
| 2891 | 2001-11-19 | 15 | 0:42:07.90 | 40:55:15.6 | 1173.808 |
| 2904 | 2001-11-19 | 15 | 0:42:44.40 | 41:16:08.3 | 1181.646 |
| 2908 | 2001-11-19 | 15 | 0:44:07.00 | 41:43:15.6 | 1172.898 |
| 2912 | 2001-11-19 | 15 | 0:45:19.90 | 41:49:48.0 | 1161.823 |
| 2888 | 2002-01-16 | 16 | 0:40:27.10 | 40:40:12.0 | 975.687 |
| 2892 | 2002-01-16 | 16 | 0:42:07.90 | 40:55:15.6 | 1083.539 |
| 2905 | 2002-01-16 | 16 | 0:42:44.40 | 41:16:08.3 | 1094.222 |
| 2909 | 2002-01-16 | 16 | 0:44:07.00 | 41:43:15.6 | 1084.598 |
| 2913 | 2002-01-16 | 16 | 0:44:28.40 | 41:56:28.1 | 1097.045 |
| 2889 | 2002-06-02 | 17 | 0:40:27.10 | 40:40:12.0 | 980.472 |
| 2893 | 2002-06-02 | 17 | 0:42:07.90 | 40:55:15.6 | 1190.200 |
| 2906 | 2002-06-02 | 17 | 0:42:44.40 | 41:16:08.3 | 1187.762 |
| 2910 | 2002-06-02 | 17 | 0:44:07.00 | 41:43:15.6 | 1196.402 |
| 2914 | 2002-06-02 | 17 | 0:45:19.90 | 41:49:48.0 | 1190.132 |
| OBJa | R.A.b | DECb | ctsc | S/Nd | Le | f | Counterpartg | Ref.h (type)i |
|---|---|---|---|---|---|---|---|---|
| s1-74 | 0:39:56.34 | 40:41:00.9 | 51 | 7.0 | 5.41.0 | 0.242 | foreground (V14.7) | new (*) |
| s1-75 | 0:40:13.77 | 40:50:05.1 | 2215 | 118.0 | 265.96.0 | 1.968 | B3 0037+405 | 23 (BLL) |
| s1-76 | 0:40:14.34 | 40:33:41.5 | 65 | 9.3 | 7.11.1 | 0.263 | new | new (X) |
| s1-77 | 0:40:20.29 | 40:43:58.5 | 1436 | 169.9 | 146.94.0 | 1.086 | Bol 5 | 6 (GC) |
| s1-78 | 0:40:22.71 | 40:36:10.5 | 42 | 6.9 | 4.30.8 | 0.253 | LGSJ004022.7+403610 | new (*) |
| s2-63 | 0:40:24.20 | 40:29:48.5 | 32 | 5.2 | 3.80.9 | 0.356 | RX J004024.5+402946 | 1 (X) |
| s1-79 | 0:40:55.16 | 40:56:03.5 | 850 | 27.4 | 90.94.5 | 18.805 | new | new (X) |
| s1-45 | 0:41:18.55 | 40:52:00.5 | 136 | 8.2 | 9.21.3 | 1.251 | foreground (V14.7) | QSS (*) |
| s1-31 | 0:41:25.78 | 40:58:47.5 | 171 | 11.7 | 20.32.2 | 1.024 | RX J004125.9+405842 | 1 (X) |
| s1-34 | 0:41:25.93 | 40:53:25.5 | 59 | 5.0 | 4.91.1 | 0.437 | LGSJ004126.2+405327 | new (*) |
| s1-28 | 0:41:37.60 | 41:01:09.8 | 39 | 3.8 | 4.11.2 | 0.285 | RX J004138.3+410106 | 1 (X) |
| s1-16 | 0:41:49.81 | 41:01:05.8 | 20 | 3.7 | 1.70.5 | 0.146 | RX J004149.8+410109 | 1 (X) |
| s1-80 | 0:41:54.63 | 40:56:47.4 | 150 | 24.0 | 13.91.2 | 7.158 | 1RXS J004154.1+405648 (ATel97) | 16 (X) |
| s1-64 | 0:42:02.92 | 40:46:11.4 | 137 | 9.3 | 12.91.7 | 0.695 | LGSJ004203.0+404613 | new (*) |
| r3-125 | 0:42:05.71 | 41:13:29.7 | 65 | 5.3 | 5.21.1 | 0.620 | [PFJ93] 3 | 2 (X) |
| s1-12 | 0:42:06.12 | 41:02:47.5 | 78 | 5.6 | 4.20.8 | 0.469 | Bol D42 | 6 (GC) |
| s1-11 | 0:42:07.16 | 41:00:17.9 | 50 | 5.8 | 3.80.8 | 0.273 | Bol D44 | 6 (GC) |
| r3-61 | 0:42:07.74 | 41:18:15.4 | 338 | 34.2 | 26.61.6 | 0.953 | C84 10 | 3 (X) |
| s1-9 | 0:42:07.89 | 41:04:34.6 | 82 | 5.3 | 4.20.9 | 0.408 | RX J004208.2+410438 | 1 (X) |
| r3-60 | 0:42:09.11 | 41:20:49.0 | 71 | 6.8 | 5.71.0 | 0.547 | CXOM31 J004209.0+412048 | 15 (X) |
| r3-59 | 0:42:09.53 | 41:17:45.3 | 80 | 9.6 | 6.20.9 | 0.350 | mita140 | 14 (GC) |
| r3-58 | 0:42:10.32 | 41:15:10.1 | 52 | 7.3 | 4.00.7 | 0.795 | [PFJ93] 6 | 2 (X) |
| r3-57 | 0:42:11.01 | 41:12:47.7 | 34 | 4.9 | 2.70.7 | 0.139 | CXOM31 J004210.9+411248 | 15 (X) |
| r3-56 | 0:42:11.79 | 41:10:48.6 | 61 | 5.7 | 4.91.0 | 0.285 | [PFJ93] 7 | 2 (X) |
| r3-55 | 0:42:11.92 | 41:16:48.9 | 32 | 5.5 | 2.50.6 | 0.177 | CXOM31J004211.9+411648 | 15 (X) |
| s1-58 | 0:42:12.12 | 40:53:35.6 | 25 | 4.7 | 2.20.6 | 0.212 | MLA 462 | 17 (X) |
| r3-54 | 0:42:12.15 | 41:17:59.1 | 140 | 17.8 | 10.81.1 | 1.704 | mita153 | 14 (GC) |
| r3-52 | 0:42:13.14 | 41:18:36.7 | 647 | 60.4 | 49.92.1 | 4.630 | C84 13 | 3 (X) |
| s1-81 | 0:42:13.77 | 40:39:25.0 | 83 | 4.7 | 11.82.7 | 0.665 | RX J004213.5+403917 | 1 (X) |
| r3-50 | 0:42:15.13 | 41:12:34.6 | 342 | 37.7 | 26.41.6 | 3.871 | [PFJ93] 10 | 2 (X) |
| r3-48 | 0:42:15.37 | 41:20:31.7 | 77 | 9.9 | 6.00.9 | 0.206 | [PFJ93] 11 | 2 (X) |
| r3-47 | 0:42:15.65 | 41:17:21.0 | 149 | 19.5 | 11.21.1 | 0.988 | C84 16 | 3 (X) |
| s1-7 | 0:42:15.86 | 41:01:14.7 | 1214 | 66.6 | 74.72.4 | 2.675 | mita159 | 14 (GC) |
| s1-6 | 0:42:16.55 | 40:55:52.3 | 199 | 25.8 | 17.51.4 | 0.442 | RX J004216.4+405555 | 1 (X) |
| r3-46 | 0:42:17.06 | 41:15:08.8 | 43 | 9.0 | 3.20.6 | 5.710 | CXOM31 J004216.9+411508 | 15 (X) |
| r3-45 | 0:42:18.32 | 41:12:24.1 | 643 | 65.8 | 49.22.0 | 1.398 | C84 21 | 3 (X) |
| r3-44 | 0:42:18.62 | 41:14:01.9 | 574 | 77.8 | 43.01.9 | 1.307 | mita164 | 14 (GC) |
| s1-82 | 0:42:20.82 | 40:51:36.3 | 27 | 5.0 | 2.40.6 | 0.552 | new | new (X) |
| r3-42 | 0:42:21.48 | 41:16:01.6 | 406 | 66.6 | 29.81.5 | 1.350 | C84 23 | 3 (X) |
| r3-41 | 0:42:21.54 | 41:14:18.5 | 46 | 8.4 | 3.40.6 | 0.557 | CXOM31 J004221.5+411419 | 15 (X) |
| s1-5 | 0:42:22.20 | 40:59:25.6 | 234 | 24.2 | 16.41.2 | 0.448 | RX J004222.1+405926 | 1 (X) |
| r3-40 | 0:42:22.41 | 41:13:34.2 | 293 | 44.4 | 21.81.3 | 1.429 | C84 25 | 3 (X) |
| r3-39 | 0:42:22.94 | 41:15:35.4 | 884 | 125.9 | 64.62.2 | 44.079 | C84 26 | 3 (X) |
| r3-38 | 0:42:23.15 | 41:14:07.4 | 141 | 26.8 | 10.40.9 | 1.193 | C84 27 | 3 (X) |
| r2-45 | 0:42:25.11 | 41:13:40.7 | 109 | 19.7 | 8.00.8 | 1.287 | C84 28 | 3 (X) |
| r3-87 | 0:42:25.72 | 41:25:50.3 | 81 | 9.7 | 7.01.0 | 0.155 | [PFJ93] 24 | 2 (X) |
| r2-36 | 0:42:26.03 | 41:19:15.3 | 155 | 26.7 | 11.41.0 | 0.962 | mita174 | 14 (GC) |
| r3-36 | 0:42:28.20 | 41:10:00.7 | 310 | 34.2 | 24.21.5 | 0.638 | CXOM31 J004228.1+410959 | 15 (X) |
| r2-35 | 0:42:28.28 | 41:12:23.2 | 816 | 113.7 | 60.72.2 | 1.878 | C84 30 | 3 (X) |
| r3-111 | 0:42:28.92 | 41:04:35.8 | 608 | 23.3 | 29.91.7 | 2.483 | C84 31 | 3 (X) |
| r2-34 | 0:42:31.13 | 41:16:21.9 | 734 | 133.3 | 52.11.9 | 0.526 | C84 36 | 3 (X) |
| r2-33 | 0:42:31.24 | 41:19:39.2 | 156 | 30.8 | 11.51.0 | 2.727 | mita192 | 14 (GC) |
| r2-32 | 0:42:32.07 | 41:13:14.5 | 411 | 71.9 | 29.81.5 | 3.280 | C84 39 | 3 (X) |
| r2-68 | 0:42:32.63 | 41:17:02.9 | 19 | 4.6 | 1.40.4 | 0.149 | new | new (X) |
| r2-31 | 0:42:32.74 | 41:13:11.0 | 65 | 13.6 | 4.70.6 | 0.801 | RX J004232.7+411318 | 1 (X) |
| r2-30 | 0:42:33.87 | 41:16:20.2 | 106 | 21.4 | 7.50.8 | 0.264 | [PFJ93] 32 | 2 (X) |
| r2-29 | 0:42:34.43 | 41:18:09.6 | 40 | 9.5 | 2.80.5 | 1.149 | CXOM31 J004234.4+411809 | 15 (X) |
| n1-74 | 0:42:34.53 | 41:32:47.7 | 159 | 5.5 | 23.44.5 | 1.207 | Bol 116 | 6 (GC) |
| r2-28 | 0:42:34.75 | 41:15:23.5 | 69 | 14.6 | 4.80.6 | 2.119 | CXOM31 J004234.7+411523 | 15 (X) |
| s1-1 | 0:42:34.97 | 40:57:21.5 | 79 | 10.5 | 6.50.9 | 1.399 | new | new (X) |
| s1-83 | 0:42:35.03 | 40:48:38.0 | 160 | 14.6 | 15.41.6 | 0.866 | Bol D63 | 6 (GC) |
| r2-27 | 0:42:35.18 | 41:20:05.8 | 114 | 23.9 | 8.40.8 | 0.567 | [PFJ93] 34 | 2 (X) |
| r2-42 | 0:42:36.64 | 41:13:50.4 | 31 | 7.1 | 2.20.5 | 0.154 | QSS | QSS (X) |
| r2-26 | 0:42:38.57 | 41:16:03.9 | 5579 | 589.9 | 390.25.3 | 7.392 | [PFJ93] 35 | 2 (X) |
| r2-25 | 0:42:39.52 | 41:14:28.7 | 97 | 22.1 | 6.90.7 | 0.999 | TF 42 | 3 (X) |
| r1-34 | 0:42:39.58 | 41:16:14.6 | 26 | 5.9 | 1.90.4 | 42.880 | TF 43 | 3 (X) |
| s1-84 | 0:42:39.70 | 40:43:18.7 | 114 | 5.8 | 12.72.4 | 0.359 | RX J004238.8+404317 | 1 (X) |
| r1-15 | 0:42:39.98 | 41:15:47.7 | 424 | 66.7 | 29.61.5 | 2.101 | Ford M 31 17 | 5 (PN) |
| r2-24 | 0:42:40.20 | 41:18:45.6 | 74 | 17.5 | 5.30.7 | 0.431 | CXOM31 J004240.1+411845 | 15 (X) |
| r2-22 | 0:42:40.64 | 41:13:27.5 | 173 | 33.7 | 12.31.0 | 2.230 | [PFJ93] 38 | 2 (X) |
| r3-34 | 0:42:40.65 | 41:10:32.8 | 26 | 4.5 | 2.00.5 | 0.296 | mita212 | 14 (GC) |
| s1-85 | 0:42:40.66 | 40:51:17.5 | 161 | 25.8 | 15.01.3 | 7.419 | M32-t1 | 22 (X) |
| r1-32 | 0:42:41.43 | 41:15:24.4 | 50 | 10.9 | 3.50.6 | 1.328 | mita213 | 14 (GC) |
| r3-31 | 0:42:41.65 | 41:21:06.7 | 30 | 4.5 | 2.20.6 | 0.408 | CXOM31 J004241.6+412106 | 15 (X) |
| r1-31 | 0:42:42.07 | 41:15:32.4 | 23 | 5.4 | 1.60.4 | 0.164 | CXOM31 J004242.0+411532 | 15 (X) |
| r2-69 | 0:42:42.16 | 41:14:24.4 | 28 | 6.0 | 2.00.5 | 0.830 | new | new (X) |
| r1-5 | 0:42:42.16 | 41:16:08.4 | 940 | 129.2 | 65.52.2 | 46.434 | CXOM31 J004242.1+411608 | 15 (X) |
| r2-21 | 0:42:42.33 | 41:14:45.6 | 180 | 38.0 | 12.61.0 | 0.256 | [PFJ93] 39 | 2 (X) |
| s1-32 | 0:42:42.45 | 40:51:53.0 | 844 | 71.8 | 78.52.9 | 1.091 | bbk2000-7442 (M32) | 7 (*) |
| r1-14 | 0:42:42.47 | 41:15:53.8 | 224 | 35.0 | 15.61.1 | 0.490 | [PFJ93] 41 | 2 (X) |
| r1-30 | 0:42:42.60 | 41:16:59.8 | 31 | 6.1 | 2.20.5 | 0.136 | [PFJ93] 40 | 2 (X) |
| r1-13 | 0:42:42.98 | 41:15:43.3 | 199 | 42.3 | 13.91.0 | 0.592 | [PFJ93] 42 | 2 (X) |
| r1-35 | 0:42:43.12 | 41:16:04.1 | 39 | 8.2 | 2.70.5 | 0.817 | SSS near SN 1885A | 18 (SN) |
| r1-24 | 0:42:43.29 | 41:16:40.1 | 36 | 7.0 | 2.50.5 | 0.215 | Ford M 31 322 | 5 (PN) |
| r2-19 | 0:42:43.30 | 41:13:19.7 | 92 | 20.4 | 6.60.7 | 0.726 | QSS | QSS (X) |
| r1-12 | 0:42:43.73 | 41:16:32.7 | 170 | 30.7 | 11.91.0 | 1.574 | [PFJ93] 43 | 2 (X) |
| r1-28 | 0:42:43.77 | 41:15:14.2 | 40 | 8.3 | 2.80.5 | 1.195 | CXOM31 J004243.7+411514 | 15 (X) |
| r1-23 | 0:42:43.84 | 41:16:04.1 | 45 | 8.2 | 3.20.6 | 0.566 | Ford M 31 8 | 5 (PN) |
| r1-11 | 0:42:43.86 | 41:16:29.8 | 88 | 18.6 | 6.10.7 | 0.707 | [PFJ93] 43 | 2 (X) |
| r1-22 | 0:42:44.22 | 41:16:14.7 | 43 | 6.9 | 3.00.6 | 0.230 | BFS98-M31-53 | 8 (*) |
| r1-9 | 0:42:44.36 | 41:16:07.5 | 470 | 62.2 | 32.71.6 | 8.308 | SSS | SSS (X) |
| r3-30 | 0:42:44.39 | 41:11:58.7 | 39 | 9.2 | 2.90.5 | 0.289 | CXOM31 J004244.4+411157 | 15 (X) |
| r1-8 | 0:42:44.66 | 41:16:18.7 | 80 | 13.2 | 5.60.7 | 0.458 | [PFJ93] 47 | 2 (X) |
| r3-29 | 0:42:44.84 | 41:11:38.2 | 412 | 62.4 | 30.61.6 | 2.189 | C84 67 | 3 (X) |
| r2-18 | 0:42:44.89 | 41:17:40.2 | 66 | 13.3 | 4.60.6 | 0.505 | CXOM31 J004244.8+411739 | 15 (X) |
| r2-17 | 0:42:45.09 | 41:14:07.4 | 36 | 9.8 | 2.60.5 | 0.182 | [PFJ93] 46 | 2 (X) |
| r1-4 | 0:42:45.10 | 41:16:21.9 | 331 | 49.9 | 23.11.3 | 4.790 | [PFJ93] 47 | 2 (X) |
| r1-26 | 0:42:45.11 | 41:15:23.4 | 44 | 9.7 | 3.10.5 | 0.304 | Ford M 31 21 | 5 (PN) |
| r2-16 | 0:42:45.19 | 41:17:22.5 | 111 | 24.0 | 7.80.8 | 2.575 | CXOM31 J004245.2+411722 | 15 (X) |
| r1-20 | 0:42:45.20 | 41:16:11.2 | 56 | 10.2 | 3.90.6 | 0.160 | BFS98-M31-419 | 8 (*) |
| r1-7 | 0:42:45.59 | 41:16:08.5 | 52 | 9.5 | 3.60.6 | 0.395 | CXOM31 J004245.5+411608 | 15 (X) |
| r1-19 | 0:42:46.00 | 41:16:19.9 | 37 | 8.0 | 2.60.5 | 0.518 | CXOM31 J004245.9+411619 | 15 (X) |
| r1-18 | 0:42:46.18 | 41:15:43.1 | 29 | 6.7 | 2.00.4 | 0.208 | CXOM31 J004246.1+411543 | 15 (X) |
| r3-28 | 0:42:46.95 | 41:21:21.5 | 32 | 5.1 | 2.40.6 | 0.213 | LGSJ004246.9+412120 | new (*) |
| r1-3 | 0:42:46.97 | 41:16:15.9 | 318 | 42.5 | 22.21.3 | 2.157 | [PFJ93] 49 | 2 (X) |
| r1-2 | 0:42:47.16 | 41:16:28.6 | 1004 | 150.4 | 70.22.2 | 8.826 | Ford M 31 13 | 5 (PN) |
| r3-27 | 0:42:47.27 | 41:11:57.6 | 33 | 7.8 | 2.40.5 | 0.210 | CXOM31J004247.2+411157 | 15 (X) |
| r1-17 | 0:42:47.84 | 41:16:23.0 | 30 | 6.9 | 2.10.4 | 0.327 | CXOM31J004247.8+411623 | 15 (X) |
| r1-6 | 0:42:47.88 | 41:15:33.2 | 348 | 57.1 | 24.41.4 | 3.205 | [PFJ93] 52 | 2 (X) |
| r1-25 | 0:42:47.90 | 41:15:49.8 | 18 | 4.7 | 1.20.3 | 0.180 | SSS | SSS (X) |
| r1-1 | 0:42:48.52 | 41:15:21.4 | 1089 | 175.2 | 76.52.3 | 1.527 | [PFJ93] 54 | 2 (X) |
| r3-25 | 0:42:48.55 | 41:25:22.7 | 179 | 16.6 | 15.01.4 | 2.768 | RX J004248.7+412522 | 1 (X) |
| r1-16 | 0:42:48.69 | 41:16:24.9 | 46 | 8.9 | 3.20.6 | 0.417 | CXOM31 J004248.7+411624 | 15 (X) |
| r2-14 | 0:42:49.20 | 41:18:15.9 | 84 | 19.6 | 6.00.7 | 0.268 | [PFJ93] 55 | 2 (X) |
| n1-75 | 0:42:51.98 | 41:31:07.7 | 2436 | 54.1 | 212.55.8 | 1.233 | mita225 | 14 (GC) |
| r2-13 | 0:42:52.51 | 41:18:54.8 | 1029 | 165.4 | 74.52.4 | 1.071 | [PFJ93] 57 | 2 (X) |
| r2-12 | 0:42:52.52 | 41:15:40.2 | 928 | 159.9 | 65.52.2 | 3.345 | SSS | SSS (X) |
| r3-69 | 0:42:53.53 | 41:25:55.3 | 45 | 5.7 | 3.80.8 | 0.197 | DDB 1-13 | 11 (SNR) |
| r2-11 | 0:42:54.92 | 41:16:03.5 | 973 | 169.3 | 69.12.2 | 0.650 | [PFJ93] 60 | 2 (X) |
| r2-10 | 0:42:55.14 | 41:18:36.7 | 68 | 16.1 | 4.90.6 | 0.357 | CXOM31 J004255.1+411836 | 15 (X) |
| r3-23 | 0:42:55.25 | 41:25:55.2 | 102 | 12.0 | 8.71.1 | 0.304 | [PFJ93] 61 | 2 (X) |
| r2-9 | 0:42:55.58 | 41:18:35.3 | 48 | 11.9 | 3.50.6 | 0.352 | Bol 138 | 6 (GC) |
| r2-8 | 0:42:56.89 | 41:18:44.0 | 42 | 10.4 | 3.10.5 | 1.121 | LGSJ004257.0+411844 | new (*) |
| r3-22 | 0:42:57.90 | 41:11:04.9 | 414 | 51.1 | 31.61.6 | 1.638 | RX J004257.7+411103 | 1 (X) |
| r2-7 | 0:42:58.33 | 41:15:29.2 | 155 | 31.6 | 11.20.9 | 1.431 | [PFJ93] 65 | 2 (X) |
| r2-63 | 0:42:59.28 | 41:16:43.5 | 43 | 10.3 | 3.10.5 | 0.689 | SSS | SSS (X) |
| r2-6 | 0:42:59.64 | 41:19:19.7 | 490 | 79.9 | 36.41.7 | 0.664 | Bol 143 | 6 (GC) |
| r2-5 | 0:42:59.86 | 41:16:05.9 | 394 | 78.4 | 28.51.5 | 3.506 | Bol 144 | 6 (GC) |
| n1-76 | 0:43:00.87 | 41:30:13.3 | 423 | 8.7 | 33.94.2 | 0.350 | [PFJ93] 69 | 2 (X) |
| r2-37 | 0:43:01.07 | 41:13:51.4 | 30 | 7.0 | 2.20.5 | 0.256 | [PFJ93] 68 | 2 (X) |
| r2-4 | 0:43:02.93 | 41:15:22.9 | 412 | 71.6 | 30.21.5 | 5.895 | Bol 146 | 6 (GC) |
| r3-20 | 0:43:03.08 | 41:10:16.1 | 79 | 10.0 | 6.20.9 | 0.408 | [PFJ93] 71 | 2 (X) |
| r2-3 | 0:43:03.23 | 41:15:28.2 | 345 | 62.8 | 25.31.4 | 6.468 | CXOM31 J004303.2+411528 | 15 (X) |
| r3-19 | 0:43:03.34 | 41:21:22.0 | 198 | 24.3 | 15.31.2 | 0.217 | mita240 | 14 (GC) |
| r2-2 | 0:43:03.85 | 41:18:05.3 | 314 | 54.1 | 23.31.4 | 3.745 | Bol 148 | 6 (GC) |
| r2-1 | 0:43:04.25 | 41:16:01.4 | 59 | 12.6 | 4.30.6 | 0.544 | CXOM31 J004304.2+411601 | 15 (X) |
| r2-67 | 0:43:05.66 | 41:17:03.3 | 222 | 43.0 | 16.51.1 | 517.664 | LGSJ004305.6+411703 | new (*) |
| r3-67 | 0:43:06.66 | 41:19:16.2 | 27 | 4.6 | 2.10.5 | 0.110 | CXOM31 J004306.8+411912 | 15 (X) |
| r3-115 | 0:43:07.14 | 41:18:09.5 | 20 | 4.8 | 1.50.4 | 1.010 | LGSJ004306.9+411809 | SSS (*) |
| r3-18 | 0:43:07.52 | 41:20:19.8 | 49 | 7.5 | 3.70.7 | 0.528 | mita246 | 14 (GC) |
| r3-17 | 0:43:08.63 | 41:12:50.1 | 81 | 12.1 | 6.20.8 | 0.312 | [PFJ93] 74 | 2 (X) |
| r3-16 | 0:43:09.78 | 41:19:01.2 | 92 | 13.2 | 7.00.9 | 15.871 | [WSB85] S1 4 | 20 (?) |
| r3-15 | 0:43:10.62 | 41:14:51.7 | 1248 | 150.5 | 94.32.7 | 2.681 | mita251 | 14 (GC) |
| r3-13 | 0:43:13.16 | 41:18:14.1 | 28 | 5.1 | 2.10.5 | 0.187 | LGSJ004318.1+411814 | new (*) |
| r3-112 | 0:43:14.37 | 41:07:21.8 | 711 | 15.5 | 48.33.5 | 2.852 | mita257 | 14 (GC) |
| r3-9 | 0:43:16.13 | 41:18:41.4 | 56 | 9.2 | 4.40.7 | 0.363 | CXOM31 J004316.1+411841 | 15 (X) |
| r3-8 | 0:43:18.83 | 41:20:17.4 | 67 | 6.9 | 5.30.9 | 1.149 | C84 101 | 3 (X) |
| r3-126 | 0:43:19.52 | 41:17:56.7 | 98 | 11.3 | 7.71.0 | 2.628 | XMMU J004319.4+411759 | 19 (X) |
| r3-7 | 0:43:21.02 | 41:17:50.8 | 105 | 13.3 | 8.41.0 | 0.925 | Ford M 31 209 | 5 (PN) |
| r3-63 | 0:43:27.95 | 41:18:31.0 | 199 | 12.8 | 16.41.7 | 0.196 | DDB 1-15 | 11 (SNR) |
| r3-103 | 0:43:29.28 | 41:07:49.8 | 250 | 11.1 | 23.02.5 | 0.223 | [PFJ93] 81 | 2 (X) |
| r3-3 | 0:43:32.50 | 41:10:38.9 | 53 | 7.4 | 4.60.8 | 0.356 | RX J004331.9+411038 | 1 (X) |
| r3-2 | 0:43:34.31 | 41:13:26.6 | 262 | 23.8 | 22.51.6 | 2.120 | C84 105 | 3 (X) |
| r3-1 | 0:43:37.27 | 41:14:43.8 | 405 | 32.3 | 35.02.0 | 0.355 | mita299 | 14 (GC) |
| n1-77 | 0:43:44.56 | 41:24:17.1 | 281 | 8.1 | 24.73.3 | 0.954 | 2E 0040.9+4108 | 3 (X) |
| n1-78 | 0:43:45.64 | 41:36:57.4 | 47 | 6.8 | 4.20.8 | 0.570 | Bol 193 | 6 (GC) |
| n1-79 | 0:43:53.56 | 41:16:51.0 | 200 | 19.1 | 18.91.6 | 0.448 | D31J004353.8+411655.9 | 13 (*) |
| n1-80 | 0:44:02.73 | 41:39:26.0 | 31 | 4.9 | 2.20.6 | 0.378 | RX J004402.4+413926 | 1 (X) |
| n1-81 | 0:44:22.64 | 41:45:06.7 | 134 | 12.6 | 6.50.7 | 0.804 | LGSJ004422.6+414507 | new (*) |
| n1-82 | 0:44:25.56 | 41:36:35.2 | 27 | 4.3 | 1.90.5 | 0.774 | foreground (V14.8) | new (*) |
| n1-83 | 0:44:38.02 | 41:45:14.4 | 132 | 11.1 | 6.30.8 | 0.766 | [B90] 265 | 9 (Radio) |
| n1-84 | 0:44:48.88 | 41:47:27.9 | 71 | 4.8 | 3.50.8 | 0.142 | new | new (X) |
| n1-61 | 0:45:11.18 | 41:45:56.4 | 97 | 4.7 | 4.81.1 | 0.282 | RX J004510.9+414557 | 1 (X) |
| n1-85 | 0:45:28.05 | 41:54:10.9 | 101 | 4.1 | 7.92.0 | 2.281 | SNR90 | 12 (SNR) |
| n1-17 | 0:45:45.61 | 41:39:41.6 | 5289 | 118.4 | 496.78.0 | 11.743 | Bol 375 | 6 (GC) |
| n1-59 | 0:45:45.76 | 41:50:30.1 | 54 | 8.6 | 5.00.8 | 0.681 | LGSJ004545.9+415030 | new (*) |
a Column 1 provides the object name that we use to reference the object in this paper. Identical sources have the same names in Kong et al. (2002a) and Di Stefano et al. (2003). The prefix r1 designates objects in a square region 2′ 2′ centered on the nucleus; r2 designates objects outside of r1 but within a square region 8′ 8′ centered on the nucleus; r3 designates objects outside of r2 but within a square region 23′ 23′ centered on the nucleus; n1 designates objects outside of r3, north of the nucleus but south of DEC = 42:01:00 (J2000); n2 designates objects north of DEC = 42:01:00 (J2000); s1 designates objects outside of r3, south of the nucleus but north of DEC = 40:31:22 (J2000); s2 designates objects south of DEC = 40:31:22 (J2000). New objects within these regions are numbered consecutively starting from the highest published number in either Kong et al. (2002a) or Di Stefano et al. (2003). The IAU sanctioned names for the sources can be formulated by applying the RA and DEC to the prefix CXOM31. For example, the proper name of s1-74 is CXOM31 J003956.3+404100.
b Columns 2 and 3 provide the Right Ascension and Declination of the sources in J2000 coordinates.
c Column 4 shows the total net counts in the detection of the source.
d Column 5 gives the measured by wavdetect.
e Column 6 provides the mean luminosity for the source over all epochs in units of 10. This luminosity was calculated by multiplying the measured flux by the conversion factor discussed in §2.3.
f Column 7 lists the resulting from a fit of the measured counting rate to a constant source at the mean rate. A value greater than 1.47 indicates that the source has a 90% chance of being variable.
g Column 8 gives counterparts found at other wavelengths and in previous X-ray surveys. If the object was detected in previous X-ray surveys as well as in other wavelengths, the optical (or, in one case, radio) counterpart is listed. If the object has no known counterpart outside of the X-ray band, the earliest detection is listed as the X-ray counterpart. With the exception of the “mita” prefix, counterpart names are IAU names taken from the Simbad database (http://simbad.u-strasbg.fr/). X-ray sources with no previous detections and no optical counterparts are labeled “new”.
h Column 9 provides the reference to the object listed in Column 8, followed by an abbreviation in parentheses. The reference codes are as follows: 1: Supper et al. (2001); 2: Primini et al. (1993); 3: Trinchieri & Fabbiano (1991); 4: Walterbos & Braun (1992); 5: Ford & Jacoby (1978); 6: Battistini et al. (1987); 7: Brown et al. (2000); 8: Brown et al. (1998); 9: Braun (1990); 11: Dodorico et al. (1980); 12: Williams et al. (1995); 13: Mochejska et al. (2001); 14: Magnier (1993); 15: Kong et al. (2002a); 16: Voges et al. (1999); 17: Meyssonnier et al. (1993); 18: de Vaucouleurs & Corwin (1985); 19: Osborne et al. (2001); 20: Wirth et al. (1985); 21: Kaaret (2002); 22: Garcia et al. (2000b); 23: Perlman et al. (1996); SSS,QSS: These are supersoft sources and quasisoft sources in the catalog of Di Stefano et al. (2003); new: this work. New X-ray sources (labeled with an (X)) were seen for the first time in this data set. New optical counterparts (labeled with a (*)) were found by searching the Local Group Survey data on the M31 disk (Massey et al., 2001), or they are new X-ray sources that have no optical counterparts.
i The abbreviations in parentheses indicate the
following object types:
(*) The source has a stellar counterpart.
(X) The source has no optical counterpart, but a previous X-ray
detection is listed.
(GC) The X-ray source lies in a known M31 globular cluster.
(SNR) The X-ray source position is coincident with a known M31
supernova remnant.
(PN) The X-ray source position is coincident with a known, unconfirmed
M31 planetary nebula. These may be misidentified SNR.
(BLL) The X-ray source position is coincident with a BL Lac candidate.
(Radio) The source has also been detected in the radio.
(?) The source has a counterpart of unknown nature.
| Sample | aaThe slope of the CLF below the break luminosity. | () | bbThe slope of the CLF above the break luminosity. | ConfidenceccThe fraction of Monte Carlo tests with fits statistically worse than the fit to our sample. |
|---|---|---|---|---|
| Disk | 0.60.3 | 2.6 | 1.5 | 0.44 |
| Bulge (w/o GCs) | 0.50.2 | 7.0 | 1.7 | 0.50 |
| Bulge (w/ GCs) | 0.50.2 | 7.1 | 1.9 | 0.47 |
| Bulge (w/o Transients) | 0.40.2 | 7.0 | 1.8 | 0.35 |
| Sample | () | ConfidencebbThe fraction of Monte Carlo tests with fits statistically worse than the fit to our sample. | |
|---|---|---|---|
| Disk | 4.0 | 0.90.1 | 0.29 |
| Disk | 1.3 | 1.40.2 | 0.93 |
| GCs | 1.3 | 0.840.03 | 1.00 |
| OBJaa labels denote transient events in the M31 bulge (within 7′ of the nucleus). | PeakbbPeak luminosities are taken from the brightest observed epoch. (10 | Active Epochs | QccThe 1 upper limit of the quiescent luminosity from combined quiescent epochs (number of quiescent epochs given in parenthesis). (10) (epochs) | Peak/Q |
|---|---|---|---|---|
| s1-79 | 152.8913.81 | 1,3,4,5 | 2.33 (7) | 66 |
| s1-80 | 166.4817.98 | 1,17 | 1.34 (11) | 124 |
| r3-12511Object detected at 1037 in Primini et al. (1993), but undetected with upper limit of 51035 in Kong et al. (2002a). | 15.968.12 | 9,11 | 0.38 (11) | 42 |
| r3-46 () | 36.7010.03 | 8,9 | 1.57 (9) | 23 |
| s1-82 | 16.458.02 | 1 | 1.83 (10) | 9 |
| r2-29 () | 38.789.76 | 7 | 0.43 (12) | 90 |
| r2-28 () | 15.892.87 | 2,3 | 1.60 (11) | 10 |
| s1-1 | 27.509.75 | 14,15,16 | 2.44 (9) | 11 |
| r1-34 () | 42.981.31 | 14,15 | 2.10 (10) | 20 |
| s1-85 | 148.2016.57 | 9,10 | 1.80 (9) | 82 |
| r2-69 () | 29.158.87 | 10 | 0.66 (10) | 44 |
| r2-8 () | 23.838.19 | 9,10,11 | 0.18 (10) | 132 |
| r2-67 () | 340.863.68 | 14,15,16 | 0.81 (10) | 421 |
| r3-115 () | 31.8610.23 | 16 | 1.40 (8) | 23 |
| r3-12622Known repeating transient SSS (Osborne et al., 2001). | 57.5511.62 | 6,7 | 0.11 (8) | 52 |
| n1-8533Known repeating transient SSS (White et al., 1995). | 61.7512.35 | 14 | 2.02 (11) | 34 |
| n1-59 | 33.1013.88 | 10 | 1.16 (10) | 29 |
| OBJ | Angular Separation (′′) | B | V |
|---|---|---|---|
| s1-74 | 2 | 14.7 | |
| s1-75aas1-75 is a known BL Lac candidate. | 0.48 | 21.460.11 | 20.450.11 |
| s1-76 | 20.7 | ||
| s1-78 | 0.85 | 20.670.11 | 20.110.11 |
| s2-63 | 20.9 | ||
| s1-45 | 2 | 14.7 | |
| s1-34 | 21.3 | ||
| s1-64 | 1.6 | 21.120.14 | 21.230.14 |
| r2-24 | 19.5 | ||
| r3-31 | 20.35 | ||
| r1-30 | 19.5 | ||
| r2-18 | 19.5 | ||
| r2-16 | 19.5 | ||
| r3-28 | 1.3 | 21.960.16 | 22.390.35 |
| r1-2 | 19.5 | ||
| r3-25 | 20.75 | ||
| r2-14 | 19.5 | ||
| r2-13 | 19.5 | ||
| r3-69 | 20.75 | ||
| r2-10 | 19.5 | ||
| r3-23 | 20.75 | ||
| r2-8 | 1.21 | 21.800.16 | 20.980.16 |
| n1-76 | 20.9 | ||
| r2-67 | 0.54 | 22.340.27 | 21.890.11 |
| r3-67 | 20.1 | ||
| r3-115 | 1.8 | 23.300.41 | 21.960.10 |
| r3-16 | 0.73 | 19.070.14 | 18.840.13 |
| r3-13 | 1.04 | 21.300.17 | 21.280.15 |
| r3-9 | 20.1 | ||
| r3-8 | 20.1 | ||
| r3-126 | 20.1 | ||
| r3-7 | 1.51 | 20.640.14 | 20.560.14 |
| r3-63 | 20.55 | ||
| n1-77 | 20.45 | ||
| n1-79 | 20.7 | ||
| n1-80 | 21.4 | ||
| n1-81 | 0.49 | 21.090.11 | 20.580.11 |
| n1-82 | 1.32 | 15.510.10 | 14.950.10 |
| n1-83 | 21.7 | ||
| n1-84 | 21.6 | ||
| n1-61 | 21.5 | ||
| n1-59 | 1.50 | 17.880.10 | 17.150.10 |
| Date | Filter | Exposure (s) | magnitude |
|---|---|---|---|
| 2000-10-06 | 300 | 22.340.27 | |
| 2001-09-18 | 300 | 21.890.11 | |
| 2001-11-05 | F336W (U) | 4000 | 22.320.15 |
| 2001-12-02 | F336W (U) | 4000 | 22.320.11 |
| 2002-02-04 | F336W (U) | 4000 | 22.8 |
| Date | Filter | Exposure (s) | magnitude |
|---|---|---|---|
| 2000-10-06 | 300 | 19.070.14 | |
| 2001-08-27 | F336W (U) | 4000 | 20.820.06 |
| 2001-09-18 | 300 | 18.840.13 | |
| 2001-12-02 | F336W (U) | 4000 | 20.820.06 |
| 2002-01-08 | F336W (U) | 4000 | 21.110.02 |
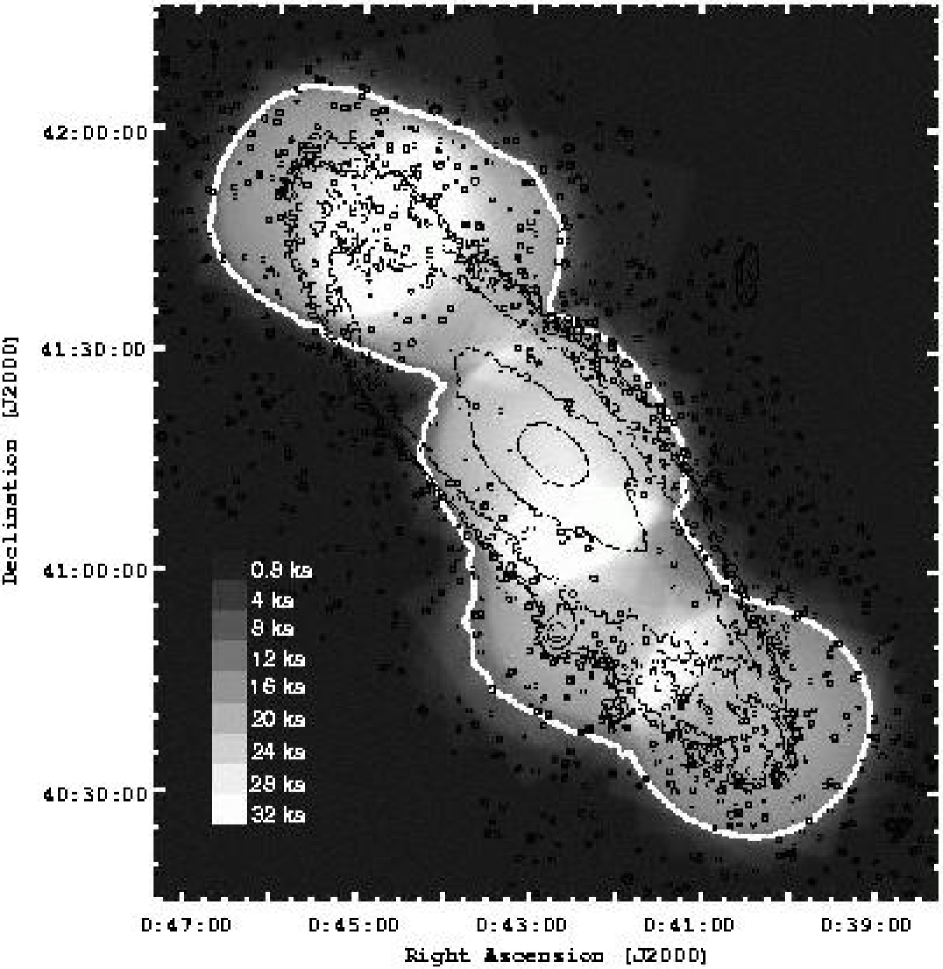
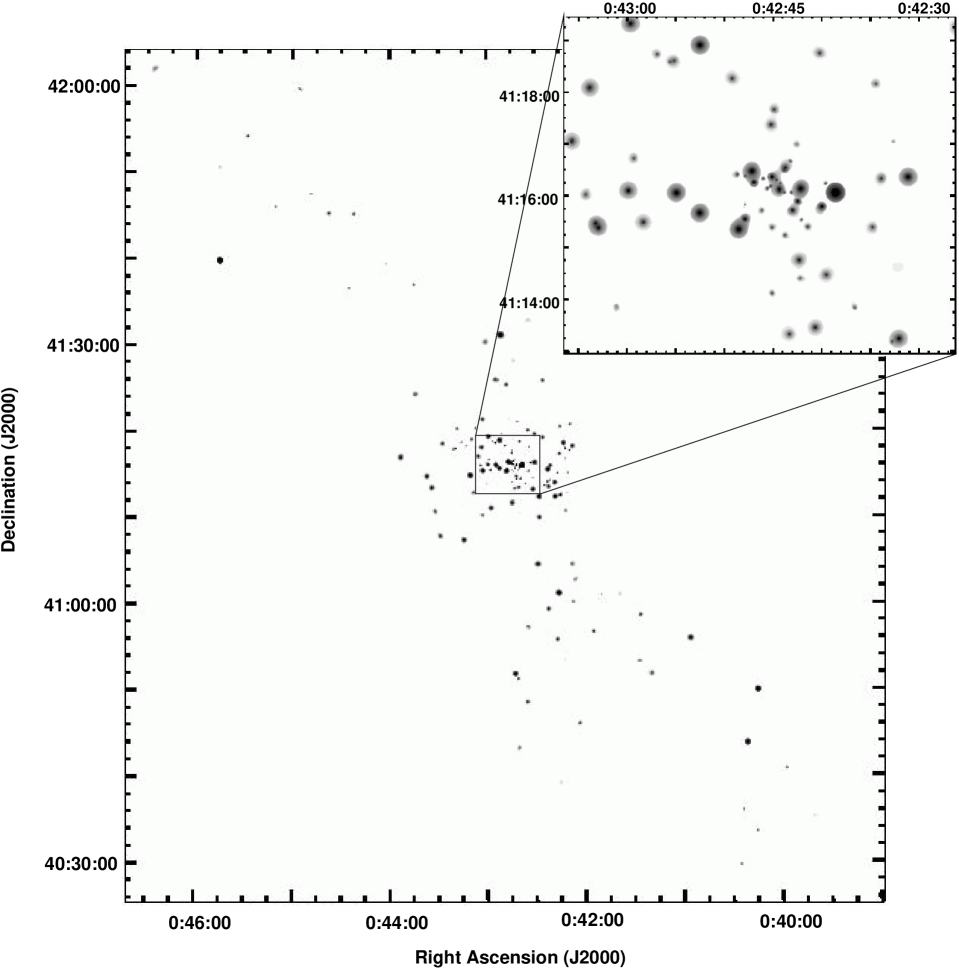


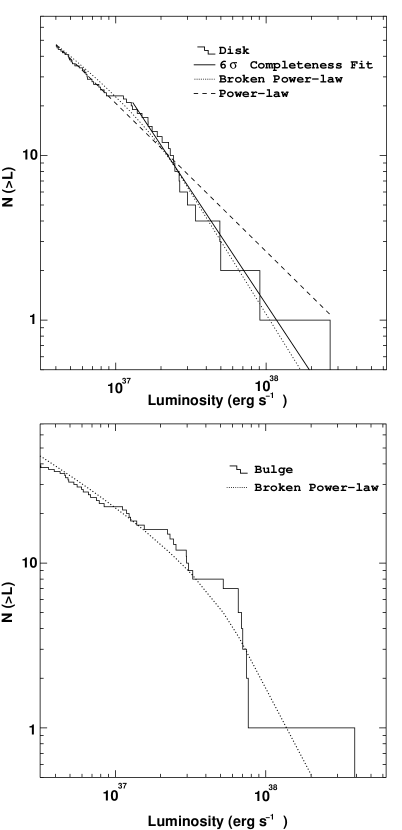
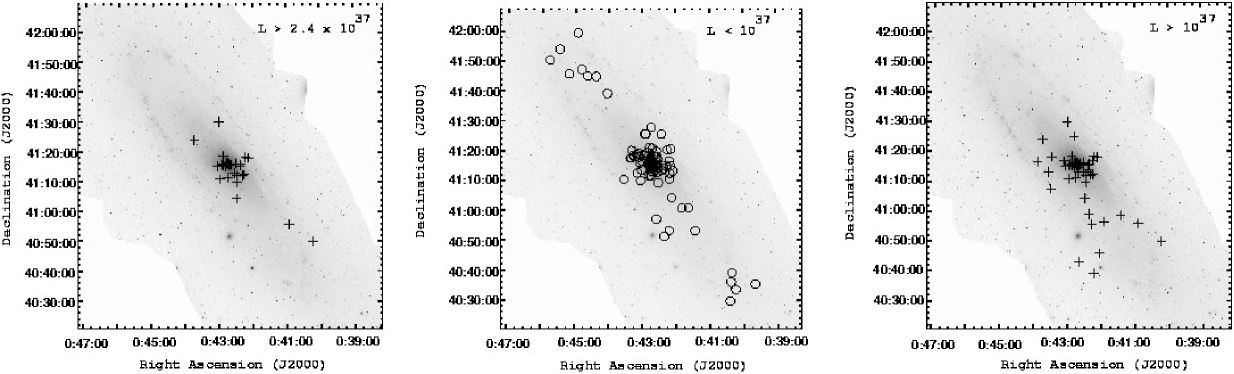
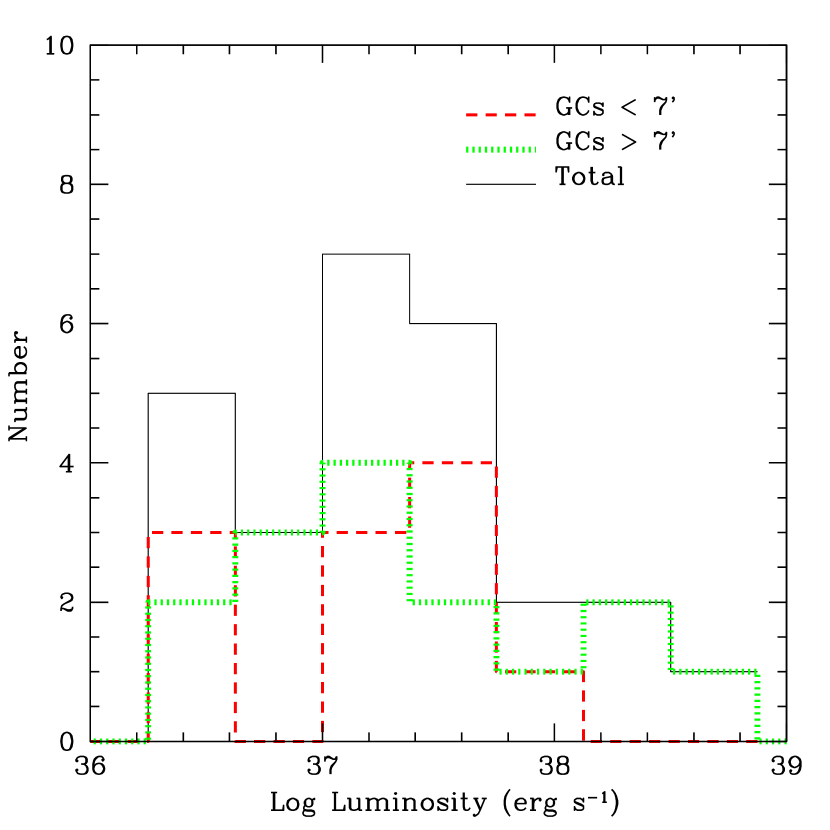


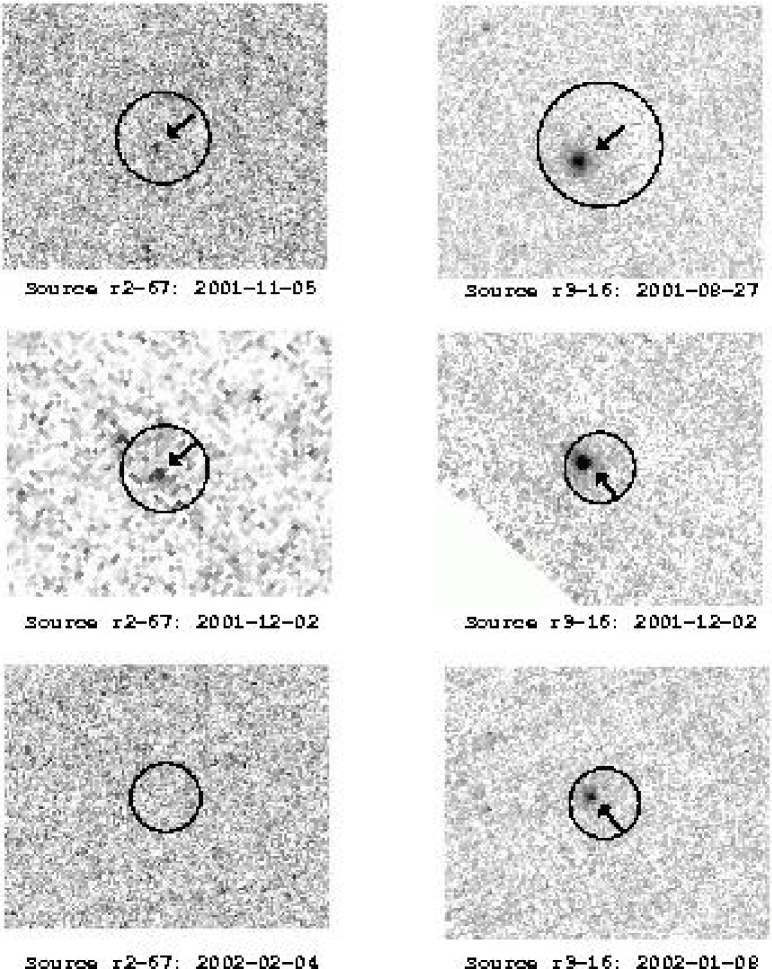


APPENDIX
In fitting the ACIS-I spectrum of r2-67 from OBSID 1585 using a pileup model, we limit ourselves to the 0.3–7.0 keV range in order to exclude background counts, and we include the ‘afterglow’ events, which account for 92 of the 866 total good events. We do not find a clear change in ACIS grades in radial averaged profiles but note that this is likely due to our much lower counting rate than that seen from GX 13+1 (Smith et al., 2002).
Given the high luminosity of the source during the outburst, we should expect the source to show a thermal spectrum in the shape of a disk blackbody (McClintock & Remillard, 2004; Mitsuda et al., 1984) rather than a power-law. However, fits to both shapes while neglecting pileup may yield useful comparisons to fits including pileup. Fits to a disk blackbody yield (probability ), keV, cm2. Fits to a power-law find , , cm2. Both these fits show a clear excess of counts between 2 and 3 keV, which is indicative of pileup (Nowak, 2002). A simple blackbody is a very poor representation of the data, yielding at best .
Because the pileup model was first developed within ISIS and later incorporated into Sherpa and XSPEC, we used ISIS to determine the pileup parameters. Allowing the pileup and spectral model parameters to vary (but freezing the PSF fraction to 0.95), ISIS quickly converges to a model with 30% pileup, a grade migration parameter . With the pileup parameters frozen at the best values, ISIS finds spectral parameters of keV, , and cm-2 with = 1.2 (probability=0.2), where is the temperature of the inner edge of the accretion disk, is the normalization parameter, is the distance to the source, and is the inclination angle of the disk. The contours are shown in Figure 15. The observed flux is 1.3 10-12 (0.3-7.0 keV), and the modeled emitted luminosity is (0.3-7.0 keV).
We note that when pile-up is included, we are not able to rule-out a power-law model solely on the basis of . A power-law fit gives a slightly lower , a slope , a much higher cm2, but has an acceptable . While this model has the same observed flux, the steep slope and higher predicts a higher emitted luminosity of . We discount the power-law model for three reasons. First, it is not the thermal form expected at this high flux. Second, the is inconsistent with that measured for the same source many months later. Third, this high predicts and the unreasonable high absolute magnitude of M for the HST counterpart.
Fits with XSPEC produced similar results, but were more sensitive to the initial guesses for the spectral parameters and were insensitive to the value of . We therefore fixed to 0.99 and and the PSF fraction to 0.95. The best fit disk black body finds , cm2, both of which overlap with the ISIS determined values.
Fits with Sherpa and the pileup model produced spectral parameters consistent with those determined by ISIS. Sherpa found a pileup grade migration parameter and a pileup fraction of 30%. The best fit disk spectral parameters were keV and cm-2 , with = 1.3 (probability=0.1).
One check on the results of the pileup model fits which has been used previously is to extract the spectrum of the source from only with wings of the PSF, where the counting rate is low enough that pileup can be ignored (Swartz et al., 2003 on M81). While this can give a qualitative measure, the absolute value of the parameters determined this way must be treated with care because hard photons are preferentially scattered into the wings of the PSF and the current effective area tools (i.e. mkarf) do not take this into account (i.e. Smith et al., 2002).
We tried ignoring pileup and removing the central pixel only and using the surrounding 8 pixels (leaving 450 counts), and removing the central 9 pixels and using the surrounding 40 (leaving 107 counts). The first method yields (prob = 14%) and shows a significant excess (45% above model) of counts between 2 and 3 keV. The best fit values are T keV and . The second method yields (prob = 5%) and similar excess between 2 and 3 keV. The best fit values are T keV and .
Removing the central pixel(s) appears to decrease the amount of pileup, as evidenced by the slight decrease in the excess (above model) of counts between 2 and 3 keV. However, the fitted temperatures are much higher than and completely inconsistent with the temperature found using all the data and accounting for pileup. It is unclear to us if these erroneously high temperatures are due to the scattering of hard photons into the wings or due to ignoring the effects of pileup, since both have the effect of hardening the fitted spectrum.