Star formation and Asymmetry in the spiral arms of M51 – Variable star formation caused by more than one spiral density wave
Abstract
In the inner 3kpc of M51 we find that logarithmic spirals provide good fits to the peak intensities in molecular gas observed by BIMA in the CO (J=1-0) emission line along the spiral arms. However, we measure significant asymmetries between the location and density of the arms observed on one side of the galaxy compared to those on the opposite side. Between a radius of 1 and 2.2 kpc the gas distribution traced in CO is lopsided with densities twice as large in one arm compared to the opposite one. In the same region, the spiral arms are offset by 20 degrees from the position of the arm on the opposite side of the galaxy after a rotation of 180 degrees. We use the ratio of CO emission to that in the Pa hydrogen recombination line to estimate the efficiency of star formation along each arm. Except for a narrow region at about 2kpc where star formation is surprisingly inefficient, the gas depletion time is approximately 200 million years despite large variations in the molecular gas density in the arms.
We account for the deviations from two armed bi-symmetric structure with a simple model that includes an additional three-armed spiral density wave. This model accounts for the angular offset between the arm on one side compared to its opposite, the lopsided distribution in molecular gas, and inter-arm star formation to the north east of the galaxy nucleus. Since the star formation efficiency is unaffected by the variations in gas density, and the variations in gas density can be accounted for by the presence of an additional three-armed density wave, we suggest that the star formation rate is variable, and is highest where and when the maxima of the two spiral density waves coincide or constructively add. The inner region of M51 provides good evidence for the presence of more than one spiral density wave and a resulting variable rate of star formation.
1 Introduction
The evolution of galaxies is influenced by how quickly gas is consumed by the formation of stars. Many empirical star formation recipes assume that the star formation rate depends on the gas surface density (e.g., Kennicutt 1998). However, observations of spiral galaxies show that the molecular gas is concentrated along spiral arms, implying that star formation is triggered by the spiral structure itself. The strongest evidence for the important role of spiral structure is based on a gravitational stability threshold, below which star formation ceases (Kennicutt, 1989). Nevertheless, above this threshold, azimuthally averaged data have shown that these empirical star formation laws are obeyed (Wong & Blitz 2002, Martin & Kennicutt 2001). In this paper we make use of recent high resolution mapping to estimate the rate and efficiency of star formation along individual spiral arms. We aim to investigate the influence of the spiral structure itself on the process of star formation.
M51 is a magnificent example of a nearby grand design spiral galaxy. Because of its large angular size and strong two-armed spiral structure, it has been the focus of studies of spiral density wave driven star formation (e.g., Tilanus & Allen 1991, Rand et al. 1992). While the stellar density contrast in the spiral arms in M51 is high compared to many spiral galaxies (Rix & Rieke, 1993), it is still far below the density contrasts seen in molecular or ionized gas. The distribution of molecular gas and associated star formation are particularly sensitive to the underlying spiral density waves propagating through the galaxy. Rix & Rieke (1993) in their Fourier analysis of the K-band light distribution measured significant deviations from bi-symmetric () symmetry in the galaxy. Because shocks occur in molecular gas, even weak perturbations in the stellar density distribution can cause large density variations in the molecular gas distribution. By measuring the shape and location of the peak densities seen in molecular gas, and comparing the shapes of the spiral arms with the star formation rates measured from the Pa emission, we probe for differences in star formation rate and efficiency that might be caused by the spiral density waves themselves.
In this paper we take advantage of recent high angular resolution observations of M51 to measure the star formation efficiency along individual spiral arms. The BIMA Survey of Nearby Galaxies (BIMA-SONG, Helfer et al. 2003) is the first systematic interferometric survey of the disks of nearby galaxies in the CO(J=1-0) emission line. Prior to BIMA-SONG, the overwhelming majority of galaxies observed in CO had been observed with single dish telescopes, at much lower angular resolution. With a typical beam full width half max of , BIMA-SONG represents a major improvement in our ability to resolve the molecular gas distribution in a significant sample of nearby galaxies.
To measure the gas depletion time, which is inversely related to the star formation efficiency, we combine a measurement of the gas density with an estimate of the star formation rate. To measure the star formation rate, we use archival NICMOS data in the Pa recombination line, at 1.87m. The Pa recombination line is better suited toward probing the possibly obscured central regions, since the near infrared is less affected by dust extinction. The high angular resolution of the NICMOS images on board HST facilitates continuum subtraction in crowded regions.
In Section 2, we describe the archival observations used for this study. To measure quantities along spiral arms, we must first determine their locations. In section 3.1 we describe our procedure for doing this and discuss our measurements that describe the shape of the arms. In section 3.2 we discuss the relative differences in gas density, star formation rate and gas depletion time measured in different spiral arm regions. In section 3.3 we discuss the effect of a possible additional spiral density wave on the gas density and on the symmetry of the spiral arms previously identified. A summary and discussion follows.
For M51 we adopt a distance of 7.7 Mpc (Tully, 1988), so on the sky corresponds to a distance of 37 pc.
2 Observations
NICMOS narrow band (F187N and F190N) images were obtained as part of the NICMOS GTO program (Scoville et al., 2001) with a mosaic of nine fields covering an area of about . See Scoville et al. (2001) for more information about these observations. The F187N and F190N filters, with effective wavelengths of 1.87 and 1.90m contain Pa line and continuum images, respectively. We scaled and subtracted the F190N continuum images from the F187N images and combined them to form one mosaic. The pixel scale of the NICMOS images is , so one pixel is 7.6 pc long in M51. The NICMOS images were calibrated using zero points listed in the HST Data Handbook. Specifically, we used erg cm-2 s-1/(DN s-1) for the continuum subtracted F187N narrow band images.
The BIMA-SONG database contains a collection of spatial velocity data cubes. For this study, we used an image made of the intensity integrated over all velocity channels. For M51, large scale fluxes were recovered in the interferometric data from single dish observations (Helfer et al., 2003).
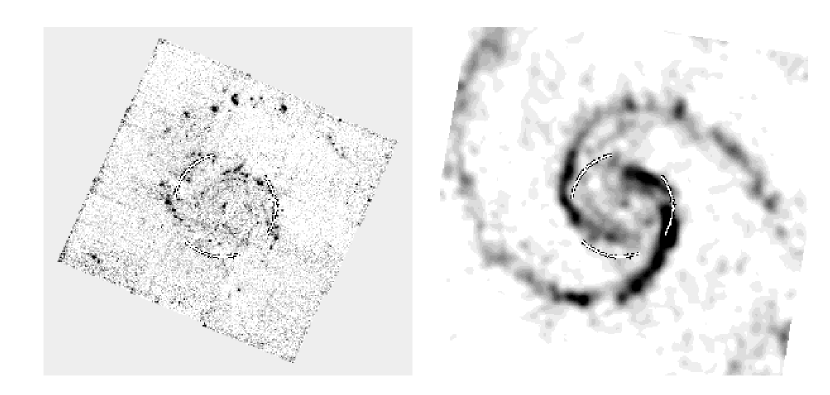
To compare the CO image to the Pa image we must ensure that the same areas of the sky can be measured on the same scale. Therefore, we resampled the CO image to be at the same pixel scale as the Pa mosaic. Both images are inclination corrected and rotated so that the minor axis is at a P.A. of 170 degrees. The resulting images are shown in Figures 1 and 2.
3 Results
3.1 Logarithmic Spirals
To determine the location of the spiral arms, we model the spiral density waves in the disk with the following function, that describes a logarithmic spiral
| (1) |
where describes how tightly wound the arm is, is an angular offset, and is an integer that corresponds to the number of spiral arms. In the case of M51, the spiral structure is predominantly two armed (). One maximum is then described by
| (2) |
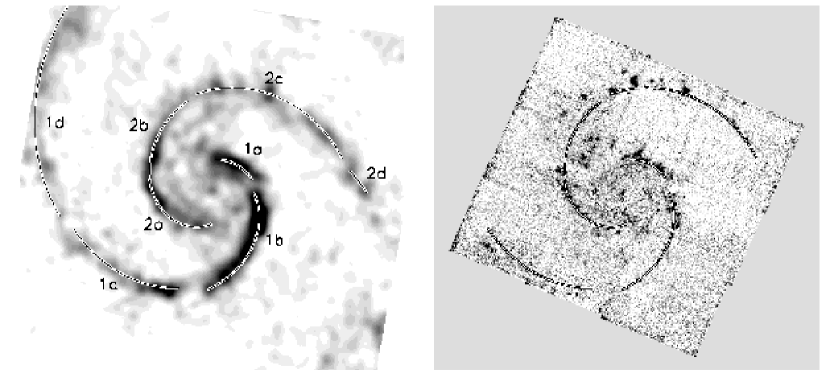
For each region we measured parameters and by choosing several positions of peak intensity along the spiral arms in the CO intensity map. All positions were measured from the center of the galaxy, which was determined from the centroid of an H band (F160W) image of M51 that was observed simultaneously with the Pa data (Scoville et al., 2001). Since the nuclear region of M51 contains little molecular gas (see Figure 1), the H band centroid accurately measures the location of the stellar density peak. We defined the angle to be toward the right in Figures 1 and 2. From these measurements, sets of coordinates, (), were measured in each arm. Linear regression was used to determine and in each region. Different regions in the spiral arms were fit separately, as a single spiral did not provide an adequate fit to the entire galaxy. The fits to the 8 selected spiral sub-regions are illustrated in Figure 1, and the corresponding parameters that describe them, are listed in Table 1.
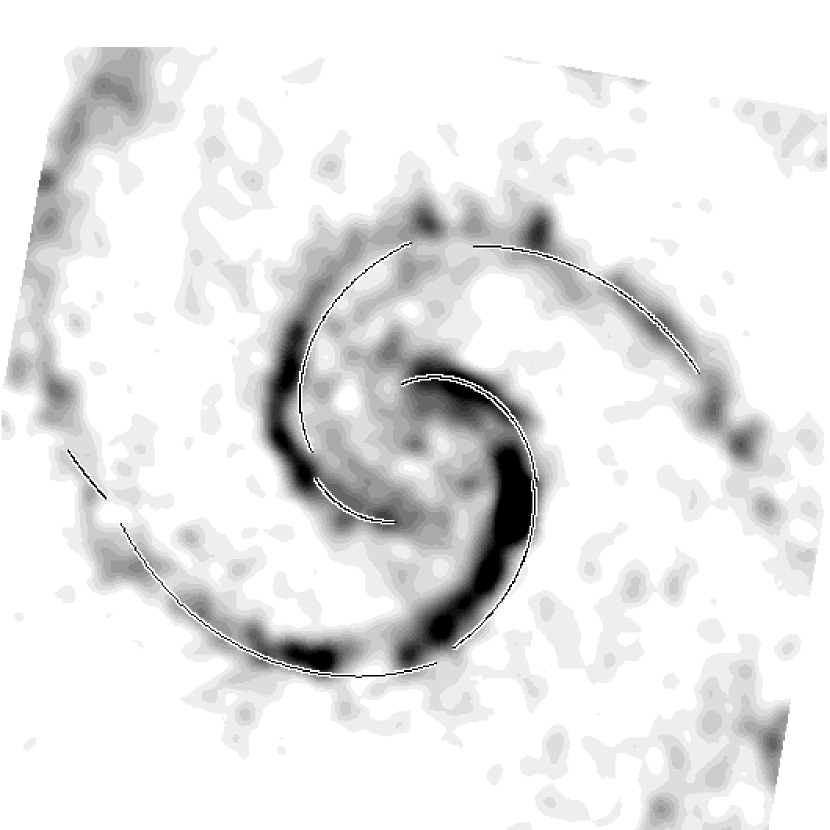
In Figure 2 we compare our fit to the spiral arms traced in CO to the Pa emission. While the Pa is coincident with the molecular gas in some of the spiral arms, in other regions an offset is observed. Tilanus & Allen (1991) and Rand et al. (1992) noted an offset between CO and H in the sense that H emission was at somewhat larger radii than the CO emission. We find that the Pa emission is offset from the CO emission at radii 1.2 to 2.8 kpc in the spiral arms 2b and 2c. However, we cannot tell if there is an offset between the Pa emission and CO emission in spiral arm 1c because the edge of the Pa image is near the position of the CO emission. We do note hints of Pa emission, to the south of spiral arm 1c, lying on the very edge of the NICMOS mosaic. If there is Pa emission to the south of the mosaic, then a significant offset between the CO and Pa is present in this arm.
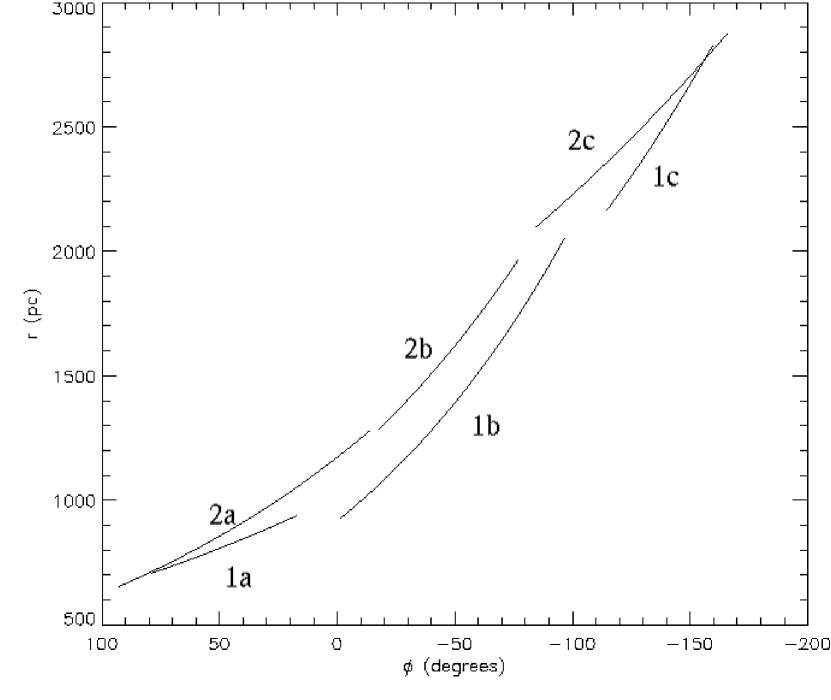
In addition to observing offsets between CO and Pa, we can look for deviations from point symmetry by plotting the reflection of the spiral arms determined in Table 1. In Figure 2 we show the fit to the spiral arms, rotated through an angle of 180 degrees. In the case of perfect symmetry, the over-plotted curve would lie on top of the peak intensities. We observe that the most inner and outer spiral arm regions appear to be symmetric, but for intermediate radii, the observed spiral arms are offset from the curves. To verify this, in Figure 3 we plot as a function of for the a, b, and c spiral arms listed in Table 1, with the northern spiral arm rotated by an angle of 180 degrees. We note that the deviation from point symmetry is present over much of the inner part of the galaxy, but is most apparent for the b spiral arms, where the offset, degrees.
3.2 Star Formation Rates and Gas Depletion Times
In this section we present our measurements of the star formation rate (SFR) and CO mass, per unit length, along each segment of the spiral arms. Figures 4, 5, and 6 show the molecular gas density in each spiral arm segment and the star formation rate per unit length along the spiral arm segments. In addition, we calculated the gas depletion time from the ratio of the CO mass to the star formation rate. To measure these quantities, we used our own IDL procedure to measure the fluxes in particular regions. Each region was centered in radius on the position of a logarithmic spiral curve determined from our study described in section 3.1 (see Figures 1,2). The regions were defined by intervals in and , with radians and pixels or approximately 400 pc. The same regions were used to measure fluxes in both the CO image and the Pa image, so that a one to one comparison could be made at each location. We ensured that was large enough to include the Pa emission, where offsets between Pa and CO were observed. The measured fluxes were divided by arc length, so that integrated fluxes were computed per pc along each arm. Background sky values were determined in the Pa image by taking the median of the regions adjacent to each box, on both sides of the spiral arms. Only spiral arm regions 1a, 1b, 2a, 2b, and 2c are compared, as regions 1c, 1d, and 2d do not lie on the NICMOS Pa mosaic.
We next convert to physical units assuming an intrinsic flux ratio of for Case B recombination at a temperature of K and a density cm-3 (line ratios are given in Osterbrock 1989). Then we converted the H fluxes to an star formation rate, using a factor from Kennicutt, Tamblyn, & Congdon (1994),
| (3) |
The CO data were converted to M☉ pc-2 using a CO to H2 conversion factor of H2 cm-2 (K km/s)-1 (Strong & Mattox, 1996).
In Figures 4, 5, and 6, we show the molecular gas mass, star formation rate, and gas depletion time, per unit length, for arms covered by both images. The plots are arranged such that the top plots show the molecular gas mass per pc, along the spiral arm segment. The middle plots show the star formation rate per pc, as measured from the Pa mosaic. The bottom plots show the ratios of the points in the two plots above them. This quantity is known as the gas depletion time, the time in which all of the molecular gas would form into stars, if the star formation rate was to remain constant. In Figure 4, spiral arm 1a was placed next to its opposite spiral arm, 2a, and the same is true for arms 1b and 2b, in Figure 5. In Figure 6, spiral 2c is shown alone, because we were unable to measure Pa emission for spiral arm 1c. Slightly negative star formation rates, the result of imperfect sky subtraction in the Pa image, are assumed to be sites where essentially no stars are being formed.
Figures 4 and 5 can be used to look for differences in the gas density and star formation efficiency between a spiral arm and its partner on the opposite side of the galaxy. In Figure 4 we note that the gas density is twice as high on NW side (1a) than the SE side (2a). However, the star formation efficiency is about the same with a gas depletion time years. In Figure 5 we note a similarity, in the sense that the gas density is again twice as high in the western spiral arm (1b) as in the eastern spiral arm (2b). Both spiral arms 1b and 2b have a jump in gas depletion time (a decrease in star formation efficiency), at a radius of 1.5 kpc. At radii smaller than 1.5 kpc, the gas depletion time in spiral arm regions 1b and 2b is similar to that in 1a and 2a. At larger radii the gas depletion time is several times larger than within this radius. Star formation in the outer parts of spiral arms 1b and 2b is inefficient compared to that in the inner parts of the same arms. Past a radius of 2 kpc the gas depletion time drops back to years, and remains similar in spiral arm 2c. We suspect that the star formation efficiency in arm 1c would be similar to that in 2c, although we are unable to observe it.
Except for the outer parts of spiral arms 1b and 2b at a radius of about 1.5 to 2kpc, the star formation efficiency or gas depletion time is remarkably similar in all arms, and approximately yr, despite large variations in gas density and the star formation rate. In the outer parts of 1b and 2b the gas depletion time is longer, years, despite the high molecular gas densities in these arms.
3.3 Deviations from symmetry
In this section we consider a dynamical model that can explain the degree of deviation from symmetry that we have measured in the spiral arms of M51. By expanding galaxy images in Fourier components, Elmegreen et al. (1992) noted that many galaxies exhibit hidden three armed components and consequently suggested that multiple spiral density waves often propagate simultaneously in galaxy disks. Rix & Rieke (1993) in their Fourier expansion of the near-infrared images of M51 saw both and components as well as the dominant 2-armed structure. Rix & Rieke (1993) found that the galaxy was lopsided at all radii but also measured a weak peak in the component of the K-band images at a radius of about . This radius is approximately at the location where we have found the largest asymmetry in the spiral structure, although from Figure 3 we note that the asymmetry is present throughout most of the galaxy.
We now consider the possibility that more than one spiral density wave pattern is present in the disk of M51. Below we estimate the likely position of molecular gas along spiral arms resulting from more than one perturbation. We assume that the perturbations in the gravitational potential resulting from spiral modes can be described in terms of Fourier components
| (4) |
where and are amplitude and phase shift, and describes an armed logarithmic spiral (see section 3.1). Because spiral density waves travel at pattern speeds above the sound speed in the interstellar medium, the passage of spiral modes in the disk causes shocks in the gas. The concentration of molecular clouds along spiral arms is interpreted to be a result of these galactic scale shocks. Shocks in the gas are likely to occur near maxima in the stellar density field, approximately corresponding to minima in the gravitational potential. These are found at angles where or
| (5) |
This equation is also valid at potential maxima where shocks will not occur. We assume that one spiral component dominates; in the case of M51 this would be the or two-armed mode. In the absence of other modes, the potential minima (density maxima) occur near angles
| (6) |
where is an integer. We expand Equation 5 about the angle , for , where the offset, , is the difference between the location of density maximum caused by only one wave and that resulting from two spiral density waves. To first order in ,
| (7) |
where we have assumed only one spiral density wave with , in addition to the dominant two-armed one. We solve for
| (8) |
Substituting for (Equation 6) and taking the limit
| (9) |
We use our model to estimate the angular offset that would be measured between a spiral arm and its opposite one after a rotation of 180 degrees. For a dominant two-armed mode, each arm has a different integer in Equation (9); or . Only when is odd will the angular offsets be asymmetric, causing reflection symmetry about the origin to be broken. The angular offset between one spiral arm and the other that has been rotated about is then given by subtracting the offset from that of the opposite one (),
| (10) |
for odd . We expect that the angular difference depends upon the amplitude of the additional spiral density wave and on its wave number. The angular offset should increase as the amplitude of the additional spiral density wave increases. In a region where the amplitudes of the two dominant spiral density waves are constant, we expect that the angular offset would be more open (less tightly wound) than the spiral density waves themselves.
We now relate the size of the angular offset to the one expected based on observed density perturbations or observed Fourier components. In the WKB approximation where is magnitude of the th Fourier component of the mass surface density (Binney & Tremaine, 1987), so that
| (11) |
Substituting this into equation(9) and using the ratios , , and at measured by (Rix & Rieke, 1993) we estimate
| (12) |
where the angles are given in radians. Assuming , and for a maximum value of the angular offsets ( with respect to ) the angular shift could be as large as 60 degrees for , and 20 degrees for .
We compare the estimated model angular offsets to those we measured in M51. Recalling from Figure 3, the offset measured between the 1b and 2b spiral arms is degrees. So the Fourier component observed by Rix & Rieke (1993) is sufficiently large to account for the angular offset we measured between these two arms. A three-armed mode, in addition to the dominant two-armed one, consistent with perturbations seen in the K-band Fourier components, could explain the asymmetry in the locations of the two spiral arms seen in molecular gas. Figure 3 shows that while the asymmetry is present over much of the galaxy, the maximum offset occurs where Rix & Rieke (1993) observe a peak in the mode. The mode, on the other hand, is strong over much of the entire galaxy and does not single out any particular radial region, though it could be responsible for asymmetry at larger and smaller radii, where the amplitude is weak. The decrease of the angular offset at small and large radii (kpc and kpc) can be explained by the decrease in amplitude of the wave. The nearly constant value of the angular offset between and kpc suggests that the wave numbers of the and modes are approximately the same size (, see equation 12).
If there is both and waves, then at least one density peak of the wave will lie in between the dominant arms. We might expect inter-arm molecular gas and associated inter-arm star formation in the same region where we see the deviations from bi-symmetry. A more careful inspection of Figure 1 shows that there is a patch of interarm star formation within spiral arm 2b to the north east of the nucleus. As we have done for the molecular gas distribution (see Section 3.1), we crudely fit a spiral shape to the the Pa emission in this region. The resulting fit is shown in Figure 7, along with the same arm rotated by 120 and 240 degrees. From this figure, we can determine where the and waves are likely to constructively add and where they interfere. The wave is coincident with the dominant spiral arm in the west (1a-1b), but is offset from the spiral arm in the southeast (2a-2b). We find that the wave can account for the molecular gas density enhancement in the western spiral arms, relative to the eastern spiral arms (see Figures 4, 5, and 6).
The addition of an extra wave should also introduce an asymmetry in the velocity field. If this asymmetry is sufficiently large then it could be detected in the CO velocity field. To search for this we examined the mean velocity MOM1 BIMA map of M51. We first subtracted the systemic velocity of the galaxy from the velocity field and then compared this field to the same field that has been rotated by 180 degrees and multiplied by . We find that the line of sight velocity on the southern side of the galaxy 2kpc from the nucleus is about 20-30 km/s above that on the opposite side. The velocity asymmetry seems to be largest in the same region where we see the other asymmetries. The magnitude of the velocity asymmetry should be something that our simple model could predict. However, it depends on the pattern speed of the two waves and the details of the gas dynamics so a simulation is probably required to make a prediction sufficiently accurate to compare to the complex streaming motions seen in the CO channel maps.
4 Summary and Discussion
In this paper we have fit the spiral arms of M51 as traced in CO within 3kpc of the nucleus with logarithmic spirals. We have detected an asymmetry between the locations of the arms on one side of the galaxy compared to those on opposite side. The asymmetry corresponds to a maximum angular offset of about degrees between one arm and the opposite one rotated by 180 degrees, and is most prominent between 1 and 2.2 kpc from the nucleus. The molecular gas density in this region is also asymmetric with one spiral arm about twice as dense as that on the opposite side. In the same radial region, there is a patch of star formation (seen in the Pa images located between the dominant spiral arms to the north east of the galaxy nucleus.
To explain the angular offset seen between one arm and the opposite one rotated by , we consider a model that contains two spiral density waves; a weak -armed wave in addition to the dominant two-armed one. When the additional wave is odd-armed, we predict that the position of the two dominant arms deviate from point symmetry in the manner we have observed in M51. We find that an additional mode, consistent with the radial location and strength of the Fourier components previously measured at K-band by Rix & Rieke (1993), is strong enough to account for the angular offset we have measured between the two dominant arms. This additional spiral density wave also is consistent with the lopsided distribution of molecular gas, and the inter-arm star formation to the north east of the galaxy nucleus. Despite molecular gas density variations of a factor of a few and corresponding star formation rate variations (measured from the Pa emission), we see little variation in the computed gas depletion times. This suggests that the star formation efficiency is not largely affected by the large gas density variations caused by the presence of an additional spiral density wave.
Between 1 and 2.2 kpc in M51 we see large scale deviation from pure or bi-symmetric structure: an angular offset between the spiral arms, differences in density on one side compared to the other side, and inter-arm star formation. All of these three asymmetries are most pronounced in the same radial region suggesting that they are related. We have suggested here that this phenomena can be explained with one simple unifying model that includes an additional weak 3-armed spiral density wave. The additional wave does not strongly influence the star formation efficiency, however because of the large gas density variations caused by it, the wave does influence the star formation rate. In particular, large molecular gas densities and associated high star formation rates are likely to occur where and when the 3-armed and 2-armed mode both reach their density maxima simultaneously. We expect that the 3-armed wave has a different pattern speed (angular rotation rate) than the 2-armed wave. Consequently the star formation rate which is highest when the 3 and 2 armed patterns constructively add, must be highly variable. Even low amplitude waves can cause large changes in the gas density. Despite the low estimated amplitude of the 3-armed wave () it is likely that it is causing large variations in the molecular gas density, and consequently in the star formation rate. The simultaneous propagation of 2 and 3 armed structure must cause associated large variations in the local star formation rate. Since our model contains more than one spiral density wave we would more strongly support scenarios that include multiple and transient spiral density waves (e.g., Toomre 1981; Fuchs 2001) rather than those that focus on a single dominant quasi-steady mode (e.g., Lowe et al. 1994).
The model containing two and three armed spiral density waves, that we have proposed to explain the asymmetries in the central 3kpc of M51, does not account for all the phenomena we have described in this paper. For example, this model does not account for the drop in star formation efficiency observed in the outer parts of spiral arms 1b and 2b between 1.5 and 2 kpc from the nucleus. It also does not account for the offsets between the CO and Pa emission which are largest at radii greater than 2kpc. Similar offsets have previously been discussed by Rand et al. (1999); Rand (1995); Rand et al. (1992); Tilanus & Allen (1991) who have offered a variety of explanations including the triggering of star formation by spiral density waves, uneven heating and disassociation by the resulting star formation and differential clumping of the molecular gas. However, it will be tempting to search for an additional explanation for these offsets and the decrease in the star formation efficiency we see in the outer arms 1b and 2b that also involve more than one spiral density wave. Spiral structure exists in M51 over a large range of radius. In section 3.1 we attempted to fit as large as possible pieces of the spiral structure with as few as possible individual components. However, it is not clear from Figure 1,2 or 3 that the ranges of radius over which we fit individual arm pieces correspond to separate spiral density waves, traveling at individual pattern speeds. It is likely that the inner spiral arms of M51 rotate at a different pattern speed than the outer ones, and the interplay between these waves might provide an alternative explanation for the offsets observed between the CO and Pa emission or the low star formation efficiency in the outer parts of spiral arms 1b and 2b. Future work can further test the possibility that multiple spiral density waves propagate in galaxies and explore the role that these multiple modes exert on the distribution of gas and resulting pattern of star formation. Future studies can extend this type study carried out here to more galaxies, extend the multi-wavelength coverage and exploit the velocity fields that are available in the CO and HI data.
References
- Binney & Tremaine (1987) Binney, J., & Tremaine, S. 1987, Galactic Dynamics, Princeton University Press, Princeton, NJ
- Elmegreen et al. (1992) Elmegreen, B. G., Elmegreen, D. M., & Montenegro, L. 1992, ApJS, 79, 37
- Fuchs (2001) Fuchs, B. 2001, A&A, 368, 107
- Helfer et al. (2003) Helfer, T. T., Thornley, M. D., Regan, M. W., Wong, T., Sheth, K., Vogel, S. N., Blitz, L., & Bock, D. C.-J. 2003, ApJS, 145, 259
- Kennicutt (1989) Kennicutt, R. C. 1989, ApJ, 344, 685
- Kennicutt (1998) Kennicutt, R. C. 1998, ApJ, 498, 541
- Kennicutt, Tamblyn, & Congdon (1994) Kennicutt, R. C., Tamblyn, P., Congdon, C. E., 1994, ApJ, 435, 22
- Lowe et al. (1994) Lowe, S. A., Roberts, W. W., Yang, J., Bertin, G., Lin, C. C. 1994, ApJ, 427, 184
- Martin & Kennicutt (2001) Martin, C. L., & Kennicutt, R. C. 2001, 555, 301
- Osterbrock (1989) Osterbrock, D.E. 1989, Astrophysics of Gaseous Nebulae and Active Galactic Nuclei, University Science Books, Mill Valley, CA
- Rand et al. (1992) Rand, R. J., Kulkarni, S. R., & Rice, W. 1992, ApJ, 390, 66
- Rand et al. (1999) Rand, R. J., Lord, S. D., & Higdon, J.L. 1999, ApJ, 513, 720
- Rand (1995) Rand, R. J. 1995, AJ, 109, 2444
- Regan et al. (2001) Regan, M. W., et al. 2001, ApJ, 561, 218
- Rix & Rieke (1993) Rix, H. W., & Rieke, M. J. 1993, ApJ, 418, 123
- Scoville et al. (2001) Scoville, N. Z., Polletta, M., Ewald, S., Stolovy, S. R., Thompson, R. & Rieke, M. 2001, ApJ, 122, 3017
- Strong & Mattox (1996) Strong, A. W., Mattox, J. R., 1996, A&A, 308, L21
- Tilanus & Allen (1991) Tilanus, R. P. J., & Allen, R. J. 1991, A&A, 244, 8
- Toomre (1981) Toomre, A. 1981 in S.M. Fall, D. Lynden-Bell (eds.), The Structure and Evolution of Normal Galaxies, Cambridge Univ. Press, Cambridge, p. 111
- Tully (1988) Tully, R. B. 1988, Nearby Galaxies Catalog (Cambridge University Press: New York)
- Wong & Blitz (2002) Wong, T., & Blitz, L. 2002, ApJ, 569, 157


| Spiral Arm Region | range | ||
|---|---|---|---|
| 1a | -7.60 | -0.058 | |
| 1b | -4.08 | -6.10 | |
| 1c | -5.88 | -6.55 | |
| 1d | -4.88 | -6.09 | |
| 2a | -5.54 | -3.58 | |
| 2b | -4.86 | -3.44 | |
| 2c | -9.00 | -5.00 | |
| 2d | -2.98 | -1.78 |
Note. — Logarithmic Spirals are fit to different regions shown in Figure 1. The parameters and are defined in Equation 2, where is in kpc and and are in radians.