11email: wkollat@uni-sw.gwdg.de 22institutetext: Department of Astronomy and McDonald Observatory, University of Texas at Austin, Austin, TX 78712, USA
Accretion disk wind in the AGN broad-line region: Spectroscopically resolved line profile variations in Mrk 110
Detailed line profile variability studies of the narrow line Seyfert 1 galaxy Mrk 110 are presented. We obtained the spectra in a variability campaign carried out with the 9.2m Hobby-Eberly Telescope at McDonald Observatory. The integrated Balmer and Helium (He i, ii) emission lines are delayed by 3 to 33 light days to the optical continuum variations respectively. The outer wings of the line profiles respond much faster to continuum variations than the central regions. The comparison of the observed profile variations with model calculations of different velocity fields indicates an accretion disk structure of the broad line emitting region in Mrk 110. Comparing the velocity-delay maps of the different emission lines among each other a clear radial stratification in the BLR can be recognized. Furthermore, delays of the red line wings are slightly shorter than those of the blue wings. This indicates an accretion disk wind in the BLR of Mrk 110. We determine a central black hole mass of M = . Because of the poorly known inclination angle of the accretion disk this is a lower limit only.
Key Words.:
accretion disk – line: profiles – galaxies: Seyfert – galaxies: individual: Mrk 110 – galaxies: nuclei – galaxies: quasars: emission lines1 Introduction
The central broad emission line region (BLR) in active galactic nuclei is unresolved. But a study of the variable ionizing continuum source and the delayed response of the broad emission lines provides indirect information about size and structure of the line emitting region and their internal kinematics. In this paper we present a detailed study of continuum and emission line profile variations in the Seyfert 1 galaxy Mrk 110. Our goal is to determine the structure and kinematics of its broad-line region on the one hand and its central black hole mass on the other hand.
The study of the kinematics in the central broad-line region of AGN requires the acquisition of high S/N spectra for analyzing in detail velocity resolved line profiles. Furthermore, a homogeneous set of spectra has to be obtained over months with spacings of days to weeks. A comparison of the evolution of line profiles with theoretical models (e.g. Welsh and Horne welsh91 (1991)) can give us information on the kinematics in the broad-line region i.e. whether radial inflow or outflow motions, turbulent/chaotic velocity fields, or Keplerian orbits are dominant.
We published first results of a variability campaign of Mrk 110 with the 9.2m Hobby-Eberly-Telescope in Kollatschny et al. kollatschny01 (2001) (hereafter called Paper I). We verified the extent and stratification of the BLR. Results on the velocity field based on H variations have been published in Kollatschny & Bischoff kollatschny02 (2002) (hereafter called Paper II) indicating that the broad-line region is connected with a central accretion disk.
Theoretical models of accretion disk outflow scenarios in AGN have been published by different authors. They investigated radiatively-driven wind models (e.g. Murray & Chiang murray97 (1997), Proga et al. proga00 (2000)) and/or magnetically-driven disk outflow models (Blandford & Payne blandford82 (1982), Bottorff et al. bottorff97 (1997), Emmering et al. emmering92 (1992), Königl & Kartje koenigl94 (1994)).
There are other pieces of evidence from multi-frequency and/or spectro-polarimetric observations in the literature that the BLR is connected with an accretion disk (Elvis elvis00 (2000), Cohen & Martel cohen02 (2002)).
In this paper we present new velocity delay maps of several Balmer and Helium emission lines in the spectrum of Mrk 110 to verify the accretion disk scenario in the BLR of this galaxy.
2 Observations and data reduction
The observations of this monitoring campaign were carried out at the 9.2m Hobby-Eberly Telescope (HET) at McDonald Observatory. We took 26 spectra between 1999 November 13 (JD 2,451,495) and 2000 May 14 (JD 2,451,678) with a median interval of 3 days. A log of the observations is presented in Paper I.
We obtained all our spectra under identical conditions with the Low Resolution Spectrograph (LRS) located at the prime focus of the HET. A Ford Aerospace CCD (3072x1024) with 15 m pixel was used throughout our monitoring run. The spectra cover a wavelength range from 4200Å to 6900Å with a resolving power of 650 at 5000Å . Exposure times were 10 to 20 minutes and yielded a S/N 100 per pixel in the continuum in most cases.
We reduced the spectra in a homogeneous way with IRAF reduction packages including bias subtraction, cosmic ray correction, flat-field correction, wavelength calibration, night sky subtraction and flux calibration. Great care was taken to obtain very good intensity and wavelength calibration by using the spatially unresolved forbidden emission lines in the spectra as additional internal calibrators.
We generated first a mean spectrum of our variability campaign with very high S/N. Afterwards we calculated difference spectra of all epochs with respect to this mean spectrum. We adapted our spectra by minimizing the residuals of the constant narrow emission lines in the difference spectra. The primary lines for the internal calibration were the [OIII]5007,4959 lines. Thus we corrected for small spectral shifts, for minor differences in the spectral resolution caused by different seeing conditions and for small scaling factors. We used the narrow components of the Balmer and Helium lines as well as the [OI]6300,6363, [SII]6717,6731, and [NII]6548,6584 emission lines as secondary calibrators to secure the calibration over the whole spectral range. In this way we achieved relative line fluxes with an accuracy of better than 1% in most of the spectra. The main error sources were the variable broad HeI5016,4922 emission lines blending the [OIII]5007,4959 calibration lines. Different seeing conditions during the observations caused slightly different stellar contributions from the underlying host galaxy in our spectra. This effected the pseudo-continuum we used to subtract from the spectra. Further sources of error are the slopes of the sensitivity functions we derived from our standard star spectra. At the edges of the spectrum one can get varieties of 1% to 3% in the sensitivity function by fitting the observed bandpasses. This impreciseness influenced especially the H and H line profiles. Furthermore, the H line is heavily blended with the [OIII]4363 line and the H line is heavily contaminated by the variable atmospheric absorption. The errors in the intensities of these strong Balmer line are therefore comparable to those of the weaker Helium lines.
Further details of the observations and reduction procedure are published in Papers I and II.
3 Results
We concentrated on integrated line intensity variations of the broad emission lines as well as on line profile variations in the H line in our Papers I and II. Here we present results on line profile variations in several Balmer and Helium lines. These line profiles must have a large S/N ratio for doing this study.
3.1 Integrated line intensity variations and rms line profiles
We derived mean and rms line profiles from all the spectra obtained at our HET variability campaign. The rms spectra give us the variable part of the emission lines profiles we are investigating here. The constant narrow lines in the galaxy spectra cancel out in the rms spectra. The normalized rms line profiles of the strongest Balmer (H, H) and Helium emission lines (HeII , HeI ) are presented in Fig. 1 in velocity space.
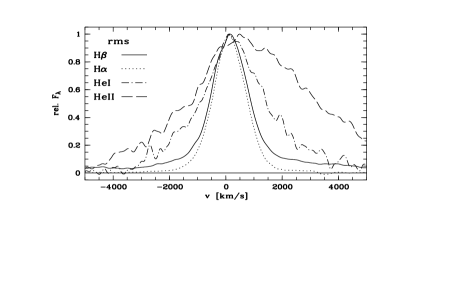
We did not consider the H line in this figure because its rms line profile is still contaminated by the strong [OIII]4363 line blend. The big differences in the widths of these lines are obvious. The Helium lines and especially the HeII line are much broader than the Balmer lines. We published in Paper I (Fig.7) the entire rms spectrum of Mrk 110. One can see that structures in the broad He line wings are real and not caused by noise by comparing them with the S/N ratio in the continuum. The measured rms line widths (FWHM) of these profiles are listed in Table 1.
In Paper I we derived the mean distance of these line emitting regions from the central ionizing source. This was done by calculating the cross-correlation function of the integrated line light curves with the variable ionizing continuum light curve. These results are given in Table 1 as well for completeness.
| Line | FWHM(rms) | ||
|---|---|---|---|
| [km s-1] | [days] | [] | |
| (1) | (2) | (3) | (4) |
| HeII | 4444. 200 | ||
| HeI | 2404. 100 | ||
| H | 1515. 100 | ||
| H | 1315. 100 |
In Fig. 2 we plot the derived time lags of the Balmer and Helium emission lines as a function of their FWHM of the rms line profiles. These time lags can be interpreted as the light-travel time across the emission region for the different broad emission lines. There is a clear correlation between line width and time lag.
We interprete the light-travel time as the characteristic distance of the line emitting region and the FWHM of the rms emission line width as the characteristic velocity of the line emitting clouds. We estimate the central masses of the central black hole under the assumption that the gas dynamics are dominated by a central massive object (see Paper I). Additionally, we calculated the relation between radius and velocity for different black hole masses. The dotted and dashed lines shown in Fig. 2 correspond to virial masses of 0.8, 1.5, 1.8, 2.2, and 2.9 (from bottom to top).
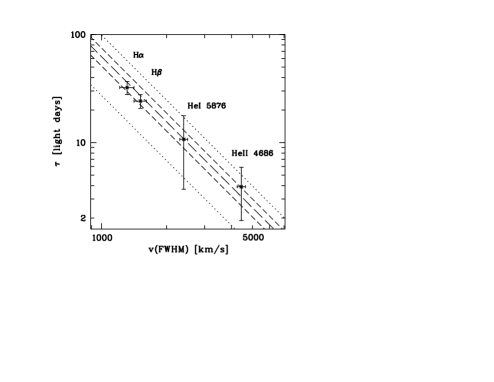
It is evident that the black hole mass of 1.8 we derived in Paper I from the observed data of the individual emission lines matches the calculated model relation. But we have to keep in mind that there might be additional systematic uncertainties in the determination of the central black hole mass due to not considered geometry and/or orientation effects of the BLR in these models.
3.2 Light curves of emission line segments
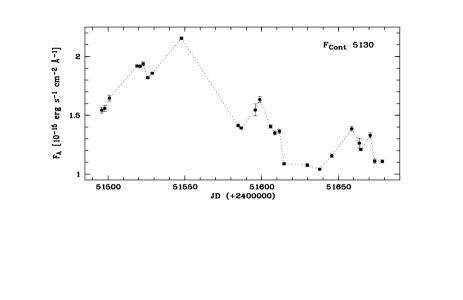
The light curves of the continuum flux at 5135Å and of the integrated broad emission line intensities of our HET variability campaign are published in Paper I. The strongest broad emission lines in our spectra are the H, H, and H Balmer lines and the HeII4686 and HeI5876 Helium lines.
In this paper we concentrate on variations in the emission line profile only. First results of the H profile variations have been published in Paper II. We measured the light curves of all subsequent velocity segments ( = 400 km/s width) from = -5000 until +5000 km/s in the strongest Balmer and Helium lines. The intensity of the central line segment is integrated from = -200 until +200 km/s. The light curves of the line center as well as of blue and red line wing segments at = 600, 1200, 2000 km/s ( = 400 km/s) for HeII4686, HeI5876, H, and H are shown in Figs. 3 to 6 in addition to the continuum light curve. In Paper II we published corresponding light curves for H. In that case we used segments with a velocity binning of = 200 km/s. But these light curves are nearly identical to those resulting with a = 400 km/s binning.
The H line segment light curves are heavily contaminated by other lines. The red wing is heavily blended with the strong [OIII]4363 line (Paper I, Fig. 1 ) and the blue wing by FeII multiplets. The red wing of the redshifted H line is heavily contaminated by atmospheric absorption in addition to the blending by the [NII]6548,6584 lines within the line profile.


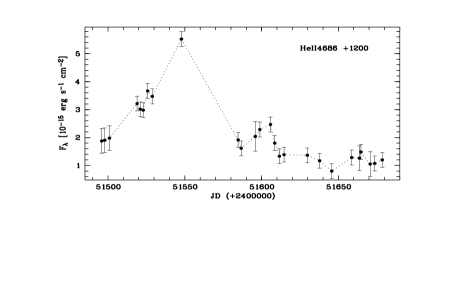
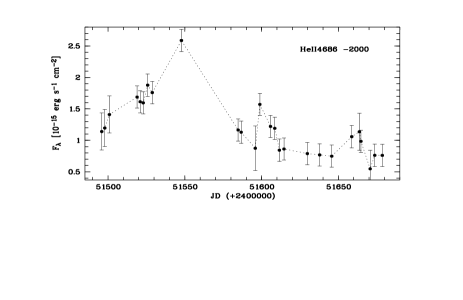


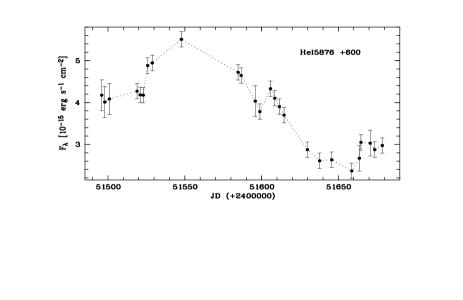


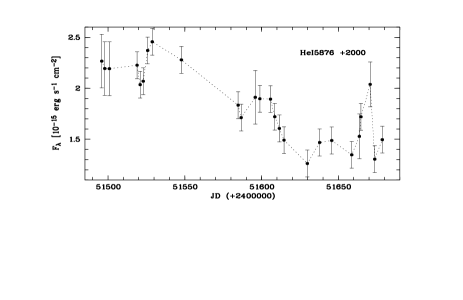

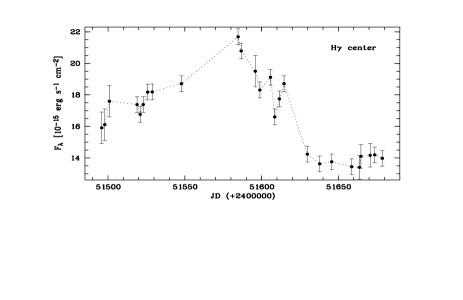
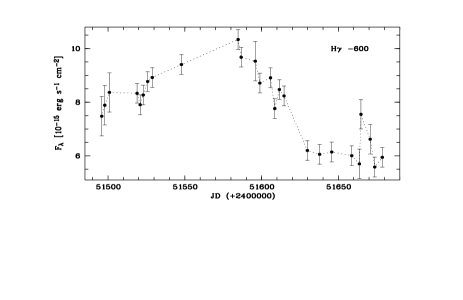
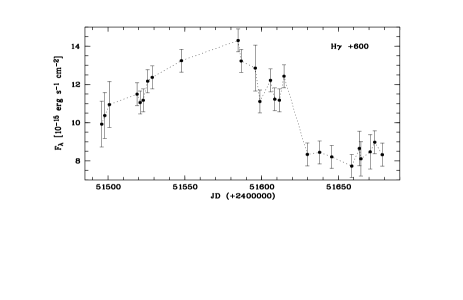
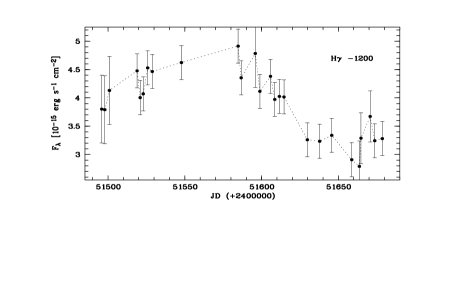
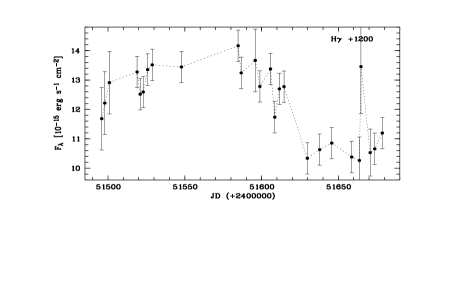
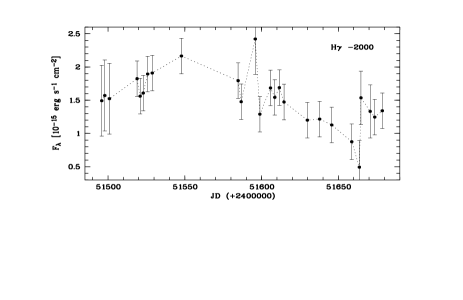
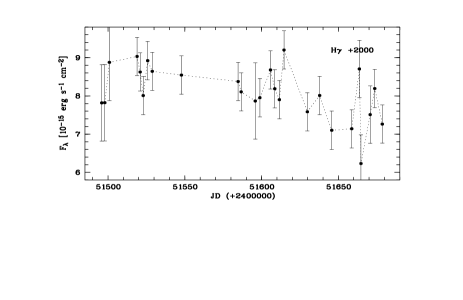


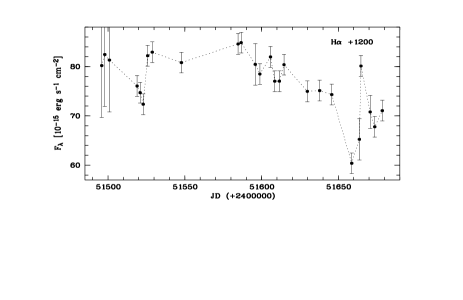


The light curves of the segments in each line profile are remarkably different. There is the general trend that the pattern of the light curves varies as a function of distance to line center. On the other hand, corresponding light curves of identical red and blue segments are very similar. One can see immediately (Figs. 3 to 6) that the outer line wings follow closer the continuum light curve than the inner line wings. The errors given in the light curves indicate absolute errors. Relative errors between light curves of the different segments are smaller by about 50.
3.3 Velocity delay maps of the Balmer and Helium lines
We computed cross-correlation functions (CCF) of all line segment ( = 400 km/s) light curves with the 5100Å continuum light curve. For details of the method see Papers I, II.
The derived delays of the segments are shown in Fig. 7 as function of distance to the line center. These velocity delay maps are presented in gray scale for the H, HeI5876, HeII4686, H, and H lines. The solid lines show contour lines of the correlation coefficient at levels between .800 and .925.
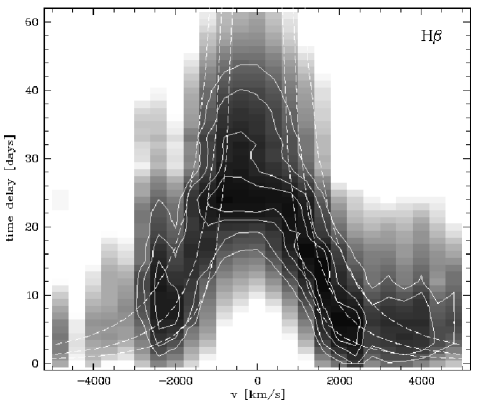
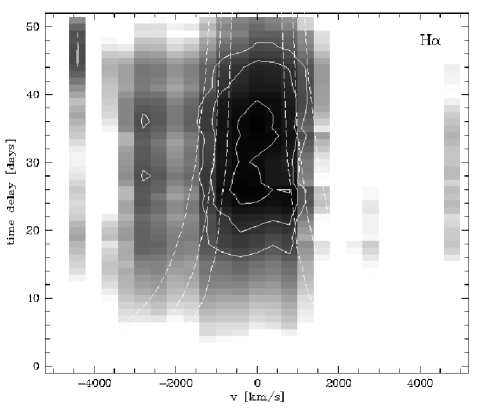
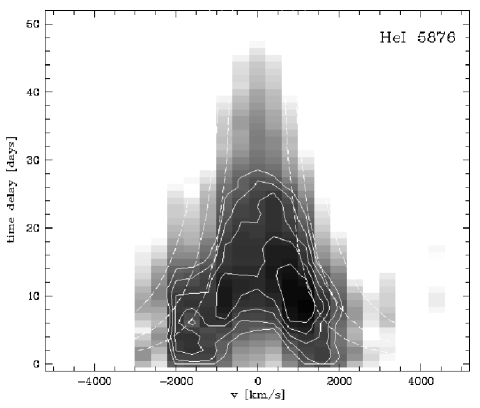
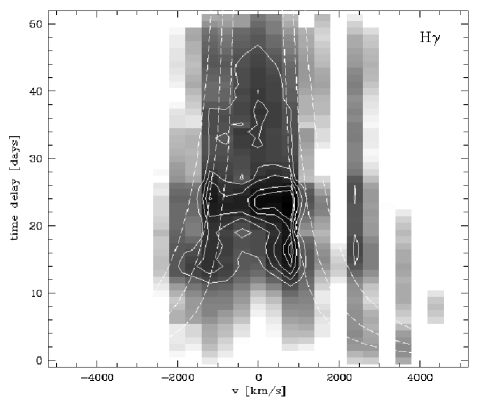
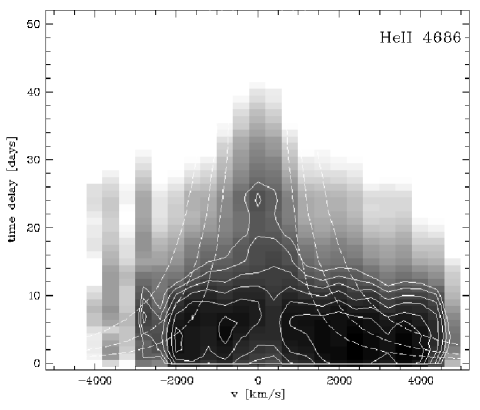
The H line and the redshifted H line are heavily contaminated by other emission and/or absorption lines as had been said before. Therefore, the correlation coefficient is smaller in the wings of these lines. From now on we will consider only the H, HeI5876, and HeII4686 lines for a more detailed discussion.
The light curves of the line center are mostly delayed with respect to continuum variations. The outer line wings respond much faster to continuum variations respectively than the inner line profile segments. Comparing the 2-D CCFs of the different lines with each other one can identify a clear stratification within the broad line region. The same trend has been seen before in the integrated lines. The HeII4686 line responds first to continuum variations followed by HeI5876 and finally H. The correlation coefficients in the line wings as well as in the line centers of the H and He lines are very similar although the intensities in the line wings are obviously smaller. But one has to keep in mind that the line wings originate closer to the nuclear ionizing source than the line centers.
The 2-D CCF(,) is
mathematically very similar to a 2-D response function (Welsh
welsh01 (2001)).
In the next section the observed velocity delay maps
are compared in more detail
with model calculations of echo images from the BLR.
The BLR
Keplerian disk model of
Welsh & Horne (welsh91 (1991), Fig. 1c)
shows remarkable coincidences with our observations.
The three dashed lines overplotted additionally
in Fig. 7 represent escape velocities computed for
central masses of 0.5, 1., 2. (from bottom to top).
3.4 Delay between blue and red line wings
As one part of our analysis we calculated cross-correlation functions (CCF) of the blue line wings segments with respect to the red ones to determine more accurately their relative response. This was done for all the strong emission lines. We computed the relative delays in the line wings in velocity segments of = 400 km/s width respectively beginning at 200 km/s. Figs. 8 to 10 show the delay of the blue line wings with respect to the red ones for the H, HeI5876 and HeII4686 lines (in gray scale). Contours of the correlation coefficient are overplotted at levels between .85 and .97 (solid lines). The center of the CCFs is indicated by the short dashed lines. The long dashed lines show the centroid of the uppermost 10% of the CCF
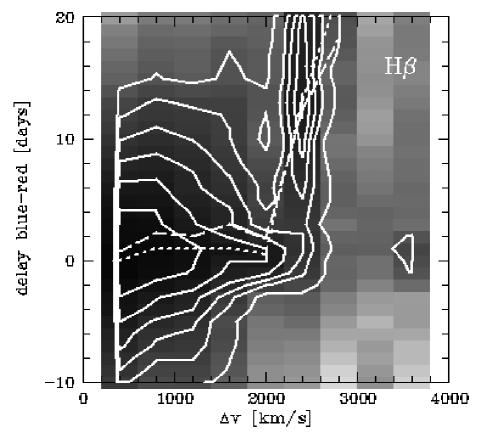
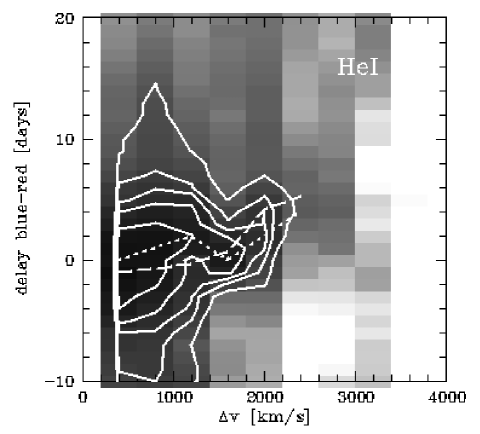
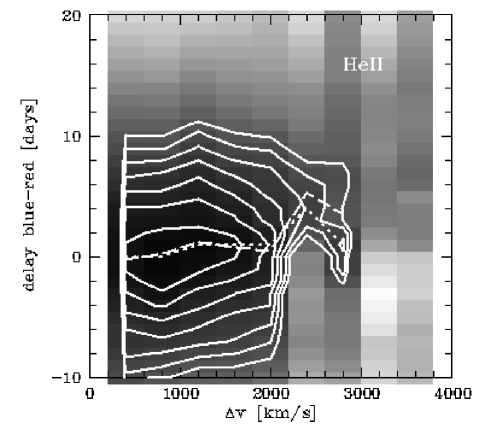
The same trend is to be seen in all emission lines: The blue line wings show a delayed response with respect to the red ones at intermediate distances from the line center (v = 500 – 2000 km/s) by one to two days. Furthermore, there is a trend that the relative delay of the blue wings increases with distance to the line center.
4 Discussion
4.1 BLR stratification derived from integrated lines
The integrated emission lines in Mrk 110 respond with different delays to continuum variations as a function of ionization degree. This indicates a stratification in the broad-line region (BLR) of Mrk 110 (Kollatschny et al., 2001). Fig. 2 shows a clear correlation between time lag of different integrated emission lines on the one hand and their corresponding line widths on the other hand. The correlation is of the form
for distances from the central ionizing source. All emission line data are consistent with a virial mass of
The higher ionized broader emission lines originate closer to the central ionizing source than the lower ionized lines.
4.2 BLR geometry and kinematics
We sliced the observed emission line profiles into velocity bins of = 400 km/s and correlated all the individual light curves with the continuum light curve. First results of this investigation have been published for the H line indicating that different line segments originate at different distances from the ionizing center.
The velocity resolved profile variations of all investigated broad lines (Fig. 7) show the same characteristics. The line segments in each profile originate at different distances from the central ionizing source. The observed trend in Mrk 110 is that the outer emission line wings originate at small radii from the central supermassive black hole. This suggests strong rotational and or turbulent motions in the BLR (see however section 4.3).
Comparing in more detail the observed velocity-delay pattern with BLR model calculations (Welsh & Horne welsh91 (1991); Perez et al. perez92 (1992); O’Brien et al. obrien94 (1994)) we can rule out that radial inflow or outflow motions – including biconical outflow – are dominant in the BLR of Mrk 110. The line wings show the shortest delay with respect to the continuum and react nearly simultaneously. Furthermore, no short delays of the central region in the Balmer and He lines are observed. This is expected in spherical BLR models with chaotic virial velocity field or randomly oriented Keplerian orbits. Therefore we can rule out a dominance of this kind of velocity field in Mrk 110. On the other hand Keplerian disk BLR models reproduce exactly the observed velocity-delay pattern i.e. the faster response of both line wings compared to the line center.
A direct comparison of the two-dimensional echo maps of the H, HeI5876, and HeII4686 lines with a theoretical echo image of an Keplerian disk (Welsh & Horne welsh91 (1991), Fig. 1c) is intriguing. Our observed 2D pattern of the different lines in Mrk 110 has been predicted in theoretical models which calculated the contibution from line emitting material at different radii in the BLR. The HeII4686 line originates at radial distances of 3 – 4 light days only while H originates at distances of about 30 light days.
A coarse estimate of the inclination angle of the accretion disk can be made by comparing the echo maps (Fig. 7) with disk models viewed at different inclination angles (Welsh & Horne welsh91 (1991), Fig. 5). We observe no short delays at the inner line regions. This excludes inclination angles of the accretion disk larger than 50∘ in Mrk 110. At the limit of a face-on disk one expects even narrower line profiles than those we observe in Mrk 110. Therefore, a best estimate of the accretion disk inclination angle in Mrk 110 is: 30∘20∘.
Other authors published further indications for a disk-like configuration of the broad-line region in AGN based on theoretical models or observational data (Bottorff et al. bottorff97 (1997), Collin-Souffrin et al. collin88 (1988), Elvis elvis00 (2000), Königl & Kartje koenigl94 (1994)).
Velocity-delay maps have been published for the Balmer lines in NGC 5548 (Kollatschny & Dietrich kollatschny96 (1996)) and NGC 4593 (Kollatschny & Dietrich kollatschny97 (1997)) before. Although the quality of their spectral data was not as good as that of this campaign they could demonstrate the same basic trend as that seen in Mrk 110: the outer line wings respond faster to continuum variations than the line center. Furthermore, the red wings responded slightly faster and stronger than the blue ones in theses galaxies, too – see next section. In the UV wavelength range the variability behaviour of the prominent CIV1550 line has been investigated in a few galaxies. Again there are hints for a stronger and faster response of the red wing in NGC 5548 (Chiang & Murray chiang96 (1996), Bottorff et al. bottorff97 (1997)) and NGC 4151 (Ulrich & Horne ulrich96 (1996)) in comparison to the blue one. Unfortunately, the CIV1550 emission lines are strongly affected by a central absorption line blend in both galaxies.
4.3 Accretion disk wind
In this section I will put again the main emphasis on the velocity-delay data of the H, HeII4686, and HeI5876 lines (Figs. 7 to 10). A careful inspection shows that a second trend in these 2D velocity-delay maps is superimposed on the primary trend that both outer line wings respond faster than central line region: The response of the red line wings is stronger than that of the blue ones. For all line profiles the correlation coefficients of the red wing light curves with the continuum light curve are systematically higher by 5% (Fig. 7) than those ones of the blue wing. Furthermore, the red wings respond faster than the blue ones. The integrated blue wings (Figs. 7 – 10) lag the red wings by days.
An earlier response of the red line wing compared to the blue line wing is predicted in spherical wind and disk-wind models of the BLR (Königl & Kartje koenigl94 (1994), Chiang & Murray chiang96 (1996), Blandford & Begelman blandford99 (1999)). In these models the line emitting gas shows a radial outward velocity component in addition to the rotation. Also a stronger response of the red wing is expected in the models and observed in NGC 5548 (Chiang & Murray chiang96 (1996)). But we could not verify a secondary peak in our data as predicted in the model of (Chiang & Murray chiang96 (1996)). The disk outflow/wind models are distinguished from spherical wind models that their velocity decreases with radius (this means from the outer line wings to the line center) rather than the other way around. The observed delays of the blue line wings with respect to the red ones (Figs. 8 – 10) point at an accretion disk-wind in Mrk 110. In particular one can see an increase of the blue-red delay towards the outer line wings which means that the wind velocity increases towards the center.
Furthermore, Murray & Chiang (murray97 (1997)) demonstrated that a Keplerian disk wind reproduces single-peaked broad emission lines as we see in the spectra of Mrk 110.
4.4 Central black hole mass
From the integrated line intensity variations of four different emission lines a virial mass of
has been determined (Sect.3). We made the assumption that the characteristic velocities of the particular emission line regions are given by the FWHM of their rms profiles and the characteristic distances R are given by the centroids of the corresponding cross-correlation functions:
(e.g. Koratkar & Gaskell koratkar91 (1991), Kollatschny & Dietrich kollatschny97 (1997)).
Additionally, we may compare the velocity-delay maps (Fig. 7) with escape velocity envelopes
for different central masses. With this method we derive a central black hole mass of
in Mrk 110. This mass value confirms perfectly our earlier derived value.
But one has to keep in mind that there are further systematic uncertainties in the mass determination (e.g. Krolik krolik01 (2001)). Due to the unknown inclination angle of the accretion disk the derived mass may be a lower limit only. Our observed velocity-delay maps do not drop down near the line center (Fig. 3) as is expected from model calculations for edge-on disk models (Welsh & Horne welsh91 (1991); O’Brien et al. obrien94 (1994)). This is a hint for a small inclination angle of the accretion disk in Mrk 110.
Ferrarese et al. ferrarese01 (2001) measured the stellar velocity dispersion in the CaII triplet lines of the host galaxy in Mrk 110. Their derived velocity dispersion corresponds to a central mass of only
in their black hole mass vs. velocity dispersion diagram. This value is a factor of 5 below our black hole mass value we derived with other methods for this galaxy. But one has to consider that Mrk 110 is a galaxy system in the late stage of merging with respect to its morphology. Therefore, the derived central stellar velocity dispersion in the host galaxy of Mrk 110 might by contaminated heavily by this interaction/merging effect.
4.5 Schematic BLR model
We are now in the position of generating a schematic model of the innermost AGN region in Mrk 110 from all our data. The result is shown in Fig. 11.
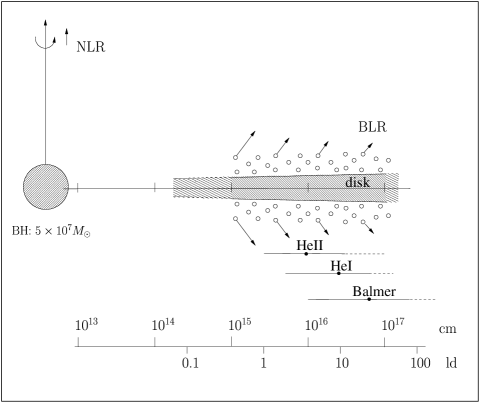
We could demonstrate that the broad emission lines originate in the wind of an accretion disk. The distances of the line emitting regions from the central ionizing source are shown on a logarithmic scale. A central black hole mass of is a lower limit only because of the poorly known inclination angle of the accretion disk. This value is of the order of 30∘. Therefore, we draw a Schwarzschild radius for a black hole mass of in Fig. 11.
5 Summary
We analyzed carefully Balmer and Helium
emission line profile variations which we derived from our monitoring campaign
on the Seyfert 1 galaxy Mrk 110.
Three clear trends are to be seen
in our generated velocity-delay maps:
- The outer red and blue line wings of the emission profiles
respond nearly simultaneously
with respect to variations of the ionizing continuum
and much
faster than the inner regions in the emission lines.
A detailed comparison of
our observed velocity-delay maps with theoretical models of other authors
points clearly to
an accretion disk where the broad emission lines originate.
-There is the general trend starting from the Balmer lines upon the
HeI line up to the HeII lines that
the higher ionized lines
respond systematically faster.
This is to be seen in
the integrated lines on the one hand
as well as in the velocity resolved line profiles on the other hand.
It indicates an ionization stratification in the broad-line
region.
- The response of the red line wing with respect to the ionizing
continuum variations
is systematically stronger and slightly
faster compared to the blue line wing. This finding
is the signature of an
accretion disk wind in the broad-line region.
We derived from the integrated line intensity variations
as well as
from the line profile variations a central
black hole mass of M = .
This value is a lower
limit because of the unknown accretion disk orientation.
Acknowledgements.
WK thanks the UT Astronomy Department for warm hospitality during his visit. He thanks K. Bischoff, M. Bottorff, and M. Zetzl for valuable comments. Part of this work has been supported by the Deutsche Forschungsgemeinschaft, DFG grant KO 857/24 and DAAD.References
- (1) Blandford, R.D.,& Begelman, M.C. 1999, MNRAS, 303, L1
- (2) Blandford, R.D.,& Payne, D.G. 1982, MNRAS, 199, 883
- (3) Bottorff, M., Korista, K.T., Shlosman, I. & Blandford, R.D. 1997, ApJ, 479, 200
- (4) Chiang, J., & Murray, N. 1996, ApJ, 466, 704
- (5) Cohen, M.H. & Martel A.R. 2002, in: Crenshaw D.M. et al. (eds.): Mass outflow in AGN, ASP Conf.Ser. 255, p.255
- (6) Collin-Souffrin, S., Dyson, J.E., McDowell, J.C., & Perry J.J. 1988, MNRAS, 232, 539
- (7) Elvis, M. 2000, ApJ, 545, 63
- (8) Emmering, R.T., Blandford, R.D., & Shlosman, I. 1992, ApJ, 385, 460
- (9) Ferrarese, L., Pogge, R.W., Peterson, B.M. et al. 2001, ApJ, 555, L79
- (10) Königl, A., & Kartje, J.E. 1994, ApJ, 434, 446
- (11) Kollatschny, W., Bischoff, K., Robinson, E.L., Welsh, W.F., & Hill, G.J. 2001, A&A, 379, 125 (Paper I)
- (12) Kollatschny, W., & Bischoff, K. 2002, A&A, 386, L19 (Paper II)
- (13) Kollatschny, W., & Dietrich, M. 1996, A&A, 314, 43
- (14) Kollatschny, W.,& Dietrich, M. 1997, A&A, 323, 5
- (15) Koratkar, A., Gaskell, M. 1991, ApJ 370, L61
- (16) Krolik, J. H. 2001, ApJ, 551, 72
- (17) Murray, N., & Chiang, J. 1997, ApJ, 474, 91
- (18) O’Brien, P.T., Goad, M.R., & Gondhalekar, P.M., 1994, MNRAS, 268, 845
- (19) Perez, E., Robinson, A., & de la Fuente, L. 1992, MNRAS, 256, 103
- (20) Proga, D., Stone, J.M., & Kallman, T.R. 2000, ApJ, 543, 686
- (21) Ulrich, M.-H., & Horne, K. 1996, MNRAS, 283, 748
- (22) Welsh, W.F., & Horne, K. 1991, ApJ, 379, 586
- (23) Welsh, W.F. 2001, in: Peterson et al. (eds.): Probing the Physics of AGN, ASP Conf.Ser. 224, p.123