Detection of low Eu abundances in extremely metal-poor stars and the origin of -process elements11affiliation: Based on data collected at Subaru Telescope, which is operated by the National Astronomical Observatory of Japan.
Abstract
We report abundance analyses of three extremely metal-poor stars with [Fe/H] , using the Subaru High Dispersion Spectrograph (HDS). All are found to have sub-solar values of [Eu/Fe]. Comparison with our chemical evolution model of the Galactic halo implies the dominant source of Eu to be the low-mass end of the supernova mass range. Future studies of stars with low Eu abundances will be important to determine the -process site.
1 Introduction
The origin of the rapid neutron capture (-process) elements is still uncertain. Although a few scenarios such as neutrino winds (Woosley et al., 1994) in core-collapse supernovae (SNe), the collapse of O-Ne-Mg cores resulting from stars (Wanajo et al., 2003), and neutron star mergers (Freiburghaus et al., 1999) show some promise, no consensus has been achieved.
Analyses have shown a large scatter in the abundances of neutron-capture elements such as Sr, Ba, and Eu among metal-poor stars in the Galactic halo (e.g., McWilliam et al., 1995; Ryan, Norris, & Beers, 1996). If the scatter accurately portrays the state of the interstellar medium (ISM) from which they formed, large dispersions in excess of observational errors indicate that the ISM was not fully mixed at the early epoch of Galactic history and that metal-poor stars contain products from only one or a few SNe (Ryan, Norris, & Bessell, 1991). The scatter possibly reflects variation in the yields of SNe from different mass progenitors; the huge dispersions in neutron-capture elements imply that -process yields are highly dependent on the masses of SN progenitors.
Eu traces the -process. The chemical evolution model of Ishimaru & Wanajo (1999, hereafter IW99) explains the large dispersion of Eu/Fe observed in very metal-poor stars if the -process elements originate from a limited mass range of progenitor stars, such as the SNe from stars of or alternatively (see also Travaglio et al., 1999). Tsujimoto, Shigeyama, & Yoshii (2000) have concluded by a similar approach that the SNe from are the dominant source of the -process elements. A clear difference among these cases is expected in the stellar distribution of [Eu/Fe] 111 , where indicates abundance of -th element . at [Fe/H] (IW99). However, a shortage of observational data in this metallicity range has made it difficult to distinguish between the proposed -process sites.
In this Letter, we report on three extremely metal-poor stars which we show to have very low Eu abundances (§2). These data are compared with our chemical evolution models to distinguish between the proposed -process sites (§3).
2 Observations and Analysis
We selected three very metal-poor ([Fe/H] ) giants, HD 4306, CS 22878–101, and CS 22950–046, which were known from previous studies (McWilliam et al., 1995; McWilliam, 1998) to have [Ba/Fe] , typical for their metallicities. Observations were made with the High Dispersion Spectrograph (HDS; Noguchi et al. 2002) of the 8.2m Subaru Telescope in 2001 July, at a resolving power . The total exposure time was 50, 240, and 360 minutes for HD 4306, CS 22878–101, and CS 22950–046, respectively, resulting in S/N ratios per 0.012 Å pixel at 4100 Å of 260, 110, and 80. Data reduction was performed in the standard way with IRAF222IRAF is distributed by the National Optical Astronomy Observatories, which is operated by the Association of Universities for Research in Astronomy, Inc. under cooperative agreement with the National Science Foundation..
Equivalent widths were measured by fitting Gaussian profiles to the absorption lines of species listed in Table 1333The line list and measurements are available at http://optik2.mtk.nao.ac.jp/~waoki/EW/, except for Eu. An LTE analysis using model atmospheres of Kurucz (1993), based on equivalent widths measured above, was performed for species other than Eu. Results are given in Table 1. For Ba we included the hyperfine splitting and isotope shifts (McWilliam, 1998), assuming isotope ratios of the -process component in solar system material (Arlandini et al., 1999).
The atmospheric parameters (effective temperature: (K), gravity: (cm s-2), micro-turbulent velocity: (km s-1), and metallicity that is assumed to be [Fe/H]) of CS 22878–101 and CS 22950–046 were adopted from Cohen et al. (2002) and Carretta et al. (2002), i.e., //[Fe/H]/ = 4775/1.3//2.0, and 4730/1.3//2.0, respectively. We found that these gravities satisfy the ionization balance between Fe I and Fe II, and the microturbulence velocities lead to no dependence of the derived abundance on equivalent widths of Fe I lines. The derived Fe abundances also agree very well with the assumed metallicities. So, we adopted these atmospheric parameters without modification. For HD 4306, we adopted K based on (Norris, Bessell, & Pickles, 1988; and 2MASS data: Skrutskie et al., 1997) and the temperature scale of Houdashelt, Bell & Sweigart (2000). We derived and from the analysis by requiring ionization balance and no dependence of abundance on line strength. The resulting parameters, //[Fe/H]/ = 5000/2.0//1.85, are similar to those of other works (McWilliam et al., 1995, Honda et al., in preparation).
For the three Eu II lines, at 3819, 4129, and 4205 Å, a spectrum synthesis technique was applied. The line list includes hyperfine splitting and isotope shifts from Lawler et al. (2001). Contamination by other species was included using the comprehensive line list of Kurucz (1995). Figure 1 compares the observed and synthetic spectra for the 3819 Å line, which is the strongest of the three. Eu is clearly detected in the spectra of HD 4306 and CS 22878–101 but not in CS 22950–046. We derived consistent results from the 4129 Å line, but the measurement of 4205 Å is uncertain because of severe contamination by V II at 4205.09 Å. We adopted the average of the Eu abundances derived from the 3819 and 4129 Å lines. In Table 2, we give the equivalent widths of the Eu II lines estimated from the spectrum synthesis using the Eu abundances derived from individual lines. For CS 22950–046, we estimated the upper limit of its equivalent widths from the 3 depth of the random noise level and typical line widths for this object, and determined the upper limit of the Eu abundance, given in Table 1. The continuum fit is constrained over a wider spectral range that is shown in Figure 1; a systematic error of 1% would change the [Eu/H] limit from the 3819 Å line by 0.1.
The random error for each species is estimated from the standard deviation of the abundances derived from individual lines. The values are sometimes unrealistically small when the number of lines is small, so we adopted the larger of the value for the species and that for Fe I, 0.08–0.15 dex depending on the species and the quality of the spectra. We estimated the errors in the Eu abundances by eye from fitting synthetic spectra to the observed ones, adopting 0.1 dex for HD 4306 and 0.2 dex for CS 22878–101. The errors in the abundance determinations due to uncertainties of the atmospheric parameters were evaluated for K, , km s-1, and [M/H] = 0.3 for HD 4306, and added in quadrature with the random error estimated above, to give the total uncertainty in Table 1. The larger errors in [Sr/Fe] reflect the sensitivity to microturbulence of the two resonance lines. The [Eu/Fe] values are affected most significantly by the uncertainty in the surface gravity, by 0.12 for .
Comparisons between our results for the two CS objects and those by Carretta et al. (2002) show good agreement (within 0.17 dex) for the species in Table 1 other than Eu. An exception is Ba in CS 22878–101: our abundance is 0.35 dex higher than that by Carretta et al. (2002). The reason for this discrepancy is unclear. The equivalent widths of the Ba II 4554 Å line agree well between the two studies, and the atmospheric parameters are the same. The difference in the assumed isotope ratios of Ba in the abundance analyses do not explain this discrepancy.
3 Comparison with the Galactic chemical evolution models
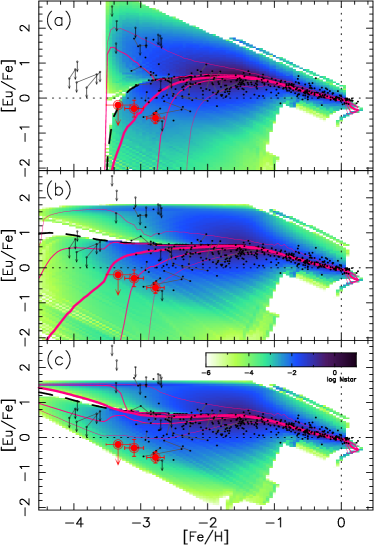
Assuming that star formation is induced by a single supernova explosion, IW99 have constructed an inhomogeneous chemical evolution model of the Galactic halo. The chemical composition of a newly formed star is a mixture of the products from each SN and the ISM swept up by the expanding ejecta. This model, along with some improvements (see Ishimaru, Prantzos, & Wanajo, 2003), leads to a large scatter of relative abundances for elements that have strong dependencies on the progenitor masses. The scatters of relative abundances in and iron-peak elements, on the other hand, are predicted to be small (as is observed) owing to the weak dependencies of their yield ratios on the progenitor masses. We use this model to derive the Galactic evolution of the -process tracer Eu. We consider three cases, where the -process elements originate from SNe of (a) , (b) , and (c) stars.
Yields for Type II and Type Ia SNe are taken from Nomoto et al. (1997a, b). The stars are assumed to produce no iron, since their contribution to the enrichment of iron-peak elements in the Galaxy is negligible (Wanajo et al., 2003). The mass of Eu produced per SN event is assumed to be constant over the mass range of each case; this simplification will not affect the result significantly because of the narrow mass range of Eu-generating SNe assumed in each case. The requirement that the model reproduces the solar values [Eu/Fe] = [Fe/H] = 0 implies ejected Eu masses , , and for cases (a)-(c), respectively. These are reasonable amounts from a nucleosynthetic point of view (Wanajo et al., 2001, 2003).
Figure 2 compares the results of these cases with the observational data from §2 (large double circles) and from sources cited in the caption (small circles). The predicted log number density of stars per unit area on the [Fe/H]–[Eu/Fe] plane is also shown as a color image. The thick solid lines indicate the average values of [Eu/Fe] as a function of metallicity, calculated from the models. The solid and thin solid lines indicate, respectively, the 50% and 90% confidence lines.
Figure 2 shows that observable differences between the cases appear at [Fe/H]. In case (c), most of the stars are expected to have [Eu/Fe], owing to Eu production solely by massive, short-lived stars. In cases (a) and (b), significant numbers of stars having [Eu/Fe] 0 are predicted at [Fe/H] owing to the delayed production of Eu by lower mass SN progenitors. This is outstanding in case (a), which has the largest delay.
Most previous observational data, many of them upper limits, distribute between the 90% confidence lines for all cases, which has made it difficult to determine the mass range of the -process site. Our newly obtained data add the lowest detections of Eu, at [Fe/H] , and help distinguish between the three cases. The best agreement can be seen in case (a), in which the three stars, and most other stars from previous observations are located between the 50% confidence lines at [Fe/H] . In case (b), all three stars are located below the average (thick solid) line, although they remain above the 90% confidence line. In case (c), these stars are located outside the 90% confidence region. We suggest, therefore, that case (a) is most likely to be the -process site, i.e. SNe from low-mass progenitors such as stars. More detections of Eu at low metallicity will be needed to clearly distinguish between cases (a) and (b). Note that this result is not due to a selection bias, since the [Ba/Fe] values () are typical of extremely metal-poor stars with [Fe/H] (Ryan et al. 1996).
Our analysis gives [Ba/Eu] values consistent with the solar -process (Arlandini et al., 1999) when estimated errors are included (see Table 3). Hence our result may hold for heavy -process elements with , not just . The values of [Sr/Ba], however, are significantly higher than for the solar -process, implying that these three stars exhibit light -process elements () produced in more massive SNe ().
The discussion above suggests that the production of the -process elements is associated with a small fraction of SNe near the low-mass end of the range. Neutrino winds in the explosions of massive stars may face difficulties in being a dominant source of the -process elements. Wanajo et al. (2001) have demonstrated that an -process in the neutrino winds proceeds from only very massive proto-neutron stars, which might result from massive progenitors such as stars, which is similar to case (b). Hypernovae (, Maeda & Nomoto, 2003) or pair-instability supernovae (, Heger & Woosley, 2002), resulting from stars near the high mass-end of the SN progenitors, similar to case (c), are clearly excluded as the major -process site.
We suggest, therefore, that the dominant -process site is SN explosions of collapsing O-Ne-Mg cores from stars (Wheeler, Cowan, & Hillebrandt, 1998). Recently, Wanajo et al. (2003) have demonstrated that the prompt explosion of the collapsing O-Ne-Mg core from a star reproduces the solar -process pattern for nuclei with , and is characterized by a lack of -elements and only a small amount of iron-peak elements. This clearly differs from more massive SNe with iron cores () that eject both these elements, and is consistent with the fact that the abundances of heavy -process elements in stars with [Fe/H] are not related with those of iron-peak elements or of elements with lower atomic numbers (Qian & Wasserburg, 2003).
This study shows the importance of detecting Eu in extremely metal-poor stars to explore the origin of -process elements. Further observations are needed to confirm the origin.
References
- Arlandini et al. (1999) Arlandini, C., Käppeler, F., Wisshak, K., Gallino, R., Lugaro, M., Busso, M., & Straniero, O., 1999, ApJ, 525, 886
- Burris et al. (2000) Burris, D. L., Pilachowski, C. A., Armandroff, T. E., Sneden, C., Cowan, J. J., Roe, H. 2000, ApJ, 544 302
- Carretta et al. (2002) Carretta, E., Gratton, R., Cohen, J. G., Beers, T. C., Christlieb, N. 2002, AJ124, 481
- Cohen et al. (2002) Cohen, J. G., Christlieb, N., Beers, T. C., Gratton, R., Carretta, E. 2002, AJ, 124, 470
- Freiburghaus et al. (1999) Freiburghaus, C., Rosswog, S., & Thielemann, F. -K. 1999, ApJ, 525, L121
- François et al. (2003) François, P., et al. 2003, A&A, 403, 1105
- Fulbright (2000) Fulbright, J. P. 2000, AJ, 120, 1841
- Gratton & Sneden (1994) Gratton, R. G., Sneden, C. 1994, A&A, 287, 927
- Heger & Woosley (2002) Heger, A. & Woosley, S, E. 2002, ApJ, 567, 532
- Houdashelt, Bell & Sweigart (2000) Houdashelt, M.L., Bell, R.A., & Sweigart, A.V. 2000, ApJ, 119, 1448
- Ishimaru & Wanajo (1999) Ishimaru, Y., Wanajo, S. 1999, ApJ, L511, 33 (IW99)
- Ishimaru, Prantzos, & Wanajo (2003) Ishimaru, Y., Prantzos, N., & Wanajo, S. 2003, Nucl. Phys. A, 718, 671
- Johnson (2002) Johnson, J. A. 2002, ApJS, 139, 219
- Johnson & Bolte (2002) Johnson, J. A. & Bolte, M. 2002, ApJ, 579, 616
- Kurucz (1993) Kurucz, R. L., 1993, CD-ROM 13, ATLAS9 Stellar Atmospheres Programs and 2km/s Grid (Cambridge: Smithsonian Astrophys. Obs.)
- Kurucz (1995) Kurucz, R. L., 1995, CD-ROM 23, (Cambridge: Smithsonian Astrophys. Obs.)
- Lawler et al. (2001) Lawler, J. E., Wickliffe, M. E., Den Hartog, E. A. & Sneden, C. 2001, ApJ, 563, 1075
- Maeda & Nomoto (2003) Maeda, K. & Nomoto, K. 2003, ApJ, in press
- McWilliam et al. (1995) McWilliam, A., Preston, G. W., Sneden, C., & Searle, L. 1995, AJ, 109, 2757
- McWilliam (1998) McWilliam, A. 1998, AJ, 115, 1640
- Noguchi et al. (2002) Noguchi, K., et al. 2002, PASJ, 54, 855
- Nomoto et al. (1997a) Nomoto, K., Hashimoto, M., Tsujimoto, T., Thielemann, F. -K., Kishimoto, N., Kubo, Y., & Nakasato, N. 1997a, Nucl. Phys. A, 616, 79
- Nomoto et al. (1997b) Nomoto, K., et al. 1997b, Nucl. Phys. A, 621, 467
- Norris, Bessell, & Pickles (1988) Norris, J.E., Bessell, M.S., & Pickles, A.J. 1988, ApJS, 58, 463
- Norris, Ryan, & Beers (2001) Norris, J. E., Ryan, S. G., & Beers, T. C. 2001, ApJ, 561, 1034
- Qian & Wasserburg (2003) Qian, Y. -Z. & Wasserburg, G. J. 2003, ApJ, 588, 1099
- Ryan, Norris, & Bessell (1991) Ryan, S. G., Norris, J. E., & Bessell, M. S. 1991, AJ, 102, 303
- Ryan, Norris, & Beers (1996) Ryan, S. G., Norris, J. E., & Beers, T. C. 1996, ApJ, 471, 254
- Shetrone (1996) Shetrone, M. D. 1996, AJ, 112, 1517
- and 2MASS data: Skrutskie et al. (1997) Skrutskie, M.F., et al. 1997, in The Impact of Large Scale Near-IR Sky Surveys, ed. F. Garzon et al. (Dordrecht: Kluwer), p. 187
- Sneden et al. (1996) Sneden, C., McWilliam, A., Preston, G. W., Cowan, J. J., Burris, D. L., & Armosky, B. J. 1996, ApJ, 467, 819
- Travaglio et al. (1999) Travaglio, C., Galli, D., Gallino, R., Busso, M., Ferrini, F., Straniero, O. 1999, ApJ, 521, 691
- Tsujimoto, Shigeyama, & Yoshii (2000) Tsujimoto, T., Shigeyama, T., & Yoshii, Y. 2000, ApJ, L531, 33
- Wanajo et al. (2001) Wanajo, S., Kajino, T., Mathews, G. J., & Otsuki, K. 2001, ApJ, 554, 578
- Wanajo et al. (2003) Wanajo, S., Tamamura, M., Itoh, N., Nomoto, K., Ishimaru, I., Beers, T. C., & Nozawa, S. 2003, ApJ, 593, 968
- Westin et al. (1998) Westin, J., Sneden, C., Gustafsson, B., Edvardsson, B., Cowan, J. J. 1998, BAAS, 30, 1317
- Wheeler, Cowan, & Hillebrandt (1998) Wheeler, J. C., Cowan, J. J., & Hillebrandt, W. 1998, ApJ, L493, 101
- Woolf, Tomkin, & Lambert (1995) Woolf, V. M., Tomkin, J., & Lambert, D. L. 1995, ApJ, 453, 660
- Woosley et al. (1994) Woosley, S. E., Wilson, J. R., Mathews, G. J., Hoffman, R. D., & Meyer, B. S. 1994, ApJ, 433, 229
| HD 4306 | CS 22878-101 | CS 22950-046 | ||||||||||||
|---|---|---|---|---|---|---|---|---|---|---|---|---|---|---|
| [X/Fe]a | n | b | [X/Fe]a | n | b | [X/Fe]a | n | b | ||||||
| Fe I | 2.76 | 168 | 0.13 | 4.74 | 3.14 | 161 | 0.14 | 4.36 | 3.34 | 141 | 0.18 | 4.16 | ||
| Fe II | 2.79 | 19 | 0.13 | 4.71 | 3.07 | 20 | 0.14 | 4.43 | 3.34 | 17 | 0.18 | 4.16 | ||
| Sr II | 0.28 | 2 | 0.27 | 0.42 | 0.15 | 2 | 0.28 | 0.33 | 0.18 | 2 | 0.30 | 0.60 | ||
| Ba II | 1.09 | 2 | 0.14 | 1.65 | 0.73 | 2 | 0.16 | 1.61 | 1.31 | 2 | 0.19 | 2.43 | ||
| Eu II | 0.57 | 2 | 0.16 | 2.80 | 0.30 | 2 | 0.24 | 2.85 | 0.2 | 1 | … | 3.0 | ||
a [Fe/H] for Fe I and Fe II.
b Uncertainty in [Fe/H] or [X/Fe] values.
c for elements .
| Wavelength | Equvalent Width (mÅ) | ||
| Å | HD 4306 | CS 22878–101 | CS 22950–046 |
| 3819.7 | 3.8 | 7.4 | 6.8 |
| 4129.7 | 2.2 | 5.3 | |
| 4205.0 | 2.5 | 5.0 | 3.4 |
| HD 4306 | CS 22878-101 | CS 22950-046 | solar††solar system -process abundances by Arlandini et al. (1999) | |
|---|---|---|---|---|
| [Sr/Ba] | ||||
| [Ba/Eu] |