Chapter 1 A Study of the Ground Level Event of April 15, 2001 with GRAND
Abstract
Project GRAND, a proportional wire chamber array, is used to examine the increased counting rate of single muons during the solar Ground Level Event (GLE) of April 15, 2001. Data are presented and compared to our background rates and to that of neutron monitor stations. This GLE is seen with a statistical significance of 6.1.
1. Introduction
On April 15, 2001 the IPS Radio and Space Services website reported a rare X14 ( at one AU from the sun) solar flare with a maximum X-ray intensity at 13.83 UT. The flare originated on the sun at coordinates S20 W85. During the period from 1976 - 1998, only sixteen flares of magnitude X10 or greater were reported; observations on some of these high energy flares are given in [1,4,6,14].
During the peak time of the flare, the sun was at an altitude of and an azimuth of in a local coordinate system. Even though the sun is near the minimum detectable elevation angle (27∘), the interplanetary magnetic field (IMF) and the magnetic field of the earth alter the direction of charged particles from the sun allowing their charged secondaries to be more easily detected by GRAND. Muon telescopes are typically sensitive to higher primary energies than neutron monitors.
Charged particles emitted from the sun spiral around the magnetic field lines which themselves curve in an Archimedes spiral. Therefore the GLE associated with a particular X-ray flare should occur at a slightly later time than the X-ray event (due to the longer path length and slower velocity) and at a different angle than the sun, thus providing better detector acceptance even though a direct line to the sun is at a low elevation angle (see also [8]).
Further details on the observation of this GLE can be found in [12].
2. Data and Observations
Project GRAND is an array of 64 proportional wire stations located at N and W at an altitude of 220 m above sea level. The array is used to detect ground level charged particles produced from primaries undergoing hadronic interactions. Each station contains eight 1.29 m2 proportional wire chamber (PWC) planes. The position sensitive PWC planes allow the direction of a muon track to be measured to within 0.26∘, on average, in each of two projected planes. A 50 mm thick steel plate is located above the bottom two PWC planes. Muon tracks can thus be distinguished from electrons or hadrons. The array collects data at a rate of 2400 muons per second. Additional details are on the webpage: http://www.nd.edu/grand.
GRAND recorded a continuous data file on magnetic tape containing information from April 14, 2001 at 8:40 UT through April 16 at 21:30 UT, providing background information before and after the flare time. The counting rate from 14.5 hours to 24.5 hours UT was examined in 0.1 hour bins. Deviations (r.m.s.) from average counting rate were measured individually for each station of the array. In order to prevent spurious individual station variations from giving a possible signal in the sum-of-all-stations, one-third of the stations with the highest individual r.m.s. deviations were eliminated from consideration leaving 39 stations (an extremely severe cut to ensure with great confidence that erratic station behavior could not cause a false signal).
The six bins of time from 14.0 to 14.6 hours UT were used as a signal time; the bins from 9.5 to 19.5 hours UT (minus the signal time) were used as background. Since it is known that the muon rate depends slightly on the time of day [11] (due to small solar effects in air pressure, temperature, and in the IMF), the counting rate for the background time period was fit to a quadratic curve. The muon counting rates for April 14 and April 16 (the preceeding and the next day from the signal) were examined and it was verified that the backgrounds from these two days are similar to the curve for April 15; the average of four years of data also shows a similar shape. The data as percentage above background are shown in Figure 1 with error bars. For comparison, the data from neutron monitors at Newark [3] and Oulu [9] during this GLE are also shown. Our muon data rate has not been corrected for changes in pressure. However, the pressure was recorded every half hour and found to be constant for the entire interval of time analyzed to within 0.15% and thus could not cause the excess counting rate observed. The amount of signal above background yields a GLE signal with a significance of 6.1 (where is the total error on the signal and background).
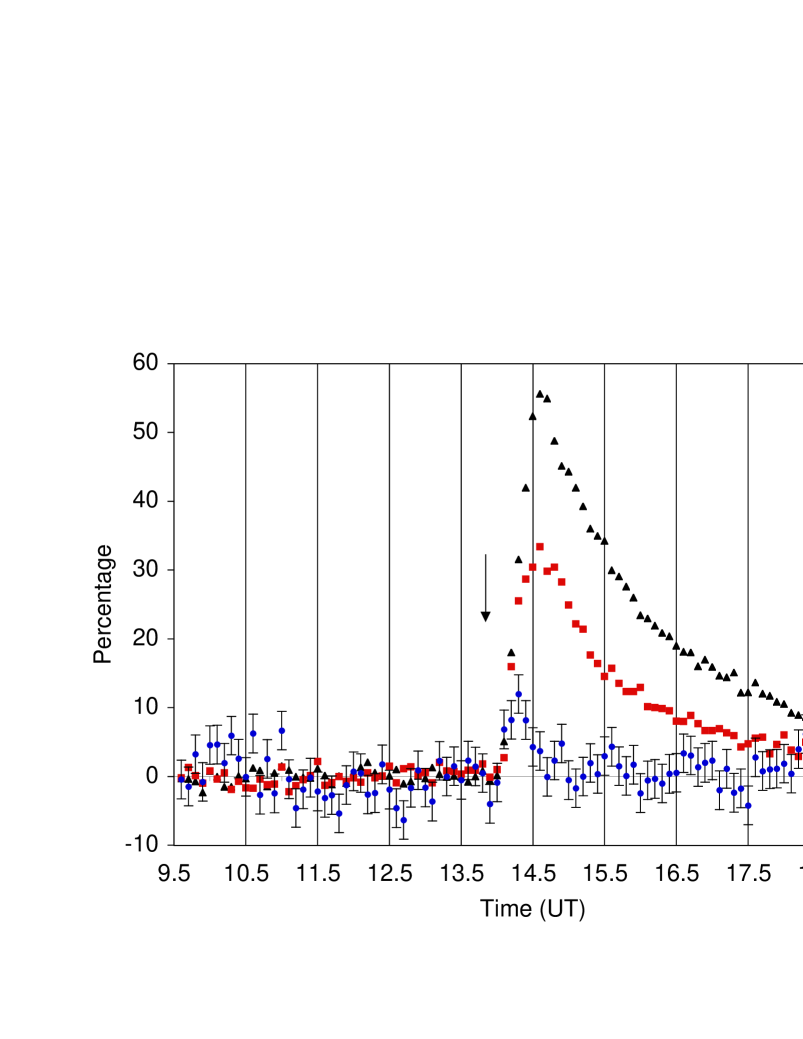
Data from the Newark [3], and Oulu [9] Neutron Monitor Stations are compared in Figure 1, the data for Climax [5] are very close to that of Newark and for clarity are not shown. The energy thresholds for the Climax, Newark, and Oulu neutron monitor stations are influenced by their vertical geomagnetic cutoff rigidity (3.0, 2.1, and 0.8 GV respectively) and overburden of air (their corresponding heights above sea level are 3400, 50, and 15 m). The corresponding numbers for GRAND are a geomagnetic cutoff rigidity of 1.9 GV and a height of 220 m above sea level. However, our primary energy is also influenced by the different mechanisms which produce muons (rather than neutrons) which subsequently reach detection level. While looking at single muon tracks at ground level, our threshold primary proton energy is 3 - 10 GeV [12], depending on the primary spectral index. Thus our peak is smaller in amplitude due to lower fluxes higher primary energies. The Newark signal has a half-height time at 14.21 hours, the Climax signal at 14.16 hours, and Oulu at 14.27 hours (where the half-height time is the time at which the data has risen above background to half of the highest measured data point of the GLE). A similar calculation for our half-height time is 14.09 hours which is 0.1 hour earlier (the earlier time might be expected on the basis of higher primary energies compared to the neutron monitors [2] with faster protons traveling at smaller pitch angles yielding shorter path lengths. The width (full width at half-of-maximum above background) of the Climax, Newark, and Oulu peaks are 1.27, 1.24, and 1.61 hours in contrast to our value of 0.48 hour. Our peak is thus 0.9 hours shorter in duration (typically, higher energies have a shorter duration than lower energies as is seen in satellite data for protons at lower energies.
3. Conclusions
Project GRAND sees a ground level signal with a significance of 6.1 when examining the secondary muon counting rate at ground level between 14.0 and 14.6 hours UT on April 15, 2001. This signal is obtained with no restrictions on the angle of the muons, consistent with protons originating at the surface of the sun and accelerated during the time of the X14 X-ray flare. Our data at angles from the direction of the sun show no increase; therefore our detection is not due to gamma rays or neutrons from the sun. Our GLE detection occurs 0.1 hour earlier than Climax, Newark, or Oulu neutron monitor signals and is shorter in duration which might be expected considering the higher energies involved.
The authors wish to thank M. Dunford, J. Vermedahl, and M. López del Puerto. Thanks to L. Miroshnichenko for preliminary intensity calculations and M. Shea and D. Smart for calculations of our asymptotic direction as a function of rigidity; The GOES science team, J. Clem and R. Pyle (Bartol Neutron Monitor Program funded through NSF Grant ATM-0000315), C. Lopate (Climax Neutron Monitor operated by The University of Chicago and funded through NSF grant ATM-9912341), and the Oulu Neutron Monitor for the use of their data. GRAND is funded through the University of Notre Dame and private grants.
4. References
1. Bieber J. et al. 2002, ApJ 567, 622
2. Clem J. and Dorman L. 2000, Space Science Review 93, 335
3. Clem J. and Pyle R. 2002, Private Communication
4. Falcone A., Ryan J., 1999, Astroparticle Physics 11, 283
5. Lopate C. 2002, Private Communication
6. Miroshnichenko L. 2001, Solar Cosmic Rays, (Kluwer, Norwell, MA)
7. Miroshnichenko L. 2002, Private Communication
8. Munakata K. et al. 2001, Proceedings of the 27th International Cosmic Ray Conferece (Hamburg), 3494
9. Oulu Neutron Monitor Website 2002, http://spaceweb.oulu.fi/projects/crs
10. Poirier J., Roesler S., Fasso A. 2002, Astroparticle Physics 17, 441
11. Poirier J., D’Andrea C. 2001, Proceedings of the 27th International Cosmic Ray Conferece (Hamburg), 3923
12. Poirier J., D’Andrea C. 2002, Journal of Geophysical Research 107, 1376
13. Shea M. and Smart D. 2002, Private Communication
14. Swinson D. B., Shea M. A. 1990, Geophysical Research Letters 8, 1073