11email: cappi@bo.astro.it 22institutetext: CERGA, Observatoire de la Côte d’Azur, BP4229, Le Mont–Gros, 06304 Nice Cedex 4, France
22email: benoist@obs-nice.fr 33institutetext: European Southern Observatory, Karl Schwartzschildsrtrae 2, D–85748 Garching bei München, Germany
33email: ldacosta@eso.org 44institutetext: CERGA, CNRS, Observatoire de la Côte d’Azur, BP4229, Le Mont–Gros, 06304 Nice Cedex 4, France
44email: maurogor@obs-nice.fr
Nature and Environment of Very Luminous Galaxies
The most luminous galaxies in the blue passband have a larger correlation amplitude than galaxies. They do not appear to be preferentially located in rich clusters or groups, but a significant fraction of them seem to be in systems which include fainter members. We present an analysis of fields centered on 18 Very Luminous Galaxies () selected from the Southern Sky Redshift Survey 2, based on new observations and public data of the 2dF Galaxy Redshift Survey; we present also additional data on a CfA VLG and on Arp 127. We find that all the selected VLGs are physically associated to fainter companions. Moreover, there is a relation between the VLG morphology (early or late) and the dynamical properties of the system, which reflects the morphology–density relation. 6 out of the 18 SSRS2 VLGs are early type galaxies: 2 are in the center of rich Abell clusters with velocity dispersion km/s, and the other 4 are in poor clusters or groups with . The VLG extracted from the CfA catalog is also an elliptical in a Zwicky cluster. The remaining 2/3 of the sample are late–type VLGs, generally found in poorer systems with a larger spread in velocity dispersion, from up to kms/s. The low velocity dispersion, late–type VLG dominated systems appear to be the analogous of our own Local Group. The possibile association of VLG systems to dark matter halos with mass comparable to rich groups or clusters, as suggested by the comparable correlation amplitude, would imply significant differences in the galaxy formation process. This work also shows that observing fields around VLGs represents an effective way of identifying galaxy systems which are not selected through other traditional techniques.
Key Words.:
Cosmology: observations - Galaxies: distances and redshifts - Galaxies: kinematics and dynamics1 Introduction
From the analysis of the Southern Sky Redshift Survey 2 (SSRS2, da Costa et al. 1994), we have found that the amplitude of galaxy clustering increases significantly as a function of galaxy luminosity, but only when (Benoist et al. 1996; see also Willmer et al. 1998); moreover, the analysis of high–order moments shows that the bias is not linear, without a significant dependence on scale (Benoist et al. 1999), analogously to the bias between clusters and galaxies (Cappi & Maurogordato 1995). We have also found that the clustering amplitude of the most luminous galaxies in the sample, having absolute magnitude (i.e. ), which we defined as Very Luminous Galaxies (VLGs), is similar to that of clusters, with a correlation length Mpc. From the analysis of the 2dF Galaxy Redshift Survey (2dFGRS) Norberg et al. (2001) have confirmed the reality of luminosity segregation for galaxies more luminous than , even if their most luminous galaxies show a correlation amplitude not so high as the SSRS2 VLGs.
The large value of the VLG correlation function could be explained if VLGs were in clusters, as originally suggested by Hamilton (1984): in this case, most of them should be luminous ellipticals. However, in our statistical analysis of the SSRS2 VLGs (Cappi et al. 1998, Paper I) we have shown that the fractions of the different morphological types are comparable to lower luminosity samples, and that most of the VLGs are not in rich clusters. Only a minority of VLGs were found in known groups, but in most cases our visual inspection of the Digitized Sky Survey images revealed the presence of fainter companions, often with signs of interaction.
In fact, if VLGs are neither in clusters nor in rich groups, they can nevertheless be associated to poorer systems. In biased galaxy formation (Kaiser 1984; Bardeen et al. 1986) more massive halos, which represent rare fluctuations of the matter density field, have a larger correlation amplitude. This suggests an association of VLGs to high density peaks; the fact that they are dominant galaxies in poor systems with much fainter galaxies can have interesting implications, concerning for example the efficiency of galaxy formation or the overabundance of predicted subhalos relative to the observed dwarf satellites of the Milky Way and M31 (see e.g. Moore et al. 1999): for this reason, it would be useful to have a statistical sample of galaxy systems similar to our own Local Group.
Unfortunately the properties of poor galaxy systems, especially those comparable to the Local Group, are not well known. Zabludoff & Mulchaey (2000) have studied a sample of six nearby poor groups, finding evidence for a different luminosity function, with an increasing dwarf to giant galaxy ratio with the mass density of the system. More generally, Zabludoff & Mulchaey (1998, 2000) have examined the properties of 12 poor groups of galaxies with PSPC images: 9 of them have diffuse X–ray emission and a bright, central elliptical galaxy.
Our approach is complementary, as it selects another class of poor systems. In fact, a main problem is the bias on the properties of the selected galaxy groups due to the adopted selection criteria. A selection algorithm defines a priori the properties of the systems: well known examples are Abell clusters (Abell 1958) and Hickson compact groups (Hickson 1982). The introduction of automated methods can give a more objective selection, but it is obviously impossible to recover a system if only its most luminous member is present in the original photometric catalogue. Moreover, the typical friends–of–friends algorithms used to select “galaxy groups” require the detection of at least three neighbouring galaxies above the limiting magnitude of the catalogue (see e.g. White et al. 1999): this means that many groups are classified as “binaries”. It is clear that the problem becomes critical when going towards poorer and more distant systems, with increasing contamination and spurious detections.
Let us take the best example of VLG system, i.e. our Local Group, which contains two VLGs: M31 and our Milky Way (with respectively and , see van den Bergh 1999 and references therein), and is usually considered as a “typical group”. If this is true, it is surely not reflected in group catalogs, for a simple reason: VLGs are rare galaxies. For example, the third brightest galaxy of the Local Group M33 (with an absolute magnitude ) would become fainter than (i.e. fainter than the limit of the SSRS2) already at . Therefore we do not know if the properties of our Local Group are really “typical”, and only looking deeper at VLG fields we can expect to find other groups similar to our own.
In order to construct a statistical sample including, among others, also systems comparable to our Local Group, we have decided to investigate the environment of the VLGs listed in our catalogue defined in paper I, which represent a volume–limited sample. The first step is to measure redshifts of fainter galaxies in the field of VLGs and determine the membership and velocity dispersion of the systems: in this paper we discuss data concerning the fields of 19 VLGs. In section 2 we define our sample, with the VLG fields we observed at the Observatoire de Haute Provence and the selection of galaxies around VLGs extracted from the 2dFGRS; section 3 presents the individual properties of the systems, while in section 4 we discuss the relation between the VLGs and their environment. Our conclusions are in section 5. In appendix A we also discuss Arp 127, a pair identified in our preliminary selection as possibly including a VLG, and in appendix B we give positions, magnitudes and redshifts of 2dFGRS galaxies in our VLG systems.
2 Definition of the sample
Three VLGs were selected from our catalogue of VLGs (see table 1 in paper I), while a fourth galaxy satisfying the VLG definition was selected from the CfA catalogue (see Geller & Huchra 1989); the 4 VLG fields were observed at OHP. Other 15 VLG fields were extracted from the 2dFGRS public catalogue, which has an overlap with the SSRS2. While partially imposed by observational constraints (see below), our selection is random with respect to the VLG properties, and should be representative of the whole sample. In fact, one third of the selected VLGs are early–type galaxies, a fraction consistent with that of the total sample published in paper I.
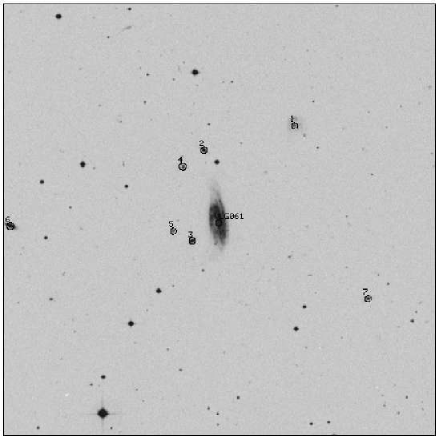
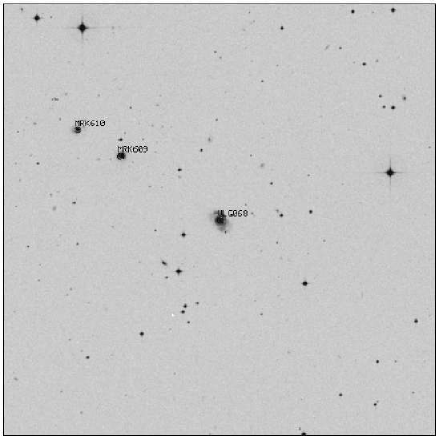
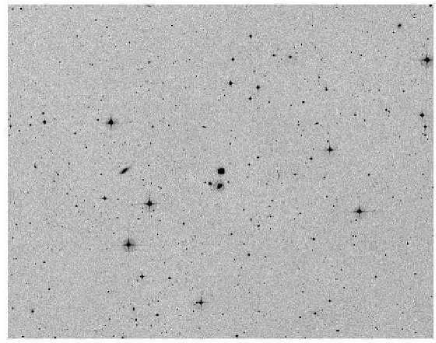
VLG061: finding chart. VLG068: finding chart
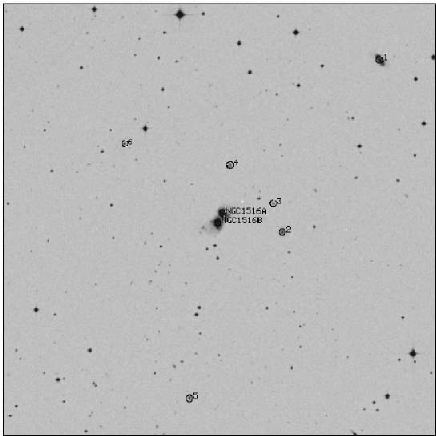
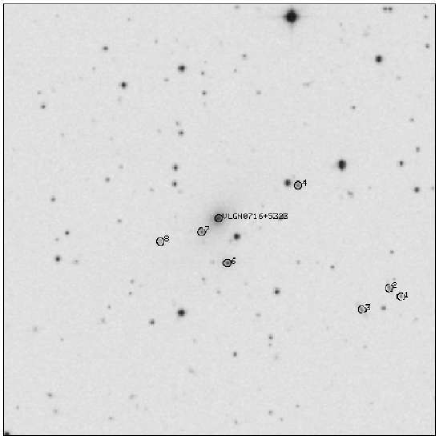
VLG074: finding chart. Z1261: finding chart
VLG014 VLG022
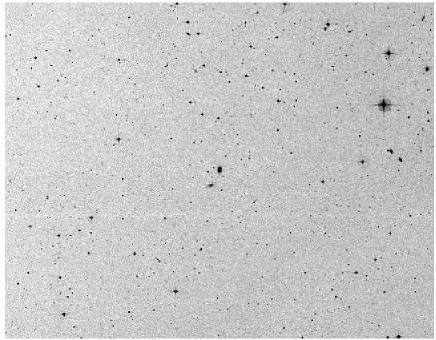
VLG031 VLG040
VLG043 VLG045
VLG048 VLG053
![[Uncaptioned image]](/html/astro-ph/0306362/assets/x11.png)
![[Uncaptioned image]](/html/astro-ph/0306362/assets/x12.png)
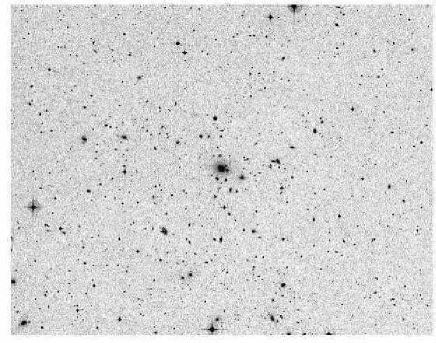
VLG069 VLG083
![[Uncaptioned image]](/html/astro-ph/0306362/assets/x13.png)
![[Uncaptioned image]](/html/astro-ph/0306362/assets/x14.png)
VLG086 VLG093
![[Uncaptioned image]](/html/astro-ph/0306362/assets/x15.png)
![[Uncaptioned image]](/html/astro-ph/0306362/assets/x16.png)
VLG094 VLG108
![[Uncaptioned image]](/html/astro-ph/0306362/assets/x17.png)
![[Uncaptioned image]](/html/astro-ph/0306362/assets/x18.png)
VLG109
![[Uncaptioned image]](/html/astro-ph/0306362/assets/x19.png)
2.1 Systems observed at OHP
At the Observatoire de Haute–Provence we could observe only galaxies at , while SSRS2 galaxies are south of . Among the 12 VLGs in our catalogue which satisfied this declination constraint, we chose three VLGs around which an inspection of DSS images had revealed the presence of galaxies fainter than the VLG but still bright enough to get a useful spectrum at the 1.93m telescope. The selected VLGs are VLG061, VLG068 and VLG074. In order to cover the whole night, we included also a VLG galaxy selected from the CfA catalogue (VLG 0716+5323), and Arp 127, a galaxy we had included in a preliminary version of the VLG catalogue but finally excluded for its discrepant redshift and the consequent uncertainty on its absolute magnitude. This system is presented in appendix A.
Our observations were carried out in 1997 at the 1.93m telescope with the Carelec spectrograph in long slit mode at the Cassegrain focus. The grating dispersion was 260Å/mm, corresponding to Åwith the 512512 pixels of the Tektronix CCD. Data reduction was performed with IRAF; calibrations were done using the OHP He–Ar lamps. Redshifts were measured with xcsao in the rvsao package, using 5 star templates and attributing to each galaxy the redshift given by the best–fitting template (i.e. the one with the highest parameter, see Tonry & Davis 1979). One velocity standard star and one galaxy with velocity measured from HI observations were also observed and used as a check of the zero–point calibration, cross–correlating them with a subset of our spectra and with our templates: in both cases, the redshifts were consistent within 10 km/s.
Positions and redshifts of the observed galaxies are listed in table 1.
| Iden. | RA (J2000) | DEC (J2000) | (km/s) | Error | Notes |
| VLG061 | 02 30 42.7 | -02 56 21 | 5719 | 31 | |
| 1 | 02 30 32.1 | -02 53 07 | 5950 | 24 | Emission lines |
| 2 | 02 30 44.7 | -02 53 58 | 5488 | 36 | |
| 3 | 02 30 46.4 | -02 57 06 | 5561 | 28 | |
| 4 | 02 30 47.6 | -02 54 32 | 5870 | 20 | Emission lines |
| 5 | 02 30 48.9 | -02 56 46 | 5189 | 91 | |
| 6 | 02 31 11.6 | -02 56 35 | 5847 | 31 | m=15.76 |
| 7 | 02 30 21.9 | -02 59 07 | 12498 | 56 | |
| VLG068 | 03 25 11.5 | -06 10 52 | 9933 | 48 | V=10107 m=13.97 |
| MRK0609 | 03 25 25.3 | -06 08 38 | 10264 | 57 | V=10236 |
| MRK0610 | 03 25 31.4 | -06 07 43 | 10408 | 55 | V=10301 |
| VLG074a | 04 08 07.4 | -08 49 45 | 9930 | 50 | NGC1516A |
| VLG074b | 04 08 08.2 | -08 50 06 | 9864 | 45 | NGC1516B |
| 1 | 04 07 45.3 | -08 44 26 | 10073 | 37 | |
| 2 | 04 07 59.0 | -08 50 24 | 36482 | 61 | |
| 3 | 04 08 00.3 | -08 49 24 | 46248 | 65 | , [OIII]4959 & 5007 |
| 4 | 04 08 06.4 | -08 48 04 | 36342 | 101 | |
| 5 | 04 08 12.1 | -08 56 11 | 42342 | 95 | |
| 6 | 04 08 21.1 | -08 47 20 | 36254 | 45 | |
| VLG 0716+5323 | 07 16 41.2 | 53 23 09 | 19069 | 41 | m=14.0, V=19307, X–ray |
| 1 | 07 16 19.9 | 53 21 51 | 137 | 17 | Star |
| 2 | 07 16 21.2 | 53 21 59 | 19048 | 32 | |
| 3 | 07 16 24.4 | 53 21 37 | 19573 | 25 | |
| 4 | 07 16 32.0 | 53 23 45 | 18330 | 44 | |
| 5 | 07 16 38.1 | 53 15 38 | 19781 | 47 | |
| 6 | 07 16 40.0 | 53 22 23 | 19904 | 43 | |
| 7 | 07 16 43.1 | 53 22 55 | 20522 | 73 | |
| 8 | 07 16 47.9 | 53 22 45 | 19066 | 57 | |
| 9 | 07 17 29.2 | 53 24 45 | 19043 | 42 |
2.2 2dFGRS data
Part of the SSRS2 region is covered by the 2dFRS (see Colless et al. 2001), and we searched for galaxies around VLG positions in the presently available public catalogue (the “100k” catalogue111electronically available at the address http://msowww.anu.edu.au/2dFGRS/Public/main.html, including more than 102,000 redshifts).
The limiting magnitude of the 2dFGRS is ; within the maximum distance defined by the SSRS2 VLG volume–limited sample (), the 2dFGRS is volume–limited at (of course the field incompleteness has to be taken into account).
We selected all galaxies in the 2dFGRS within a projected separation less than 1.5 Mpc and a velocity difference less than 1500 km/s with respect to the SSRS2 VLGs. The velocity cut was chosen to limit foreground and background contamination, but large enough to include also marginal members. We also applied a 3– clipping (see e.g. Yahil & Vidal 1977) to the velocity distribution. The chosen value of the projected radius corresponds to one Abell radius and it is also used as a criterion for determining the Local Group membership (van den Bergh 1999). We found data for 19 VLG fields: in 4 cases (VLG003, VLG008, VLG054, VLG075) we could retrieve only one redshift (in addition to the VLG) with our selection limits. Such cases deserve a more careful study and we will not include them in the present work. We simply note here that VLG075 is in a group identified in the Las Campanas Redshift Survey (Tucker et al. 2000). In the other 15 fields we could obtain at least 5 redshifts (reduced to 3 by the 3 clipping in the case of VLG022).
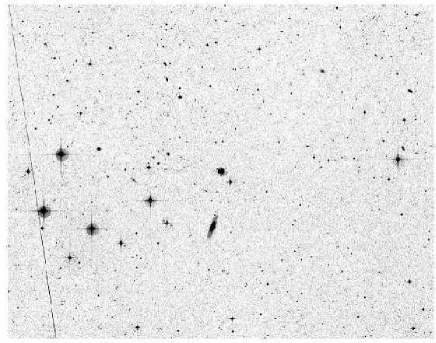
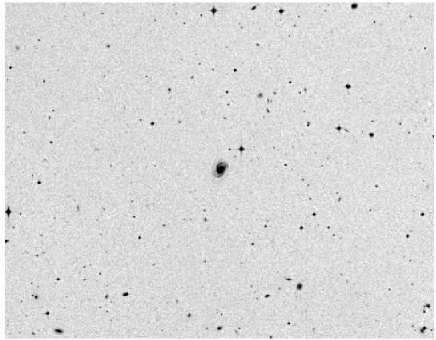
The images of the fields centered on the selected VLGs (30 arcmin size in ) were retrieved from the Digitized Sky Survey and are shown in figures 1 and 2. In appendix B and in tables available in electronic form we give positions and redshifts of the 2dFGRS galaxies selected according to the criteria defined above.
3 Properties of the VLG systems
We have calculated the mean redshift and the velocity dispersion for each VLG system; the main properties are shown in table 2, where we list in column (1) the VLG number, in column (2) the VLG morphological type, in column (3) the total number of galaxies after applying the 3– clipping and used for measuring the mean redshift and velocity dispersion, in column (4) the mean heliocentric redshift with its error, in column (5) the velocity dispersion, in column (6) the system type, when available from the literature.
With respect to the known systems listed in table 2 of our paper I, we could associate other 8 VLGs to galaxy systems, and increase the number of measured velocity dispersions: in fact only VLG086 (in an Hickson compact group) and VLG108 (in the ACO cluster A4038) had already an estimate of the velocity dispersion.
| Ident. | Type | (km/s) | System Type | ||
|---|---|---|---|---|---|
| 14 | Sbc | 14 | Triplet | ||
| 22 | S0 | 3 | SCG55 | ||
| 31 | D | 15 | A151 | ||
| 40 | S | 10 | — | ||
| 43 | Sb | 15 | — | ||
| 45 | S | 21 | — | ||
| 48 | Sbc | 20 | Binary | ||
| 53 | S0 | 33 | — | ||
| 61 | SB(rs)c | 7 | — | ||
| 68 | S Sy1 | 3 | SSRS2 group | ||
| 69 | SB(s)b p | 8 | Binary | ||
| 74 | S | 3 | Binary | ||
| 83 | E | 31 | S0983 | ||
| 86 | SB(s)bc p:Sy | 37 | HCG91 | ||
| 93 | Sb | 15 | — | ||
| 94 | SAB(rs)p | 39 | EDCC155 | ||
| 108 | cD | 114 | A4038 | ||
| 109 | E | 13 | S1155 | ||
| VLGN 0716+5323 | E | 9 | Z1261 |
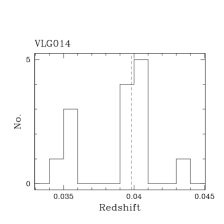
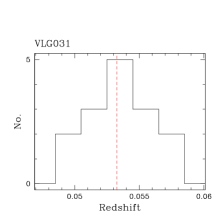
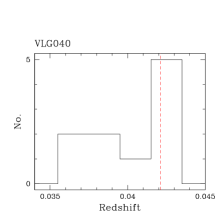
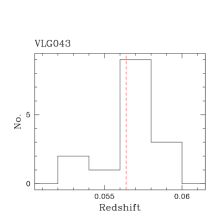
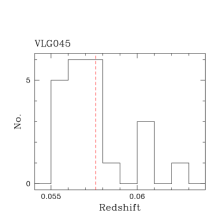
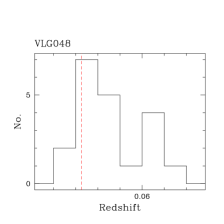
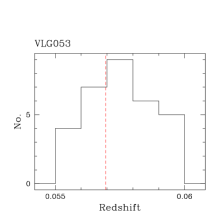
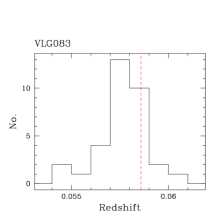
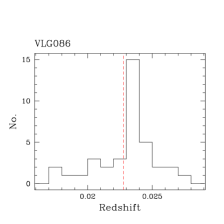
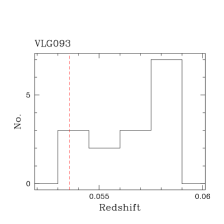
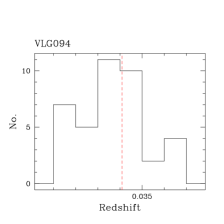
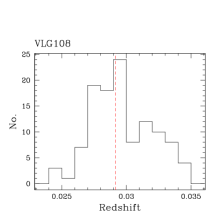
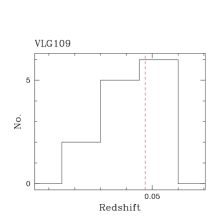
In figure 3 we show the velocity histograms of the systems with at least 10 measured redshifts. The redshift of the VLG is indicated by a dashed line.
From table 2, and also taking into account the 4 VLGs not included in this selection, it appears that all VLGs have companions. This is not so surprising, given the known correlation between galaxies, and confirms the idea that there are no truly “isolated” galaxies. Moreover, it is quite striking that in the literature 6 out of the 18 SSRS2 VLGs were not associated to any system, while other 3 were classified simply as binaries: for example, VLG048 belongs to a system for which we could collect 15 new redshifts from the 2dFGRS. Such a high number of nearby galaxy systems which were not previously identified neither in the optical nor in the X–ray reminds us how poorly known the low–mass end of galaxy systems is. Therefore it is interesting to examine in more detail the nature and environment in which VLGs are found. In the following, we briefly describe the main properties of the selected VLGs and their systems.
-
•
VLG014 is an Sbc spiral in a known triplet, which appears to be in a larger system: including the information from the 2dFGRS, we have a total of 14 galaxies with redshift. The 3– clipping algorithm does not exclude any of these galaxies, but 5 of them are apparently in foreground and background, contributing to the formally large velocity dispersion of the system, km/s; when considering only the central 9 galaxies (which include the VLG) concentrated at , the velocity dispersion is only km/s.
-
•
VLG022 is an S0 in a known compact group, SCG55, identified with an automated algorithm by Prandoni et al. (1997). Five galaxies are within 1.5 Mpc in projected distance and 1500 km/s in velocity from the VLG, but two are excluded by the 3 clipping.
-
•
VLG031, a D galaxy, is the dominant galaxy of A151. In our selection there is only another VLG (VLG108) associated to a rich Abell cluster. The VLG redshift is at the center of the velocity distribution, which is regular and consistent with a Gaussian. For this system we measure a velocity dispersion km/s.
-
•
VLG040 is a spiral in a system with a relatively large velocity dispersion (more than km/s); however, the velocity histogram shows that this value is probably affected by foreground galaxies. The VLG is in the concentration at .
-
•
VLG043 is an Sb galaxy previously not associated to a known system; now we have identified a group with 15 galaxies having measured redshifts, and a velocity dispersion of km/s. The velocity histogram is not symmetric, with two galaxies which could be in the foreground, having a velocity difference of about 1100 km/s with respect to the cluster mean.
-
•
VLG045 is a spiral classified in our original catalog as an “isolated” galaxy, as no known system was found in the literature. Within the search radius we have found other 20 2dFGRS galaxies, and only one of them was rejected by the 3- clipping algorithm. The velocity histogram presents a well defined peak, with 4 galaxies in the background. The velocity dispersion of the system is km/s. All these galaxies are much fainter than the VLG, which has an apparent magnitude of : the second brightest galaxy has , while the others are fainter than . Notice however that these fainter galaxies have still a significant intrinsic luminosity: the second member has an absolute magnitude brighter than .
-
•
VLG048 is an Sbc galaxy member of a known binary system: however, with the 2dFGRS data we have 20 galaxy redshifts for this system. The velocity histogram shows a main peak including the VLG, and a secondary peak in the background.
-
•
VLG053 is an S0 galaxy previously not associated to a known system, but looking at the Digital Sky Survey image we had identified a few other bright galaxies. We can now confirm the reality of a group, with other 32 2dFGRS galaxies: its velocity histogram is consistent with a Gaussian distribution, with a velocity dispersion of km/s.
-
•
VLG061 is a large spiral galaxy, and also in this case, while it was not associated to any known group or cluster, we had identified many fainter galaxies in the field; 6 of them were selected and observed at OHP, and their redshifts were found to be comparable to that of the VLG. The velocity dispersion of the system is km/s. Galaxy (see table 1) has a bright HII region outside the nucleus; in its spectrum we have detected in emission, the two [OIII] lines at 4959 and 5007 Å, and [NII] lines (while [OII]3727 is outside our spectral range).
-
•
VLG068 was already known to be in a group: we could only measure the redshifts of the three main components. However, we show this system as a further example of how different can be the environment of a VLG from that of a typical cluster. The main companions of the VLG are two Markarian galaxies, already known in the literature. MRK609 is a Seyfert 1.8, with prominent emission lines (, [OIII] and ).
-
•
VLG069 is a peculiar spiral galaxy in interaction in a binary system. Its redshift is quite precise, having been measured also in . From the 2dFGRS we have obtained a few other redshifts, but there is some problem with the identification of the binary. At the position of the VLG, the 2dFGRS gives a galaxy with a redshift consistent with the SSRS2, but the magnitude is significantly underestimated. We have kept the SSRS2 measure in the table. The 2dFGRS gives also the redshift of a second nearby galaxy, with coordinate approximately corresponding to the center of the binary system and a bright magnitude (14.09). It could correspond to the companion of the VLG, and we have included it in our table. In conclusion, 8 galaxies are now included as members of the group after the 3– clipping. This system has a relatively low velocity dispersion (160 km/s).
-
•
VLG074 is in fact a pair of interacting galaxies (NGC1516 A & B), also detected by IRAS. The redshift was measured by Strauss et al. (1992), attributing the coordinates to the center of the pair. These coordinates and redshifts were included in the SSRS2 and in our VLG catalog. It is possible that the magnitude of the brightest member was not correctly estimated, given the proximity of the two galaxies. We have measured the redshifts of both, which differ by less than 100 km/s (see table 1). A third galaxy among those we have observed belongs to the system, while the other, fainter galaxies in the field are in the background, with a concentration at .
-
•
VLG083 is an elliptical galaxy within 0.5 arcmin from the center of the poor Abell cluster S0983. In this field we have found other 30 2dFGRS galaxies: the velocity dispersion of the system is km/s.
-
•
VLG086 is a Seyfert galaxy in a Hickson Compact Group (HCG91). The VLG is in interaction with a nearby SB0. This group is quite rich: 37 galaxies have measured redshifts and none of them is rejected by the 3– clipping algorithm, giving a quite large velocity dispersion of km/s. However, there is a well defined central peak at , which corresponds to the mean redshift of the system and also to the redshift of the VLG. This should probably be considered as the main group. Note that we have excluded from our analysis a 2dFGRS galaxy, identified in the NASA Extragalactic Database as 2dFGRS S175Z138, with coordinates (, ) , near to –but not coincident with– the VLG center. It might be identified with the VLG or alternatively with the SB0 interacting with the VLG.
-
•
VLG093 is an Sb in a field for which we have now 15 redshifts. The 3– clipping does not exclude any of these galaxies; however, the histogram is asymmetric, and the VLG, not present in the 2dFGRS catalogue, is in the first velocity bin, while the peak is in the last bin (the velocity difference is km/s). Therefore we can conclude that there is a group in the field, but it is not clear if it is really associated to the VLG.
-
•
VLG094 is a peculiar spiral in a poor cluster listed in the Edinburgh/Durham Cluster Catalog (EDCC155; Lumsden et al. 1992). The redshift of the VLG is comparable to the average redshift and is near the velocity peak. The velocity dispersion, km/s, is quite typical of a rich group.
-
•
VLG108 is the cD galaxy in the Abell cluster A4038. The usually quoted velocity dispersion of this cluster is larger ( km/s in Struble & Rood 1999) than our estimate of km/s. However, as shown by Fadda et al. (1996), this apparently regular cluster has two different peaks in velocity (the two peaks can also be seen in our velocity histogram, see figure 3). Our velocity dispersion is in excellent agreement with the X–ray temperature, keV (Finoguenov et al. 2001); for example, using the Lubin & Bahcall empirical relation (1993), , we would expect km/s.
-
•
VLG109 is an elliptical VLG in the poor cluster S1155, which has a velocity dispersion comparable to S0983 (see VLG083), km/s.
-
•
VLG 0716+5323, which we selected from the CfA catalog, is another example of an early–type VLG. It is in a Zwicky cluster (Z1261), with an extended X–ray emission centered at 0.5 arcmin from the VLG. This cluster, detected by the Einstein satellite, is also included in the ROSAT Brightest Cluster Sample (Ebeling et al. 1998), with a luminosity erg/s. For this cluster there was no previous measured redshift except for the VLG (Gregory & Burns 1982). At OHP we could measure the redshifts of 9 galaxies, VLG included. The resulting velocity dispersion of the system, km/s, is typical of a poor cluster. The agreement of the velocity dispersion with the cluster temperature, keV (Ebeling et al. 1998), is excellent: from the Lubin & Bahcall (1993) fit we would expect km/s.
4 The relation between VLGs and their environment
In paper I we have shown that the correlation function of VLGs approaches that of clusters. Various galaxies discussed above (VLG045, VLG048, VLG053) are within the Pisces–Cetus Supercluster, which appears as a prominent feature near the limiting depth of the SSRS2 volume–limited sample of VLGs (the presence of this structure might explain the excess of the VLG correlation amplitude measured in the SSRS2 with respect to the 2dFGRS). The Pisces–Cetus supercluster is well traced by Abell and ACO clusters (Tully 1986), but none of our VLGs is a member of those clusters. The VLG correlation function is large because VLGs trace large–scale fluctuations just as clusters do, not because they are in rich clusters.
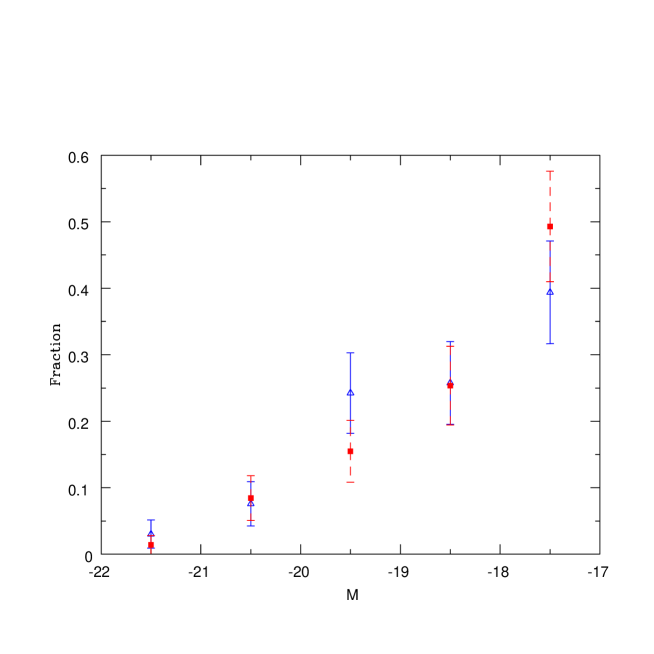
Another interesting issue is the luminosity function of the VLG systems. In principle, merging should have played a major role in the formation of the elliptical VLGs, and the luminosity function of the associated system might be different from those dominated by a spiral VLG. As a preliminary test, we have estimated the composite luminosity functions of early and late VLG dominated systems, excluding both rich clusters and systems with probable field contamination. In this rough comparison, we assume that selection effects are the same for the two types of systems. We have normalized numbers to the total number of galaxies in the two samples (66 for spiral VLG and 71 for elliptical VLG systems). In deriving absolute magnitudes, we applied the mean K + e correction formula adopted by Norberg et al. (2001); at the distances of SSRS2 VLGs (), it is consistent with the correction adopted for the SSRS2 (da Costa et al. 1994; ). As apparent from figure 4, taking into account the small number of objects in our samples we cannot find significant differences between the two luminosity functions to , the absolute limiting magnitude at which galaxies around SSRS2 VLGs could still be detected in the 2dFGRS.
There is however a difference when looking at the morphology of the central VLG and the velocity dispersion of the associated system. It is not surprising that the VLGs which are at the center of clusters are giant ellipticals; these clusters have km/s and an associated X–ray emission at a temperature consistent with their velocity dispersion. Other 3 systems including an early type VLG (one S0 and two ellipticals) have velocity dispersions in the range 300–350 km/s, and might be considered the low–mass end of galaxy clusters. The remaining S0 in the sample is in a compact group with a small velocity dispersion ( km/s).
The systems dominated by a spiral VLG have a large spread in velocity dispersion: but as we have seen from the velocity histograms, those with the largest velocity dispersions ( km/s), VLG014, VLG040 and VLG086, are probably affected by field contamination. Moreover, for these systems no extended X–ray emission is reported in the on–line databases.
Within the limits of the small statistics and lack of completeness, we can conclude that VLGs are in a qualitative agreement with the morphology–density relation: in clusters and rich groups we find only early type VLGs, while among systems originally classified as binaries or triplets, and those with the lowest velocity dispersions (with the exception of the S0 VLG022) the VLG is a late–type.
The nearby systems we have observed at OHP have lower velocity dispersions, and have probably also a lower richness but the limiting apparent magnitude is also brighter for these systems. The system more similar to our own Local Group is the one associated to VLG069. It has 10 galaxies with measured redshifts and : even if this is still not a complete sample, the number is comparable to the Local Group, where we find 10 galaxies with . VLG069 is the main member of a binary system, as Andromeda and the Milky Way; moreover, the VLG069 system has also a relatively low velocity dispersion, km/s, still somewhat higher than the velocity dispersion of the Local Group, km/s (van den Bergh 1999, 2000), which is indeed lower than the observed range of our VLG systems. However, our observational errors would not allow us to measure accurately such a low velocity dispersion.
Our optical classification of VLG systems can be compared to the X–ray based classification of galaxy groups by Zabludoff & Mulchaey (1998), who distinguish groups with a bright, central elliptical galaxy and smooth X–ray emission from the hot IGM, and groups without X–ray emission, a few bright late–type galaxies with fainter members, like our Local Group. Our systems with an early–type VLG have generally velocity dispersion and richness comparable to the values found by ZM98 for their 9 poor groups with diffuse X–ray emission. They also find that the 3 groups without X–ray emission have a lower number of members, which seems also consistent with what we find. Zabludoff (1999) has suggested the possibile existence of a third class of groups in a transition phase, but it has still to be demonstrated that the differences between the two classes might be due to evolution instead of their different formation processes.
5 Discussion and conclusions
The number density of galaxies is dominated by faint, small systems. As an example, let us assume a Schechter luminosity function with , and (Zucca et al. 1997). The fraction of galaxies brighter than is in fact less than 2% of all galaxies with . The brightest galaxies with are only 3 out of 10000. Among these galaxies, we find M31 and probably the Milky Way (see e.g. van den Berg 1999), which are therefore not typical galaxies, but very special systems. Nevertheless, when looking at the luminosity (mass) density, the contribution of Very Luminous Galaxies (VLGs) with to the luminosity density increases to 1.6% and that of galaxies to nearly 30%. VLGs are extremely interesting from the point of view of galaxy formation and large–scale structure. They are visible at large distances ( Mpc at the limiting magnitude of the SSRS2 ) and their distribution is biased with respect to galaxies of lower luminosity.
There is a common misconception, according to which optically very luminous galaxies selected with a large correlation amplitude are early–type galaxies in clusters. In this work we have shown that, at least choosing galaxies in the blue passband, this is not the case. We have presented our observations and 2dFGRS data concerning fields centered on SSRS2 VLGs: we have found clear evidence that VLGs are the brightest members of galaxy systems which can escape standard group finding methods, except of course for the minority of early–type VLGs in rich groups or clusters. VLGs have clustering properties similar to clusters, but most of them are in systems with a galaxy population comparable to loose groups, and some of them are probably comparable to our Local Group. The large correlation amplitude suggests that VLGs are in high density regions; most of them, being spirals, cannot have accreted more than a few percent of their mass through major merging episodes (Tóth & Ostriker 1992), so we have to suppose that these systems already formed with a large, central massive galaxy and low mass companions. On the other hand, the merging of two late–type VLGs could evolve into an early type system, analogously to what was suggested for poor groups by Zabludoff & Mulchaey (1999).
Other recent works appear to confirm the general properties of VLGs which we have found from the analysis of the SSRS2. Giuricin et al. (2001) have analysed the Nearby Optical Galaxy sample, finding a similar trend for the luminosity segregation, and that only 10% of their VLGs reside in clusters; they also find that, while the fraction of very luminous early–type galaxies is larger than the corresponding fraction for the total sample, it is still only %, less than than the fraction of Scd galaxies (39%). Moreover, from the analysis of the 2dFGRS Norberg et al. (2002) confirm that “luminosity, and not type, is the dominant factor in determining how the clustering strength of the whole galaxy population varies with luminosity”.
The amount of mass associated to VLG systems is still an open question. For example, the lower correlation amplitude for VLGs found in the 2dFGRS would indicate that VLGs are associated to dark halos less massive than typical halo clusters. The increase in local overdensity of galaxies around VLGs should also be better determined. In a recent paper Hogg et al. (2003) analyse the Sloan Digital Sky Survey and find the intriguing results that blue luminous galaxies with are not apparently found in overdensities, but VLGs have even larger luminosities.
Therefore only further and deeper observations devoted to the detailed study of VLGs, determining the luminosity function of these systems and the dynamics of satellites around the VLGs, together with observations in redder passbands (more representative of the mass of the systems) will shed more light on the properties of VLGs and their environment, and their implications for galaxy formation and evolution.
Acknowledgements.
This work has been partially supported by the Italian Space Agency grants ASI-I-R-105-00 and ASI-I-R-037-01, and by the Italian Ministery (MIUR) grant COFIN2001 “Clusters and groups of galaxies: the interplay between dark and baryonic matter”. We thank the referee, Florence Durret, for her careful reading of the manuscript and useful comments.References
- (1) Abell G.O., 1958, ApJS 3, 211
- (2) Alonso M.V., da Costa L.N., Pellegrini P.S., Kurtz M.J., 1993, AJ 106, 676
- (3) Alonso M.V., da Costa L.N., Latham D.W., Pellegrini P.S., Milone A.A.E., 1994, AJ 108, 1987
- (4) Arp H., 1966, ApJS 14, 1
- (5) Bardeen J.R., Bond J.R., Kaiser N., Szalay A.S., 1986, ApJ 314, 15
- (6) Beers T.C., Forman W., Huchra J.P., Jones C., Gebhardt K., 1991, AJ 102, 1581
- (7) Benoist C., Cappi A., da Costa L.N., Maurogordato S., Bouchet F., Schaeffer R., 1999, ApJ 514, 563
- (8) Benoist C., Maurogordato S., da Costa L.N., Cappi A., Schaeffer R., 1996, ApJ 472, 452
- (9) Cappi A., Benoist C., da Costa L.N., Maurogordato S., 1998, AA 335, 779 (Paper I)
- (10) Cappi A., da Costa L.N., Benoist C., Maurogordato S., Pellegrini P.S., 1998, AJ 115, 2250
- (11) Cappi A., Maurogordato S., 1995, ApJ 438, 507
- (12) Colless M. et al., 2001, MNRAS 328, 1039
- (13) da Costa L.N. et al., ApJ 424, L1
- (14) Durret F., Felenbok P., Lobo C., Slezak E., 1998, AAS 129, 281
- (15) Ebeling H., Edge A.C., Böhringer H., Allen S.W., Crawford C.S., Fabian A.C., Voges W., Huchra J.P., 1998, MNRAS 301, 881
- (16) Fadda D., Girardi M., Giuricin G., Mardirossian F., Mezzetti M., 1996, ApJ 473, 670
- (17) Finoguenov A., Arnaud M., David L.P., 2001, ApJ 555, 191
- (18) Geller M.J., Huchra J.P., 1989, Science 246, 897
- (19) Giuricin G., Samurović S., Girardi M., Mezzetti M., Marinoni C., 2001, ApJ 554, 857
- (20) Gregory S.A., Burns J.O., 1982, ApJ 255, 373
- (21) Hamilton A.J.S., 1988, ApJ 331, L59
- (22) Hickson P., 1982, ApJ 255, 382
- (23) Hogg D.W. et al., 2003, ApJ 585, L5
- (24) Huchra J., Latham D.W., da Costa L.N., Pellegrini P.S., Willmer C.N.A., 1993, AJ 105, 1637
- (25) Kaiser N., 1984, ApJ 284, L9
- (26) Lubin L.M., Bahcall N.A., 1993, ApJ 415, L17
- (27) Lumsden S.L., Nichol R.C., Collins C.A., Guzzo L., 1992, MNRAS 258, 1
- (28) Maddox S.J. Efstathiou G., Sutherland W.J., Loveday J., 1990a, MNRAS 243, 692
- (29) Maddox S.J. Efstathiou G., Sutherland W.J., Loveday J., 1990b, MNRAS 246, 433
- (30) Maddox S.J. Efstathiou G., Sutherland W.J., Loveday J., 1996, MNRAS 283, 1227
- (31) Moore B., Ghigna S., Governato F., Lake G., Quinn T., Stadel J. Tozzi P., 1999, ApJ 524, L19
- (32) Mulchaey J.S., Zabludoff A.I., 1998, ApJ 496, 73
- (33) Norberg P. et al. (the 2dFGRS collaboration), 2001, MNRAS 328, 64
- (34) Norberg P. et al. (the 2dFGRS collaboration), 2002, MNRAS 332, 827
- (35) Norberg P. et al. (the 2dFGRS collaboration), 2002, MNRAS 336, 907
- (36) Prandoni I., Iovino A., MacGillivray H.T., 1994, AJ 107, 1235
- (37) Reshetnikov V., Combes F., 1996, AAS 116, 417
- (38) Strauss M.A., Huchra J.P. Davies M., Yahil A., Fisher K.B., Tonry J., 1992, ApJS 83, 29
- (39) Tonry J., Davis M., 1979, AJ 84, 1511
- (40) Tóth G., Ostriker J.P., 1992, ApJ 389, 5
- (41) Tucker D.L. et al., 2000, ApJS 130, 237
- (42) Tully R.B., 1986, ApJ 303, 25
- (43) van den Bergh, 1999, Astron.Astrophys.Rev. 9, 273
- (44) van den Bergh, 2000, PASP 112, 529
- (45) White R.A., Bliton M., Bhavsar S.P., Bornmann P., Burns J.O., Ledlow M.J., Loken C., 1999, AJ 118, 2014
- (46) Willmer C.N.A., da Costa L.N., Pellegrini P.S., 1998, AJ 115, 869
- (47) Yahil A., Vidal N.V., 1977, ApJ 214, 347
- (48) Zabludoff A.I., 1999, in The Stellar Content of Local Group Galaxies, IAU Symp.192, eds. P.Whitelock & R.Cannon, p.433
- (49) Zabludoff A.I., Mulchaey J.S., 1998, ApJ 496, 39
- (50) Zabludoff A.I., Mulchaey J.S., 2000, ApJ 539, 136
- (51) Zucca E. et al., 1997, A&A 326, 477
Appendix A The discrepant redshift of Arp 127
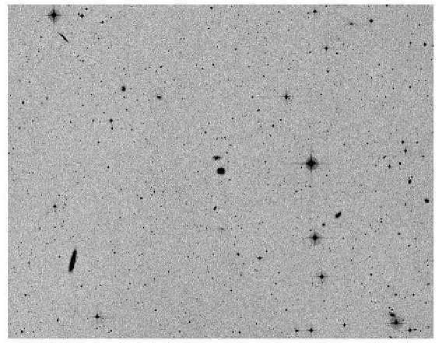
The Arp 127 pair (Arp 1966) is made by NGC0191, a spiral classified as SAB(rs)c: pec, and IC1563, an S0 pec sp. A third, more compact object is seen among the two galaxies (see 5). According to the literature, the redshifts of NGC0191 and IC1563 are respectively km/s and km/s (Huchra et al. 1993), a surprising difference given the apparent signs of interactions; for this reason IC1563 was not included in our final catalogue, even if according to the quoted redshift and the apparent magnitude () it should be considered a VLG.
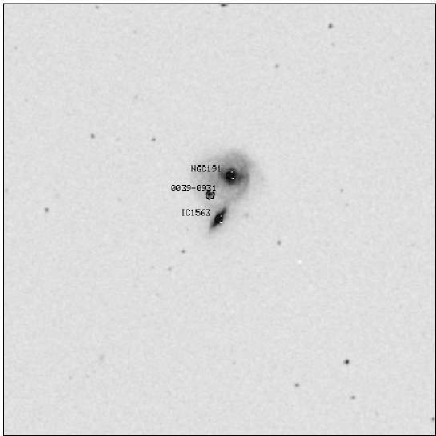
Our measurements for NGC0191 and IC1563 are reported in table A.1, and show that there is no discrepancy: the binary system Arp 127 is at km/s, and the two galaxies have a velocity difference of only km/s –, i.e. they have the same velocity taking into account the errors. These two galaxies are clearly interacting, as shown by the tidal distortion in NGC0191.
We suggest that the redshift of km/s should be attributed to the round object between the two galaxies. In fact Beers et al. (1991) report that value for the redshift giving the coordinates of the round object, but identify it as IC1563, while Huchra et al. (1993) give the approximate coordinates of the Arp 127 system for both NGC0191 and IC1563. The velocity of the round object is in the lower part of the velocity range of the A85 galaxy cluster (see Durret et al. 1998) and at an angular distance of 44 arcmin from its center, and it might be a galaxy member of the cluster.
The new redshift for IC1563 means that this galaxy has , i.e. it is a typical galaxy and not a VLG. In table 3 we report also the photometric observations of Reshetnikov & Combes (1996).
| Iden. | RA (2000) | DEC (2000) | (km/s) | Error | Notes | |
|---|---|---|---|---|---|---|
| NGC0191 | 00 38 59.3 | -09 00 09 | 6076 | 32 | 12.5 [13.68] | |
| IC01563 | 00 39 00.2 | -09 00 53 | 6138 | 39 | 14.74 [14.39] | |
| 0039-0931 | 00 39 02.0 | -09 00 31 | 13652 | 141 |
Appendix B 2dFGRS data
In the following tables we list the 2dFGRS galaxies which we have selected as members of VLG systems. We give in column (1) our identification number, in columns (2) and (3) respectively right ascension and declination, in column (4) the magnitude, and in column (5) the redshift.
We have listed the 2dFGRS data on the VLG when available, otherwise we have reported the SSRS2 data.
We could compare magnitudes and redshifts of the 2dFGRS and SSRS2 for 5 VLGs with 2dFGRS data (VLG014, VLG022, VLG043, VLG045, VLG048, VLG109): we find an average velocity difference km/s with an rms of km/s and an average magnitude difference , with an rms of 0.46. The magnitude difference is consistent with the zero–point shift expected between the blue magnitudes of the SSRS2 (Alonso et al. 1993, 1994; da Costa et al. 1994) and the APM magnitudes on which the 2dFGRS is based (Maddox et al. 1990a, 1990b, 1996). Note that for bright galaxies, magnitudes are not very precise: the APM magnitudes have a precision of 0.2 in the range but are significantly affected by saturation at magnitudes brighter than (Norberg et al. 2002).
Tables available at http://www.bo.astro.it/cappi/preprints.html