Evidence for Supernova Signatures in the Spectrum of the Late-time Bump of the Optical Afterglow of GRB 021211††thanks: Based on observations made with ESO telescopes under programmes 70.D-0412 and 270.D-5022.
We present photometric and spectroscopic observations of the gamma-ray burst GRB 021211 obtained during the late stages of its afterglow. The light curve shows a rebrightening occurring days after the GRB. The analysis of a VLT spectrum obtained during the bump (27 days after the GRB) reveals a suggestive resemblance with the spectrum of the prototypical type-Ic SN 1994I, obtained days past maximum light. Particularly we have measured a strong, broad absorption feature at 3770 Å, which we have identified with Ca II blueshifted by km/s, thus indicating that a supernova (SN) component is indeed powering the ‘bump’ in the afterglow decay. Assuming SN 1994I as a template, the spectroscopic and photometric data together indicate that the SN and GRB explosions were at most separated by a few days. Our results suggest that GRBs might be associated also to standard type-Ic supernovae.
Key Words.:
gamma rays: bursts – supernovae1 Introduction.
There is growing evidence that long-duration GRBs (i.e. those lasting more than s; e.g. Fishman et al. Fi94 (1994)) are associated with the death of massive stars. The most compelling case for the existence of a SN-GRB connection is represented by the spatial and temporal coincidence between GRB 980425 and SN 1998bw (Galama et al. Ga98 (1998)). Very recently, in the spectrum of the nearby () GRB 030329, Stanek et al. (St03 (2003)) found supernova features, emerging out of the afterglow spectrum and resembling those of SN 1998bw (Patat et al. Pa01 (2001)). Several other possible SN-GRB associations have been suggested (e.g. Wang & Wheeler WW98 (1998); Woosley et al. Wo98 (1998); Germany et al. Ge00 (2000); Terlevich et al. Te99 (1999); Rigon et al. Ri03 (2003)), although none really compelling due to the poor spatial and temporal coincidences.
The remaining evidence for the existence of a GRB-SN connection relies upon the detection of a rebrightening in the afterglow light curves, days after the GRB (e.g. Bloom et al. Bl99 (1999), Bl02 (2002); Lazzati et al. La01 (2001)). These ‘bumps’ have been interpreted as signatures of SNe at maximum, emerging out of the decaying afterglows. However this evidence and, consequently, the interpretation, are based only on a few photometric measurements in the afterglow light curves and on the assumption that the evolution of the underlying SN is similar to SN 1998bw, except for a luminosity rescaling factor (see e.g. Price et al. Pr03 (2003)). Alternative explanations, such as dust echoes (Esin & Blandford EB00 (2000)), thermal re-emission of the afterglow light (Waxman & Draine WD00 (2000)), or thermal radiation from a preexisting SN remnant (Dermer De03 (2003)) are not yet ruled out. Indirect evidence that at least some long-duration GRBs are associated with the death of massive stars is provided by the detection of star-formation features in the host galaxies (e.g. Djorgovski et al. Dj98 (1998)). Emission and absorption features observed in X-ray spectra (e.g. Piro et al. Pi00 (2000)) are also indicative of large amounts of metals in the GRB surroundings, which can be provided by SN explosions. Finally, the afterglow spectra of GRB 021004 showed absorption systems at different velocities, suggesting the presence of rapidly-moving pre-ejected material surrounding the explosion site (e.g. Møller et al. Mo03 (2003)).
2 GRB 021211.
GRB 021211 was detected on 2002 Dec 12 by the HETE–2 satellite at 11:18:34 UT (Crew et al. Cr02 (2002)). The -ray fluence was erg cm-2 in the ( keV band and erg cm-2 in the keV band (Crew et al. Cr03 (2003)). The GRB was therefore classified as X-ray rich. Given the redshift of this event (Vreeswijk et al. Vr02a (2002)), the inferred (isotropic) energy was erg, at the low end of the energy distribution of GRBs (Frail et al. Fr01 (2001)). Owing to the rapid distribution of coordinates, an optical afterglow was rapidly discovered by Fox & Price (FP02 (2002)), just 20 minutes after the GRB onset, as a pointlike source with magnitude at coordinates , (J2000; Fox et al. Fo03a (2003)). Moreover, the automatic telescopes RAPTOR (Wozniak et al. Wo02 (2002)), KAIT (Li et al. Li03 (2003)), and Super–LOTIS (Park et al. Pa02 (2002)), imaged the error box a few minutes after the GRB. These observations allowed to monitor the early lightcurve of the afterglow, which could be described by a broken powerlaw with a flattening at min (Li et al. Li03 (2003)). The striking feature of the optical afterglow of GRB 021211 was however its extreme faintness. Compared to other events at similar epochs and redshifts, this afterglow was dimmer by magnitudes in the -band (see e.g. Fox et al. Fo03a (2003)). This could in principle be due to heavy extinction within the host. However, Fox et al. (Fo03a (2003)) report a broad-band color (on Dec 11.6 UT), well within the range of GRB afterglows (Šimon et al. Si01 (2001)). This indicates that GRB 021211 suffered negligible extinction. Moreover, this burst was also underluminous in all observed wavebands: only upper limits were reported in the radio (Fox et al. Fo03a (2003); Rol & Strom RS02 (2002)), submillimeter (Fox et al. Fo03a (2003); Hoge et al. Ho02 (2002)), and TeV (McEnery ME02 (2002)) regions. Unfortunately, no follow-up X-ray observations were performed.
The intrinsic faintness of the optical afterglow made this event a good candidate for showing a prominent late-time bump.
3 Photometry.
| Start UT | Exp time | Seeing | magnitude |
|---|---|---|---|
| 2003 Jan 9.7∗ | 63 min | 1.1″ | |
| 2003 Jan 15.33 | 15 min | 0.8″ | |
| 2003 Feb 28.02 | 75 min | 0.8″ | |
| 2003 Mar 9.01 | 50 min | 1.25″ |
Late-time observations were secured at the ESO VLT–UT4 (Yepun) equipped with the FORS 2 instrument, in the band, during the period January – March 2003 (see Tab. 1).
The conversion to absolute flux was obtained by using both standard calibration and a secondary sequence calibrated, on Feb 28, with a Landolt standard field (SA98), to account for the observations obtained under non-photometric conditions. Aperture photometry was executed with the packages apphot and photcal within IRAF, by choosing aperture radii from 0.5″ to 3″, then correcting to infinity with the values found for the standards and using the DAOGROW algorithm. The measurements on the various apertures for the secondary calibrators were found very stable, and we decided to adopt for the target the innermost aperture magnitude, corrected for the aperture.
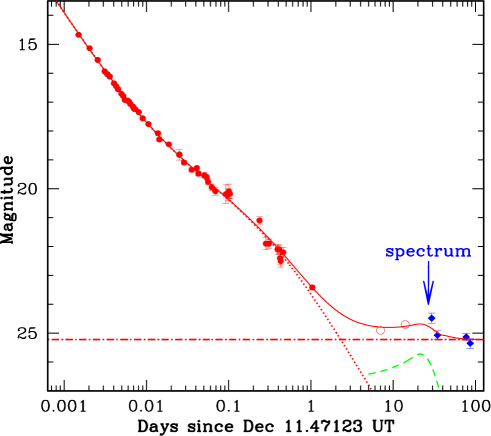
Our results are listed in Tab. 1 and supersede our preliminary report (Testa et al. Te03 (2003)). They have been complemented with a compilation of observations collected from literature and plotted in Fig. 1. A rebrightening is clearly seen, starting days after the burst (Fruchter et al. Fr02 (2002)) and reaching the maximum, , during the first week of January. The contribution of the host galaxy, estimated from our late-epoch images, is . Therefore, the intrinsic magnitude of the bump was .
The afterglow contribution is more uncertain. The early-time light curve presents several fluctuations, and cannot be easily extrapolated to later epochs. In particular, fitting all data up to 1 day after the GRB111We added in quadrature 0.03 mag to the errors of all points in order to account for the use of different telescopes and calibrations. with a (convex) broken powerlaw, as used by Li et al. (Li03 (2003)), yields an unacceptable . We suggest two possible alternatives. First, the shape of the lightcurve is consistent with the presence of two or three rebrightenings underlying a powerlaw component, similarly to what observed in GRB 021004 (Lazzati et al. La02 (2002); Nakar et al. Na03 (2003)). Alternatively, a second break in the light curve could be present about 10 hours after the GRB. This may be the consequence of the passage of the synchrotron cooling frequency across the optical band (the jet break is expected to occur much later for such a low energy event, according to the correlation of Frail et al. Fr01 (2001)). A fit with a double broken powerlaw (i.e. with two breaks, see Fig. 1) yields ; the improvement is highly significant (-test chance probability less than ). We note that, whichever extrapolation is used, the contribution of the afterglow to the flux measured at the epoch at which our spectrum (the arrow in Fig. 1) was obtained, is negligible (less then in the most conservative case). This fact strongly supports that the bump is powered by a different component other than the afterglow.
4 Spectral Analysis.
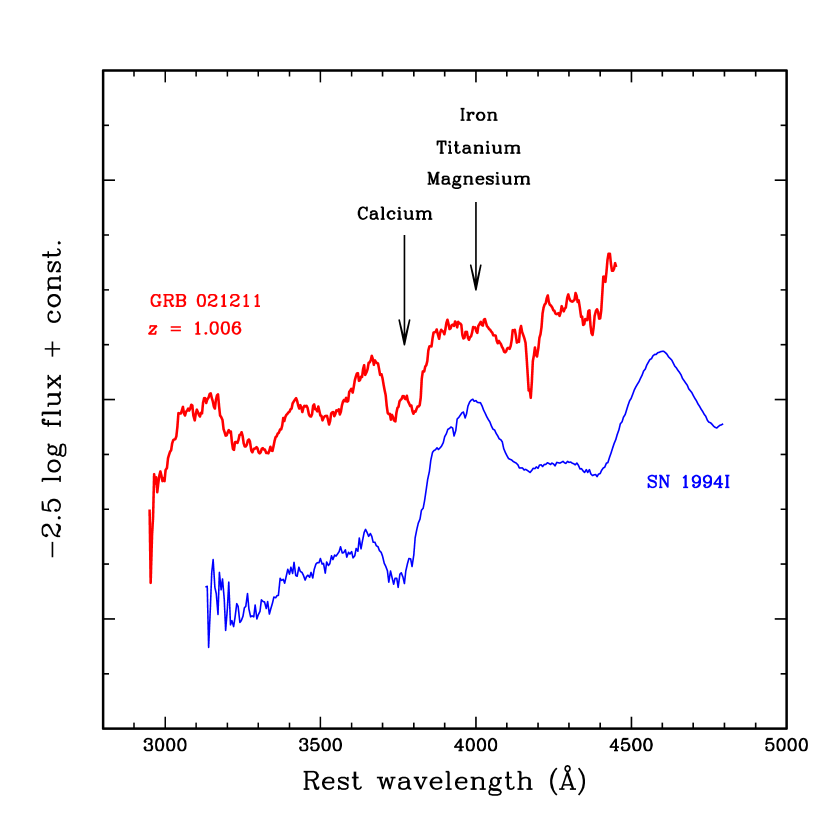
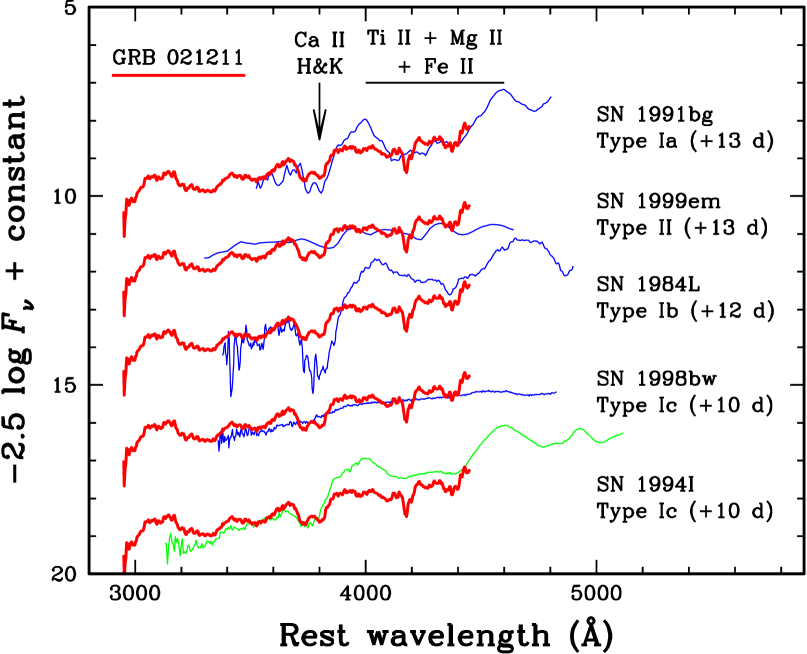
We obtained a spectrum of the afterglow + host with FORS 2, on Jan 8.27 UT (27 days after the GRB), during the rebrightening phase shown in Fig. 1. The original spectrum covered the range of wavelengths Å, although only the interval Å afforded an acceptable S/N (). The resolution was about 19 Å, and the integration time was h. The slit was rotated in such a way to include also the nearby galaxy reported by Caldwell et al. (Ca02 (2002)); this object was well detected and is clearly separated from our target (the seeing in the 4 exposures was ). The extraction of the spectrum was performed within the MIDAS and IRAF environments, independently by three of us (S.B., M.H., and M.D.V.). We clearly detected the emission line at 7472.9 Å already found by Vreeswijk et al. (Vr02a (2002)). Interpreting this as [O II] 3727 Å in the rest frame of the host galaxy, this corresponds to a redshift . Following this idea, we could also detect, albeit at lower significance, emission lines at 9720 Å, 9955 Å, and 10025 Å, which we intepret as H and [O III] 4959 Å and 5007 Å. Our spectrum, shown in the rest-frame of the GRB (thick lines in Fig. 2 and Fig. 4) was smoothed with a boxcar filter (55 Å width) and cleaned from the emission line [O II]. The spectrum of the afterglow is characterized by broad low-amplitude undulations blueward and redward of a broad absorption, the minimum of which is measured at Å (in the rest frame of the GRB), whereas its blue wing extends up to Å. We then compared our spectrum with those of SNe arranged in different spectroscopic types and obtained at different epochs (Fig. 2, thin lines). The comparison includes the type-Ia SN 1991bg (Filippenko et al. Fi92 (1992); Turatto et al. Tu96 (1996)), the type-II SN 1999em (Hamuy et al. Ha01 (2001)), the type-Ib SN 1984L (Harkness et al. Ha87 (1987)), the peculiar type-Ic SN 1998bw (Galama et al. Ga98 (1998); Patat et al. Pa01 (2001)), and the type-Ic SN 1994I (Filippenko et al. Fi95 (1995)). Both SN 1999em and SN 1998bw provide a poor match to the afterglow spectrum. Some similarity can be found with the type-Ia SN 1991bg and the type-Ib SN 1984L. A more convincing resemblance is found with the spectrum of the type-Ic SN 1994I, obtained 9 days after its -band maximum (Filippenko et al. Fi95 (1995)). The comparison with SN 1994I (and to some extent also with SN 1991bg and SN 1984L) strongly supports the identification of the broad absorption with Ca II H+K; the blueshifts corresponding to the minimum of the absorption and to the edge of the blue wing imply velocities of km/s and km/s respectively. In principle the Ca II from the host galaxy could contaminate our spectrum. However, since the typical FWHM of absorption (and emission) lines of galaxies is of the order of Å (corresponding to less than km/s), and the FWHM of the observed absorption is about 150 Å, one concludes that the Ca II of the host galaxy might affect the observed feature only marginally, if at all.
5 Measurements of the Time Delay between the SN and the GRB.
Using SN 1994I as a template, our photometric and spectroscopic data allow us to estimate the time at which the SN exploded, and to compare it with the GRB onset time.
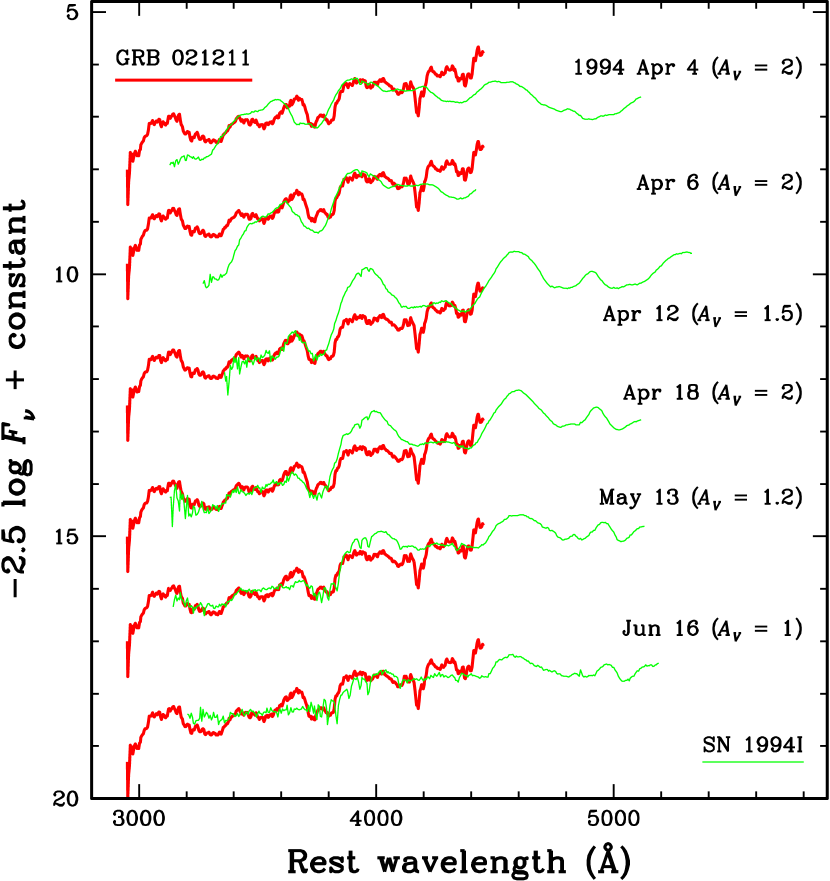
Spectroscopy. In order to further study the spectrum of the SN associated with the bump, we have used as a reference (see Fig. 3) the spectral evolution of SN 1994I (Filippenko et al. Fi95 (1995)). To find the best match, different reddenings in the range (Richmond et al. Ri96 (1996)) were applied to each spectrum. The epochs before maximum light (April 9) seem to be excluded by the morphology of Ca feature, which is broader and located at shorter wavelengths than in the GRB (the correctness of the wavelenght axis was checked by measuring the position of the NaD interstellar absorption in each spectrum). Spectra later than Jun 1 show a very weak Ca feature and exhibit a poor match with the afterglow spectrum in the () Å region. Therefore the match with the spectra is acceptable over the range Apr 9 to May 31 (0 to 40 days after SN maximum light).
Since our spectrum was obtained on Jan 8, we estimate that the maximum of the SN should have occurred between 2002 Oct 2 and 2003 Jan 8 (since the source was at ). The exact epoch when the SN exploded depends crucially on the rise time (the time interval from the epoch of the explosion up to maximum light) of type-Ic SNe. The best documented cases are SN 1998bw and SN 1999ex. The latter (Stritzinger et al. St02 (2002)) reached -band maximum days after the explosion, the former after days (Galama et al. Ga98 (1998)). SN 1994I had a faster rise, reaching its maximum (in ) only 12 days after the explosion (Iwamoto et al. Iw94 (1994)). Adopting the latter value, we conclude that the SN exploded between Sept 11 and Dec 15, the later epochs being favored.
Photometry. In Fig. 1 we have superimposed to the light curve of the afterglow decay the light curve of SN 1994I (Lee et al. Le95 (1995)), reported222Assuming , , km s-1 Mpc-1, the distance modulus at is mag. at and dereddened by mag (Richmond et al. Ri96 (1996)). The -correction has been computed from -band data, considering that, at , the -band roughly corresponds to the observed -band. The plot (solid line) shows that the luminosity at maximum of SN 1994I ( assuming ; see Tab. 10 of Richmond et al. Ri96 (1996)) agrees very well with that of the bump (). In the figure, a null time delay between the GRB and the SN explosion was used. Letting this delay free to vary did not significantly improve the fit (-test chance probability of ); the best fit time delay is comoving days.
Evidently the photometric observations provide a tighter constraint on the SN-GRB delay. However the uncertainties above are only statistical, while systematics are more difficult to evaluate, especially in consideration of the paucity of observation of type-Ic SNe in their rising phase. Yet, the combination of our photometric and spectroscopic data provide evidence that the SN and the GRB explosions occurred within days from one another, at the most.
6 Conclusions.
The detection of a broad (FWHM Å) absorption feature, in the spectrum of the ‘bump’, which we have identified with the Ca II H+K doublet (blueshifted by km/s) suggests that the rebrightening of the GRB 021211 afterglow was powered by a SN. Assuming for this SN a spectroscopic and photometric behavior similar to that of SN 1994I, our data indicate that the SN and GRB explosion may have occurred almost simultaneuosly, or at most separated by a few days. The temporal coincidence between the SN and GRB 021211 holds for ‘short’ rise times, of the order of days (as observed for SN 1994I; Iwamoto et al. Iw94 (1994)). On the other hand, if a longer rise time ( days, such as that observed in SN 1998bw or SN 1999ex) were used, the conclusion would be that the SN went off several days before GRB 021211.
It is interesting to note that SN 1994I, the spectrum of which provides the best match to that observed in GRB 021211, is a typical type-Ic event rather than an exceptional 1998bw-like object, as the one proposed for association with GRB 980425 and GRB 030329 (Galama et al. Ga98 (1998); Stanek et al. St03 (2003)). If the SN associated with GRB 021211 indeed shared the properties of SN 1994I, this would open the interesting possibility that GRBs may be associated with standard type-Ic SNe, and not only with the more powerful events known as ‘hypernovae’. This fact may have interesting consequences on the rate of GRB events. One caveat is that the recently studied SN 2002ap (Mazzali et al. Ma02 (2002)) shared some of the properties of hypernovae (e.g. a high expansion velocity), but was not significantly brighter than standard type-Ic SNe. Even if its pre-maximum spectra showed significantly broader lines than our case, this difference vanished after maximum, such that it may not be easy to distinguish between the two types of SNe. However, SN 2002ap had a broader light curve, and it was too faint in the -band (Yoshii et al. Yo03 (2003)). It remains however not firmly estabilished whether GRB 021211 was associated with a standard type-Ic SN or with a ‘low energy’ hypernova similar to SN 2002ap. We last note that even if GRBs are indeed mainly associated with standard type-Ic SNe, the discovery of overluminous type-Ic events (like SN 1998bw) associated with GRBs is observationally favored, since the SN component can emerge and be observed at early times, when the transient is more frequently monitored.
Acknowledgements.
We thank Alexei Filippenko and Nando Patat for giving us the spectra of SN 1994I and SN 1998bw respectively, and the ESO directorate for accepting our DDT proposal. Mario Vietri, Peter Höflich and Lucia Ballo are acknowledged for useful discussion. We also thank the anonymous referee for her/his comments, which have improved the presentation of the data. We also appreciate the work of the observing staff at Paranal. We thank the Italian Collaboration for Optical Bursts (CIBO) for showing us preliminary photometric data.References
- (1) Bloom J.S., Kulkarni S.R., Djorgovski S.G., et al. 1999, Nature, 401, 453
- (2) Bloom J.S., Kulkarni S.R., Price P.A., et al. 2002, ApJ, 572, L45
- (3) Caldwell N., McLeod B., Garnavich P., & Stanek K.Z. 2002, GCN Circ 1759
- (4) Cardelli J.A., Clayton G.C., & Mathis J.S. 1989, ApJ, 345, 245
- (5) Crew G.B., Villasenor J., Vanderspek R., et al. 2002, GCN Circ 1734
- (6) Crew G.B., Lamb D.Q., Ricker G.R., et al. 2003, ApJ, submitted (astro-ph/0303470)
- (7) Dermer C.D. 2003, ApJL, submitted (astro-ph/0211300)
- (8) Djorgovski S.G., Kulkarni S.R., Bloom J.S., et al. 1998, ApJ, 508, L17
- (9) Esin A., & Blandford R. 2000, ApJ, 534, L151
- (10) Filippenko, A.V., Richmond M.W., Branch D., et al. 1992, AJ, 104, 1543
- (11) Filippenko A.V., Barth A.J., Matheson J., et al. 1995, ApJ, 450, L11
- (12) Fishman G.J., Meegan C.A., Wilson R.B., et al. 1994, ApJS, 92, 229
- (13) Fox D.W., & Price P.A. 2002, GCN Circ 1731
- (14) Fox D.W., Price P.A., Soderberg A.M., et al. 2003, ApJ, 586, L5
- (15) Frail D.A., Kulkarni S.R., Sari R., et al. 2001, ApJ, 562, L55
- (16) Fruchter A.S., Levan A., Vreeswijk P.M., Holland S.T., & Kouveliotou C. 2002, GCN Circ 1781
- (17) Galama T.J., Vreeswijk P.M., van Paradijs J., et al. 1998, Nature, 395, 670
- (18) Germany L.M., Reiss D.J., Sadler E.M., Schmidt B.P., & Stubbs C.W. 2000, ApJ, 533, 320
- (19) Hamuy M., Pinto P.A., Maza J., et al. 2001, ApJ, 558, 615
- (20) Hamuy M. 2003, review for “Core Collapse of Massive Stars” (Eds. Fryer, Kluwer, Dordrecht); astro-ph/0301006
- (21) Harkness R.P., Wheeler J.C., Margon B., et al. 1987, ApJ, 317, 355
- (22) Hoge J., Willott C., Grimes J., Tilanus R., & Moriarty–Schieven G. 2002, GCN Circ 1742
- (23) Iwamoto K., Nomoto K., Höflich P., et al. 1994, ApJ, 437, L115
- (24) Lazzati D., Covino S., Ghisellini G., et al. 2001, A&A, 378, 996
- (25) Lazzati D., Rossi E., Covino S., Ghisellini G., & Malesani D. 2002, A&A, 396, L5
- (26) Lee M.G., Kim E., Kim S.C., et al. 1995, Journ. Korean Astr. Soc., 28, 31
- (27) Li W., Filippenko A.V., Chornock R., & Jha S. 2003, ApJ, 586, L9
- (28) Mazzali P.A., Deng J., Maeda K., et al. 2002, ApJ, 572, 61
- (29) McEnery E. 2002, GCN Circ 1740
- (30) Møller P., Fynbo J.U., Hjorth J., et al. 2003, A&A, 396, L21
- (31) Nakar E., Piran T., & Granot J. 2003, New Astr., 8, 495
- (32) Park H.S., Williams G., & Barthelmy S. 2002, GCN Circ 1736
- (33) Patat F., Cappellaro E., Danziger J., et al. 2001, ApJ, 555, 900
- (34) Piro L., Garmire G., Garcia M., et al. 2000, Science, 290, 955
- (35) Pandey S.B., Anupama G.C., Sagar R., et al. 2003, A&A, submitted (astro-ph/0304481)
- (36) Price P.A., Kulkarni S.R., Berger E., et al. 2003, ApJ, 589, 838
- (37) Richmond M.W., Van Dyk S.D., Ho W., et al. 1996, AJ, 111, 327
- (38) Rigon L., Turatto M., Benetti S., et al. 2003, MNRAS, 340, 191
- (39) Rol E., & Strom R. 2002, GCN Circ 1777
- (40) Šimon V., Hudec R., Pizzichini G., & Masetti N. 2001, A&A, 377, 450
- (41) Stanek K.Z., Matheson T., Garnavich P.M., et al. 2003, ApJL, in press (astro-ph/030473)
- (42) Stritzinger M., Hamuy M., Suntzeff N.B. et al. 2002, AJ, 124, 2100
- (43) Terlevich R., Fabian A., & Turatto M. 1999, IAU Circ 7269
- (44) Testa V., Fugazza D., Della Valle M., et al. 2003, GCN Circ 1821
- (45) Turatto M., Benetti S., Cappellaro E., et al. 1996, MNRAS, 283, 1
- (46) Vreeswijk P.M., Fruchter A., Hjorth J., & Kouveliotou C. 2002a, GCN Circ 1785
- (47) Wang L., & Wheeler J.C. 1998, ApJ, 504, L87
- (48) Waxman E., & Draine B.T. 2000, ApJ, 537, 796
- (49) Woosley S.E., Eastman R.G., & Schmidt B.P. 1998, ApJ, 516, 788
- (50) Wozniak P., Vestrand W.T., Starr D., et al. 2002, GCN Circ 1757
- (51) Yoshii Y., Tomita H., Kobayashi Y., et al. 2003, ApJ, in press (astro-ph/0304010)