The Hi environment of the Sculptor dwarf spheroidal galaxy
Abstract
New observations of the neutral hydrogen (Hi) in and around the line of sight of the Sculptor dwarf spheroidal (dSph) are presented. The data obtained with the single-dish Parkes telescope cover a large area of in the direction of the dwarf, and have resolutions of km s-1. The Australia Telescope Compact Array was used to map a smaller area of centered on the direction of the dwarf with higher resolutions ( km s-1). Many Hi structures having velocities outside the range of the normal Galactic disk velocities were detected, including the two Sculptor clouds (northeast and southwest) of Carignan et al. (1998, C98). The present study shows the total extent of the C98 clouds. We derived heliocentric radial velocities for the NE and SW clouds of km s-1 and km s-1, respectively. The intensity-weighted mean Hi velocity for both clouds is km s-1.
Three different hypotheses concerning the association of the C98 Sculptor clouds were considered. The case for the clouds belonging to the Sculptor group of galaxies is found to be inconsistent with the observational data. The probability of the C98 Sculptor clouds to be Milky Way features at anomalous velocities (HVCs) superimposed by chance on the Sculptor dSph is estimated to be less than 2%. The third hypothesis assumes that the clouds are physically associated with the Sculptor dSph, and is supported by the following evidences: (a) the radial velocities for both clouds are very close to the optical velocity of the Sculptor dSph ( km s-1). (b) 88% of the total Hi flux is contained within the optical radius of the galaxy, and (c) the clouds are located symmetrically relative to the center of the Sculptor dSph. Arguments are presented that the C98 Sculptor clouds are still gravitationally bound to the dwarf galaxy, and are part of its interstellar medium. The mass of each cloud is M⊙ (NE cloud) and M⊙ (SW cloud) at the Sculptor dSph distance (79 kpc).
1 Introduction
Dwarf galaxies are the most numerous type of galaxies in the Universe. Recently, the interest for the lowest luminosity dwarfs has been renewed, both on the observational and on the theoretical sides, in part because these stellar systems have the spatial scale at which the predictions of the presently favored CDM cosmology have the largest discrepancies with observations. Most notably, CDM simulations overpredict the number of low mass galaxies in the Milky Way and M31 halos (Moore et al., 1999). Another difficulty is the cuspy density profile of simulated halos, which is at odds with the almost flat cores observed in the inner few kiloparsecs of disk galaxies (de Blok et al., 2001; Blais-Ouellette et al., 2001).
Low luminosity dwarfs in the Local Group are classified as dwarf irregulars (dIrr), dwarf spheroidals (dSph), or intermediate type dwarfs (dIrr/dSph) (Mateo, 1998). dIrr galaxies are gas rich and the Hi is often seen in rings surrounding the optical center (Carignan, 1998; Young & Lo, 1997) or bubble like structures (LeoA, Young & Lo 1996) and their complex Star Formation History (SFH) can easily be explained. For dSph galaxies, the data are harder to explain. The ISM is required to support the complex SFH (Grebel, 1998) of these objects and until now, very few of them are actualy known to contain Hi . This is what led Blitz & Robishaw (2000) to believe “that all of the LG dwarf galaxies have had loosely bound Hi envelopes” thus implicitly making a link between High Velocity Clouds, dSph, and dIrr.
In the Local Group, all dwarf galaxies less luminous than M and located within 250 kpc from a giant spiral (Milky Way or M31) are dSphs. All dIrr galaxies in the same luminosity range are isolated systems. This segregation of the dwarfs into dSphs and dIrrs according to their distance from giant spirals suggests that some (or many) environmental factors are at work. The most popular mechanisms discussed in the literature are total removal of the ISM by either tidal or ram pressure stripping (e.g. Blitz & Robishaw, 2000). However, the total ISM removal cannot explain the puzzling situation with many dSphs, which have formed stars in the last 1-2 Gyrs, but have no Hi gas around them which could have fueled the star formation.
Mashchenko, Carignan, & Bouchard (2003, hereafter MCB) proposed a possible solution for this puzzle. They showed that far ultraviolet (FUV) flux from spirals like the Milky Way and M31 can be strong enough to keep the ISM of satellite dSphs in a fully photoionized state for prolonged periods of time, and by assuming that many dSphs are massive enough (with the virial temperature K) to keep the photoionized gas gravitationally bound. Only during relatively short intervals of time, when the dSph moving along its orbit around the host galaxy is crossing the shadow produced by the Hi disk of the host, can the ISM recombine and potentially form stars.
Any evidence for a physical association of Hi gas with a low luminosity dSph galaxy would be crucial for understanding the factors governing the evolution of these systems. One of the most promising objects in this regard is the Sculptor dSph. Carignan et al. (1998, hereafter C98) detected two Hi clouds in the vicinity of the dwarf, with radial velocities very similar to the optical velocity of the Sculptor dSph. Their observations of a field covered only a small portion of the stellar body of the dwarf which has a major axis of (Irwin & Hatzidimitriou, 1995). This prevented the authors from giving a conclusive evidence for a physical association of the gas with the Sculptor dSph. New Hi observations with a much larger spatial coverage were required to see the full extent of the clouds, and to make sure that these clouds were not Galactic HVCs.
Here we present new observations made with the Australia Telescope Compact Array (ATCA) and the Parkes single-dish telescope covering large areas around the Sculptor dwarf – for Parkes and for the ATCA. We analyze all Hi structures detected in this area, and argue that the new data strengthen the case for the physical association of the two C98 clouds with the dSph while the others are most likely unrelated to the Sculptor dSph. By combining our new Hi data with the data of Weiner, Vogel, & Williams (2001) on Hα emission from the Sculptor clouds, we also give evidence in support of the radiation harassment scenario of MCB.
2 Observations of Hi in the direction of the Sculptor dSph
2.1 Previous observations
| Parameter | Value |
|---|---|
| RA (J2000) | |
| DEC (J2000) | |
| Galactic longitude, l | |
| Galactic latitude, b | |
| Heliocentric distanceaaMateo 1998 | kpc |
| Isophotal major axisbbde Vaucouleurs et al. 1991, | |
| Core radiusccIrwin & Hatzidimitriou 1995, | |
| Tidal radiusccIrwin & Hatzidimitriou 1995, | |
| Major-axis position angleccIrwin & Hatzidimitriou 1995 | |
| Optical radial velocityaaMateo 1998, V | km s-1 |
| Proper motion velocityddSchweitzer et al. 1995, Vprop | km s-1 |
| Proper motion position angleddSchweitzer et al. 1995 |
C98 made two sets of observations. First, they used the Parkes single dish radio-telescope and pointed it directly at the center of the galaxy. They used the source PKS1934-638 as a flux calibrator and they had a velocity resolution of 1.65 km s-1. Their 100 minutes integration on source resulted in a detection limit of 100 M⊙. The spectrum they obtained revealed M⊙ of Hi, at a velocity of V⊙ = 112 km s-1. But the 15′ beam did not cover all the optical extent of the Sculptor dSph (which has a tidal radius of , see Table 1) and it was not large enough to get a complete sampling of what is believed to be the gas associated with the dwarf.
Their second set of observations was obtained with the ATCA using the array configuration 210 which resulted in a spatial resolution of 240″ and a velocity resolution of 1.65 km s-1. This yielded an Hi mass of 3.0 M⊙, at a velocity of km s-1. But inevitable short spacing effects appeared in the data which made the authors believe that they missed a non-negligible fraction of the Hi . Moreover a large fraction of the detected Hi lied close to the half-power beam width (FWHM).
2.2 New Parkes data
The 64 m Parkes radio-telescope was used, equipped with a 21 cm multibeam receiver in a narrowband mode. The total bandwidth of 8 MHz was divided in 2048 channels, resulting in a velocity increment of 0.82 km s-1 between each channel of the cube for a total velocity coverage of 1600 km s-1 centered on V⊙ = -200 km s-1. A region of was mapped around the Sculptor dSph at a beam resolution of and a velocity resolution of 1.12 km s-1, using frequency switching observations.
The reduction pipeline provided with the AIPS++ package was used to calibrate the data (task ”Livedata”) and to grid and form the cube (task ”Gridzilla”). Both tasks are part of the standard HIPASS data acquisition system (Barnes et al., 2001). For the bandpass calibration, the data were Hanning smoothed and the median value of the baseline was subtracted.
2.3 New ATCA data
The ATCA is located in Narrabri, Australia. It consists of six 22 meters antennae on an East-West track. This aperture synthesis array was used in the 0.210 configuration, with baselines ranging from 31 to 214 meters, giving the maximum possible weight to large structures.
The data cube is a 64 pointing mosaic centered on a frequency of 1420 MHz. The array configuration, along with a total bandpass of 8 MHz divided in 1024 channels resulted in physical resolutions of km s-1. The source PKS1934-638 was used as a flux calibrator while PKS0008-421 was the phase calibrator. The Miriad package was used to edit and calibrate the data.
2.4 Data Analysis
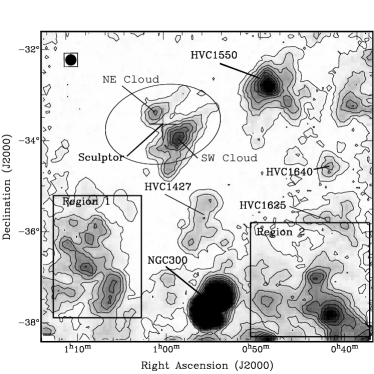
Figure 1 shows a wide field image taken with the Parkes radiotelecope equiped with the narrowband multibeam receiver. The region in the direction of the Sculptor dSph is heavily populated with Hi features. Aside from the Sculptor (NE and SW) clouds, only one Hi structure from Figure 1 has been previously associated with an optical object — the spiral galaxy NGC 300 from the Sculptor group. Many other features are catalogued as HVCs by Putman et al. (2002). The radial velocities for each feature marked in Figure 1 are listed in Table 2.
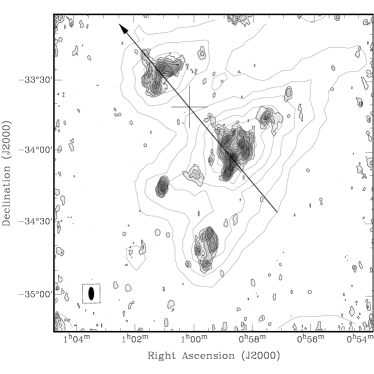
This study will concentrate on the two Hi features closest to the optical center of the Sculptor dSph — the NE and SW clouds (see Figure 1). A close-up view of the Sculptor clouds is shown in Figure 2. This is a higher spatial resolution image taken with the ATCA interferometer. The integrated spectra for the clouds are shown in Figure 3. The velocity information extracted from the spectra is summarized in Table 5. The table also contains Hi mass estimates, based on the assumption that the clouds are located at the distance of the Sculptor dSph (79 kpc, see Table 1).

| V⊙ | ||
|---|---|---|
| (km s-1) | (km s-1) | |
| NE cloud (HVC 1321) | 100 | 6.0 |
| SW cloud (HVC 1353) | 105 | 9.9 |
| NGC 300 | 145 | 37.6 |
| HVC 1427 | 135 | 7.9 |
| HVC 1550 | 117 | 11.0 |
| HVC 1625 | 169 | 21.5 |
| HVC 1640 | 175 | 13.4 |
| Region 1 (broad region) | 121 | 9.0 |
| Region 1 (artifact) | 121 | 21.0 |
| Region 2 | 40 | 4.4 |
| Catalog | RA | DEC | VLSR | ||
|---|---|---|---|---|---|
| designation | (J2000) | (J2000) | (km s-1) | (km s-1) | |
| HVC 1520 | 0h 50.3m | -34 4.0′ | 2.08 | 140 | 39 |
| HVC 1427 | 0h 56.1m | -35 53.0′ | 2.33 | 126 | 25 |
| HVC 1550 | 0h 48.8m | -32 59.0′ | 2.48 | 113 | 12 |
| HVC 1634 | 0h 46.8m | -31 20.0′ | 3.68 | 138 | 37 |
| HVC 1640 | 0h 42.4m | -34 40.0′ | 3.79 | 160 | 59 |
| HVC 1547 | 0h 47.2m | -37 11.0′ | 4.36 | 141 | 40 |
| HVC 1625 | 0h 42.0m | -36 4.0′ | 4.41 | 160 | 59 |
| HVC 1540 | 0h 47.3m | -38 20.0′ | 5.30 | 164 | 63 |
| HVC 1462 | 0h 55.7m | -39 22.0′ | 5.73 | 144 | 43 |
| HVC 1723 | 0h 31.7m | -36 29.0′ | 6.45 | 202 | 101 |
| HVC 912 | 1h 31.3m | -34 53.0′ | 6.54 | 107 | 6 |
| HVC 1791 | 0h 26.6m | -35 52.0′ | 7.22 | 146 | 45 |
| :HVC 1569 | 0h 43.1m | -40 8.0′ | 7.27 | 186 | 85 |
| :HVC 1616 | 0h 38.6m | -39 45.0′ | 7.42 | 158 | 57 |
| HVC 1908 | 0h 23.0m | -32 49.0′ | 7.82 | 129 | 28 |
| HVC 1825 | 0h 22.0m | -35 40.0′ | 8.08 | 171 | 70 |
| HVC 1901 | 0h 20.5m | -33 37.0′ | 8.25 | 198 | 97 |
| HVC 3 | 0h 21.9m | -30 58.0′ | 8.53 | 109 | 8 |
| HVC 732 | 1h 42.4m | -32 22.0′ | 8.95 | 111 | 10 |
| HVC 1932 | 0h 15.7m | -33 7.0′ | 9.29 | 146 | 45 |
| HVC 1280 | 1h 20.4m | -42 7.0′ | 9.30 | 148 | 47 |
| :HVC 1614 | 0h 36.6m | -42 4.0′ | 9.56 | 145 | 44 |
| HVC 1922 | 0h 13.6m | -33 53.0′ | 9.67 | 162 | 61 |
| :HVC 1651 | 0h 30.6m | -41 38.0′ | 9.84 | 171 | 70 |
| CHVC 1104 | 1h 35.5m | -40 38.0′ | 9.86 | 120 | 19 |
| HVC 1031 | 1h 41.0m | -39 23.0′ | 9.96 | 101 | 0 |
| Catalog | RA | DEC | VLSR | ||
|---|---|---|---|---|---|
| designation | (J2000) | (J2000) | (km s-1) | (km s-1) | |
| HVC 1247 | 1h 4.4m | -33 52.0′ | 0.90 | -212 | 312 |
| HVC 1292 | 1h 0.7m | -32 47.0′ | 0.93 | -180 | 280 |
| CHVC 1387 | 0h 58.0m | -35 1.0′ | 1.38 | -243 | 343 |
| HVC 1175 | 1h 5.4m | -32 52.0′ | 1.38 | -140 | 240 |
| HVC 1461 | 0h 53.8m | -34 31.0′ | 1.54 | -167 | 267 |
| HVC 1192 | 1h 0.3m | -31 2.0′ | 2.68 | -182 | 282 |
| HVC 1385 | 0h 54.9m | -31 15.0′ | 2.70 | -191 | 291 |
| HVC 1538 | 0h 49.8m | -31 54.0′ | 2.83 | -170 | 270 |
| :HVC 1411 | 0h 57.9m | -36 57.0′ | 3.27 | -205 | 305 |
| HVC 1624 | 0h 44.4m | -33 56.0′ | 3.28 | -199 | 299 |
| HVC 1644 | 0h 45.5m | -32 8.0′ | 3.46 | -137 | 237 |
| HVC 1567 | 0h 49.3m | -30 50.0′ | 3.68 | -191 | 291 |
| HVC 1251 | 0h 56.8m | -30 4.0′ | 3.71 | -143 | 243 |
| HVC 1719 | 0h 42.4m | -31 43.0′ | 4.23 | -152 | 252 |
| HVC 1021 | 1h 21.4m | -34 54.0′ | 4.55 | -88 | 188 |
| HVC 1706 | 0h 37.4m | -34 45.0′ | 4.82 | -166 | 266 |
| HVC 1532 | 0h 51.0m | -28 42.0′ | 5.38 | -202 | 302 |
| HVC 854 | 1h 28.6m | -33 23.0′ | 5.93 | -121 | 221 |
| HVC 892 | 0h 54.2m | -27 43.0′ | 6.13 | -212 | 312 |
| HVC 707 | 1h 23.6m | -30 0.0′ | 6.21 | -164 | 264 |
| HVC 1818 | 0h 30.0m | -33 43.0′ | 6.27 | -172 | 272 |
| HVC 615 | 0h 59.6m | -27 22.0′ | 6.34 | -256 | 356 |
| CHVC 1664 | 0h 35.7m | -37 52.0′ | 6.47 | 215 | 114 |
| HVC 1903 | 0h 31.0m | -31 31.0′ | 6.52 | -192 | 292 |
| :HVC 879 | 1h 32.2m | -34 23.0′ | 6.67 | -155 | 255 |
| HVC 941 | 1h 32.3m | -35 34.0′ | 6.87 | -83 | 183 |
| HVC 1499 | 0h 51.2m | -40 31.0′ | 7.04 | -110 | 210 |
| CHVC 630 | 1h 20.7m | -28 12.0′ | 7.05 | -197 | 297 |
| HVC 764 | 1h 33.4m | -32 22.0′ | 7.09 | -96 | 196 |
| HVC 698 | 1h 30.0m | -30 11.0′ | 7.24 | -93 | 193 |
| HVC 588 | 1h 1.9m | -26 28.0′ | 7.25 | -268 | 368 |
| HVC 673 | 1h 28.4m | -29 28.0′ | 7.36 | -118 | 218 |
| HVC 1777 | 0h 26.4m | -36 27.0′ | 7.43 | 255 | 154 |
| CHVC 542 | 0h 54.1m | -25 59.0′ | 7.84 | -240 | 340 |
| HVC 1753 | 0h 25.9m | -37 31.0′ | 7.93 | -130 | 230 |
| HVC 219 | 0h 36.2m | -27 40.0′ | 7.94 | -168 | 268 |
| HVC 827 | 1h 41.8m | -34 32.0′ | 8.65 | -97 | 197 |
| HVC 1592 | 0h 39.2m | -41 37.0′ | 8.92 | -100 | 200 |
| HVC 1794 | 0h 20.1m | -37 38.0′ | 9.03 | -131 | 231 |
| CHVC 1079 | 1h 35.5m | -39 36.0′ | 9.21 | -112 | 212 |
| HVC 432 | 0h 38.2m | -25 42.0′ | 9.32 | -140 | 240 |
| HVC 1852 | 0h 15.6m | -36 5.0′ | 9.43 | -124 | 224 |
| HVC 1556 | 0h 42.6m | -42 36.0′ | 9.53 | -98 | 198 |
| HVC 1483 | 0h 53.6m | -43 22.0′ | 9.74 | 226 | 125 |
| HVC 1641 | 0h 32.0m | -41 56.0′ | 9.92 | -94 | 194 |
| Parkes | ATCA | |||
|---|---|---|---|---|
| Velocity | Hi mass | Velocity | Hi mass | |
| (km s-1) | (104M⊙ [D/79 kpc]2) | (km s-1) | (104M⊙ [D/79 kpc]2) | |
| North East | 100.20.9 | 4.070.18 | 99.71.7 | 2.840.23 |
| South West | 105.10.3 | 19.330.24 | 110.21.6 | 8.670.68 |
| Central | 106.30.7 | 0.610.02 | (-1.130.27)aaSee text for details | |
| Total | 104.10.4 | 23.350.32 | 109.32.0 | 8.680.83 |
Parts of the Sculptor clouds were observed by C98. In our present study, we can see the full extent of the clouds. They have larger sizes and masses (Table 5) than those reported by C98, but appear to be almost completely contained within the optical extent of the Sculptor dSph (88% of the total flux). The existence of the third (central) cloud of C98 with low detection significance is not confirmed with our new data, which is evident from the spectrum of the central area shown in Figure 3d and the corresponding parameters given in Table 5. This central region has a slightly negative integral flux (resulted in a negative mass in Table 5). This is caused by an imperfect continuum subtraction performed on the image. The signal does not significantly come out of the noise (Figure 3d).
The lack of short spacings in the ATCA data is most obvious in panels b) and c) of Figure 3. The 210 configuration of the array used for the observations is not sensitive to scales larger than , resulting in the mass of the SW cloud being significantly underestimated (Table 5). The NE cloud with a size has less suffered from this effect.
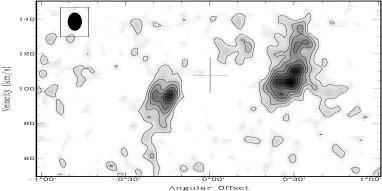
Figure 4 shows a slice along the velocity axis through both the ATCA and the Parkes data sets. The slice passes through the center of the Sculptor dSph along the proper motion direction (arrow in Figure 2). We clearly see the NE cloud (on the left side) and the SW cloud (on the right side). The cross marks the position of the galactic center and the velocity of the dwarf. It is clear from this figure that both clouds are distributed symmetrically relative to the dwarf’s center and have similar velocities, though the velocity of the NE cloud tends to be slightly less than that of the SW cloud.
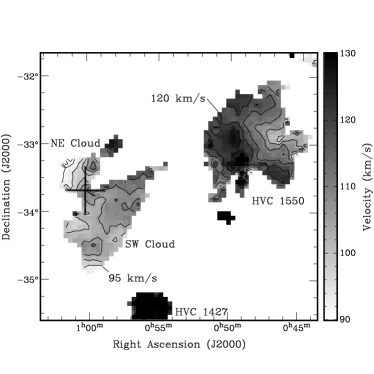
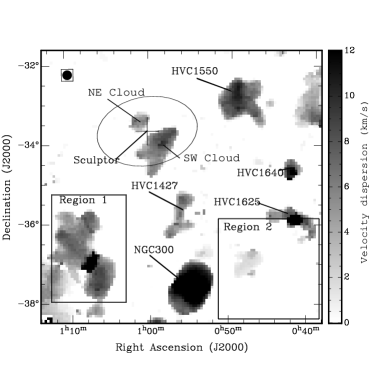
Velocity information can also be found in Figure 5. This velocity map from the Parkes data shows the two main Sculptor clouds and a third one (HVC 1550) close to the dwarf. Figure 6 shows the dispersion of the Hi gas of the Sculptor dSph surroundings. The maximum dispersion values of every feature identified in Figure 1 are listed in Table 2.
3 Discussion
3.1 Physical association of the Sculptor clouds
The quality of our present data on the Hi distribution in the line of sight of the Sculptor dSph gives us an opportunity to address the issue of the physical association of Hi gas with a dSph in a more conclusive manner than any previous study. In the past, the attempts to associate nearby Hi gas with dSph galaxies have been hampered by some of the following factors: lack of spatial coverage (C98), low angular and velocity resolutions (Blitz & Robishaw, 2000), and lack of stellar radial velocity information (Oosterloo, Da Costa, & Staveley-Smith, 1996). In this study, we achieve both sufficiently large spatial coverage (, with the area covered being 14 times larger than the area of the Sculptor stellar body) and high angular and velocity resolutions (1.65 km s-1) by combining the single-dish Parkes with intereferometric ATCA observations. In addition, the stellar radial velocity of the Sculptor dSph is now known to a high accuracy (Table 1).
The locations and radial velocities of the NE and SW clouds leave us with only two possible alternatives in regards to the physical association with the Sculptor dSph: the case of a larger distance (the clouds belong to the Sculptor group of galaxies), and the case of a smaller distance (the clouds are Galactic HVCs). We will consider both possibilities in turn.
At the distances of the Sculptor group members ( Mpc, Jerjen et al. 1998) the clouds would have very large size ( kpc) and total mass ( M⊙). Isolated intergalactic Hi clouds of this size are not known. Moreover, the Hα flux of 0.22 R, detected in the densest part of the SW cloud (see Section 3.2), is too large to be caused by the metagalactic ionizing radiation background, and is most naturally explained by the impact of the LyC radiation from the Milky Way, implying a small distance to the clouds of kpc. The clouds also cannot belong to a galaxy located at the distance of the Sculptor group: a gas-rich galaxy of this size would be a disk galaxy, which is at odds with both the irregular shape of the clouds and the absence of a clear rotation signature. We conclude that the Sculptor group hypothesis appears to be inconsistent with the available data.
The second alternative — the SW and NE clouds being HVCs — is more difficult to discard. HVCs are clouds that do not fit any simple galactic rotation models. These clouds are often associated in large HVC complexes that are believed to be of similar origin. One of these complexes, the Magellanic Stream, has many components near the Sculptor dSph, but its velocity in this direction, km s-1 (Mathewson & Ford, 1984), makes it a very unlikely association.
One should also realize that the majority of the HVCs is not part of an HVC complex. What is seen in Figure 1 could be independent HVCs which happened to be in the line of sight of the Sculptor dSph and have radial velocities very close to the radial velocity of the dwarf. We estimated the probability of such an event in the following manner. As can be seen in Table 3, the number of HVCs from the catalog of Putman et al. (2002) located within from the Sculptor dSph and having heliocentric radial velocities within the interval km s-1 is (excluding the Sculptor clouds). We considered the NE and SW clouds to be one cloud. The center of mass of this cloud is located at the distance from the center of the Sculptor dSph, and has a radial velocity of 104 km s-1, resulting in the difference km s-1 between the stellar and Hi velocities. Assuming that locations and radial velocities of the HVCs are uncorrelated and distributed uniformly within the circle with the radius and the velocity interval , the probability to find at least one HVC located within from the center of the Sculptor dSph and having radial velocity within from the velocity of the dwarf galaxy is given by the following expression:
| (1) |
(The exponent is because we also include the Sculptor cloud; the velocity interval is multiplied by 2 because the difference in velocities can be both positive and negative.) In our case, km s-1, and the probability that the Sculptor cloud is an HVC is %. Even if no velocity information was available and we had included all the clouds in Table 4 in our calculation, the probability would still only be %. If we considered the Sculptor clouds to be two independent HVCs, the corresponding probability would be a few orders of magnitude lower. Of course, either one or both of our assumptions (absence of correlation, and uniform distribution) might prove to be wrong, so the probability % derived above should be treated with caution.
There is one fundamental flaw in the above probability derivations. To obtain equation (1), we implicitly assumed that our choice of a dSph galaxy (Sculptor) is an unbiased one. In reality, there are other Galactic dSphs, and the reason we are so interested in Sculptor is because it happened to have Hi gas in its vicinity with similar radial velocity. The correct question to ask would be: “What is the probability that at least one of the dSphs has at least one HVC in its vicinity, which is located as close (or even closer) to the dwarf galaxy (both spatially, and in radial velocity) as the Sculptor dSph cloud is?” To answer this question one would need to calculate corresponding individual probabilities using equation (1) for the 8 known dSphs (we exclude Sagittarius as it appears to be in the process of being disrupted by the Galactic tidal field), and then to estimate the total probability as
| (2) |
Assuming for simplicity that the individual probabilities are the same for all dSphs, and are equal to the derived above probability for the Sculptor dSph (%), the total probability is %. Even in this more realistic approach, the probability of the Sculptor clouds being HVCs appears to be very low.
It is clear from Figure 6 and Table 2 that the Sculptor clouds are quite different from at least some of the other nearby features. NGC 300 is a spiral galaxy; its Hi cannot be confused with other structures in Figure 6. The Milky Way’s Hi in that direction, although beeing near the South Galactic Pole line of sight, still has some leftover emission at +40 km s-1. This residual emission is relatively faint when compared with the bulk emission at 0 km s-1 but is still very bright when compared with other “background” sources. A careful inspection of the dataset reveals that Region 2 is such an extension and it is most likely some sort of feature from the Milky Way.
HVC 1625 has two distinct components: a large (1) filament with a low velocity dispersion and a compact (spatially unresolved) core with a higher dispersion. HVC 1640 is a compact object having a high dispersion, similar to HVC 1625. These objects have velocity structures that are very different from the other clouds seen in Figure 6. Therefore they are probably of different origin.
Region 1 is composed of two types of structure: a broad region with a low dispersion and a very high dispersion compact core. This apparently high dispersion value is artificially inflated by the overlap of two clouds with different velocities and should be treated as an artifact. The compact cloud is probably an extension of the Galactic Hi, similar to the case of the Region 2. The other clouds of Region 1, HVC 1427 and HVC 1550 are all similar in size and kinematic structure to the Sculptor clouds. It is conceivable then that these clouds are part of a larger Hi stream. The shape of the SW cloud also suggests that this link might be real. Analysis of the velocity field (Figure 5) suggests a velocity gradient between the SW cloud and HVC 1550. However, upon inspection of all HVCs (Table 3 and 4), there is no evidence for an Hi stream in this region. The velocities of the nearby clouds are dispersed in an incoherent pattern.
One of the most interesting results obtained in the present work is the almost perfect agreement between the Hi velocity for the both Sculptor clouds (Table 5) and the optical velocity of the dwarf (Table 1). The difference in velocities for the Parkes data is km s-1. However, a kinematic agreement between Hi clouds and dSph galaxies is to be regarded with caution. Alone, this should never be considered as an evidence for an Hi association.
In the case of the Sculptor dSph, the fact that almost all of the detected Hi emission is contained within the optical boundaries of the dwarf galaxy (Figure 1), the symmetric location of the two clouds relative to the galactic center (Figure 2), the closeness of the radial velocities between the clouds and the dwarf, the low inferred probability % for the clouds to be HVCs, and the presence of an arm coming out of the SW cloud and pointing in the direction of the Sculptor dSph center (Figure 2), strongly favor the physical association of the clouds and dwarf galaxy. However, in the absence of accurate distance measurements to the Hi clouds, the HVC hypothesis remains a possible (though unlikely) alternative.
3.2 Nature of the Clouds associated with the Sculptor dSph
Having argued that the NE and SW clouds are physically associated with the Sculptor dSph, the important question to answer is whether the clouds are still gravitationally bound to the dwarf galaxy, or if they have been removed by some mechanism — either internal (winds from red giants, supernovae type Ia), or external (ram pressure stripping by the Galactic hot halo gas, Galactic tidal field).
The symmetric location of the clouds relative to the center of the Sculptor dSph along its proper motion vector (see Figure 2) appears to be consistent with the tidal removal picture. However, the orientation of the stellar body of the dwarf which has a comparable angular extent to that of the Hi gas (see Figure 1) indicates that the tidal forces have not played a major part in shaping the galaxy. The biggest obstacle for another external removal mechanism — ram pressure stripping — is the presence of the NE cloud ahead of the proper motion (Figure 2).
An important observational evidence for the clouds being gravitationally bound to the dwarf would be a rotation signature for the gas. C98 speculated on the possibility of rotation of the NE and SW clouds around the center of the Sculptor dwarf. It is clear from Figure 4 that there is a velocity gradient between the two clouds. The classical Newtonian formula gives a central mass of M⊙ when using the Parkes velocity information (rotation speed of 2.5 km s-1 at a distance of 20′, see Table 5 and Figure 4). The ATCA velocity information gives an enclosed mass of 2.7 M⊙ with the same conditions but a rotation speed of 5 km s-1. These estimates assume that the gas follow a circular orbit viewed edge on, therefore no projection effect on the distance or velocity of the clouds have been taken into account and the gas is considered to be neither infalling nor expanding. Mateo (1998) gives a total mass of 6.4 M⊙ for the Sculptor dSph. The inferred rotation speed values are comparable to or less than the internal velocity dispersion in the clouds (see Table 2). In this respect, the Sculptor dSph would be similar to low luminosity dIrr and dIrr/dSph galaxies, such as GR 8, Leo A, SagDIG, and LGS 3.
Our main argument against any Hi removal scenario (either internal or external) is that the gas removal would not solve the ISM crisis in dSph galaxies (Mateo, 1998). The alternative is that the NE and SW clouds are gravitationally bound to the Sculptor dSph, and are part of its ISM.
MCB proposed a scenario which can explain the statistical differences between the low luminosity dwarf galaxies in the Local Group. They showed that the FUV radiation escaping from spiral galaxies can warm up and photoionize the ISM of their dSph satellites, quenching star formation and making the ISM virtually unobservable. Only during relatively short duration passages through the plane of the host galaxy does the FUV radiation flux become small enough to allow the ISM to recombine and potentially form stars. An important requirement of the model is that many dSph galaxies should possess extended and very massive dark matter halos (with virial temperature K), allowing them to keep the warm photoionized ISM with temperature K gravitationally bound. There is a growing number of evidence supporting the idea of the dSph galaxies being more massive than the predictions of the mass-follows-light King model (Odenkirchen et al., 2001; Kleyna et al., 2001; Hayashi et al., 2003).
The Sculptor dSph is located relatively close to the Milky Way ( 80 kpc), and is close to the southern Galactic pole. According to the photoevaporation model of MCB, it is expected that the ionizing radiation escaping from the Galactic disk should affect significantly the Sculptor Hi clouds. Because the Sun is located much closer to the Galactic center than to the Sculptor dSph, the photoionized regions of the clouds would be seen approximately face-on. In the photoevaporation scenario, the photoionized gas expands with a speed comparable to its sound speed ( km s-1). First it moves normally to the Hi cloud surface. If the H ii gas stays gravitationally bound to the galaxy, it will soon decline from the normal direction. As a result, the Hα spectral line from the photoionized gas is expected to be blue-shifted by km s-1 relatively to the 21 cm spectral line from the neutral cloud.
Weiner et al. (2001) detected Hα emission from the SW cloud with a flux of mR. The heliocentric radial velocity of the ionized gas is km s-1 (formal / systematic errors) (B. J. Weiner 2001, private communication). Figure 7 shows both the Hα detection and the Hi spectral line integrated over the same area. The Hi line has a peak at km s-1 (which is virtually identical to the stellar radial velocity). The H ii gas appears to be blue-shifted by km s-1 relative to the Hi cloud, which is consistent with the prediction of the photoevaporation model of MCB. More accurate measurements of the radial velocity of the Hα emitting gas are required to confirm this result with higher confidence.

Another interesting feature of Figure 7 is the presence of a red-shifted tail in the Hi spectral line. Both analytical (Bertoldi & McKee, 1990) and numerical (Lefloch & Lazareff, 1994) calculations showed that under a wide range of initial conditions photoevaporating interstellar clouds tend to a quasi-equilibrium cometary state. The cometary tail in these models consists of the neutral gas accelerated away from the cloud. The gas in the tail is neutral because it is shielded from the ionizing radiation by the bulk of the cloud. The red-shifted Hi gas in Figure 7 could be a cometary tail of the photoevaporating cloud.
4 Conclusions
New observations of the Hi gas in a large area of around the Sculptor dSph are presented. Combination of single-dish (Parkes) and interferometric (ATCA) observations allowed us to achieve both large angular coverage and high angular resolution. These new data sets are of significantly higher resolutions than any other previously released data sets in the line of sight of the Sculptor dSph. Our principal results are:
-
1.
Large angular coverage is required in order to claim to understand the Hi properties of dSph galaxies. Our new data now shows the full extent of the C98 clouds. The size of these clouds is found to be much larger than the largest angular scale () the C98 observations were sensitive to.
-
2.
The single-dish Parkes radiotelescope observations give a total Hi mass for the C98 clouds of [D/79kpc]2 M⊙. The heliocentric radial velocity of the gas is 104 km s-1.
-
3.
Arguments that the C98 Sculptor clouds are physically associated with the dwarf, thus at a distance of 79 kpc, are presented, the most important ones being the closeness of the radial velocities for the Hi gas and the stars ( km s-1 based on the Parkes data), and the location of almost all of the Hi emission (88% of the total flux) within the stellar body of the dwarf (in projection). The unlikely possibility of the clouds being part of a general ensemble of compact HVCs cannot be ruled out on the basis of the available data.
-
4.
The combination of the present Hi observations with the Hα emission line detection from the southwest cloud (Weiner et al., 2001) gives support to the FUV radiation harassment model of MCB. The difference in radial velocities between the neutral and ionized gas is found to be km s-1, which is consistent with the Sculptor clouds being photoevaporated by the Milky Way LyC radiation.
We are grateful to Lister Staveley-Smith for helpfull discussions. We acknowledge financial suport from NSERC, Canada and FQRNT, Québec. The Australia Telescope Compact Array and Parkes telescope are part of the Australia Telescope which is funded by the Commonwealth of Australia for operation as a National Facility managed by CSIRO.
References
- Andersen & Burkert (2000) Andersen, R.-P. & Burkert, A. 2000, ApJ, 531, 296
- Barnes et al. (2001) Barnes, D. G. et al. 2001, MNRAS, 322, 486
- Bertoldi & McKee (1990) Bertoldi, F. & McKee, C. F. 1990, ApJ, 354, 529
- Blais-Ouellette et al. (2001) Blais-Ouellette, S., Amram, P., & Carignan, C. 2001, AJ, 121, 1952
- Blitz & Robishaw (2000) Blitz, L. & Robishaw, T. 2000, ApJ, 541, 675
- Burkert & Ruiz-Lapuente (1997) Burkert, A. & Ruiz-Lapuente, P. 1997, ApJ, 480, 297
- Carignan (1998) Carignan, C. 1998, Highlights in Astronomy, 11, 121
- Carignan et al. (1998) Carignan, C., Beaulieu, S., Côté, S., Demers, S., & Mateo, M. 1998, AJ, 116, 1690 (C98)
- de Blok et al. (2001) de Blok, W. J. G., McGaugh, S. S., Bosma, A., & Rubin, V. C. 2001, ApJ, 552, L23
- de Vaucouleurs et al. (1991) de Vaucouleurs, G., de Vaucouleurs, A., Corwin, H. G., Jr., Buta, R. J., Paturel, G., & Fouque, P. 1991, Third Reference Catalogue of Bright Galaxies (New York: Springer-Verlag)
- Ferrara & Tolstoy (2000) Ferrara, A. & Tolstoy, E. 2000, MNRAS, 313, 291
- Grebel (1997) Grebel, E. K. 1997, Reviews of Modern Astronomy, 10, 29
- Grebel (1998) Grebel, E. K. 1998, Highlights in Astronomy, 11, 125
- Hayashi et al. (2003) Hayashi, E., Navarro, J. F., Taylor, J. E., Stadel, J., & Quinn, T. 2003, ApJ, 584, 541
- Irwin & Hatzidimitriou (1995) Irwin, M. & Hatzidimitriou, D. 1995, MNRAS, 277, 1354
- Jerjen et al. (1998) Jerjen, H., Freeman, K. C., & Binggeli, B. 1998, AJ, 116, 2873
- Kleyna et al. (2001) Kleyna, J. T., Wilkinson, M. I., Evans, N. W., & Gilmore, G. 2001, ApJ, 563, L115
- Lefloch & Lazareff (1994) Lefloch, B. & Lazareff, B. 1994, A&A, 289, 559
- Mac Low & Ferrara (1999) Mac Low, M. & Ferrara, A. 1999, ApJ, 513, 142
- Mashchenko et al. (2003) Mashchenko, S., Carignan, C., & Bouchard, A. 2003, ApJ, submitted (astro-ph/0203317) (MCB)
- Mateo (1998) Mateo, M. L. 1998, ARA&A, 36, 435
- Mathewson & Ford (1984) Mathewson, D. S. & Ford, V. L. 1984, in IAU Symp. 108: Structure and Evolution of the Magellanic Clouds, 125
- Moore et al. (1999) Moore, B., Ghigna, S., Governato, F., Lake, G., Quinn, T., Stadel, J., & Tozzi, P. 1999, ApJ, 524, L19
- Odenkirchen et al. (2001) Odenkirchen, M. et al. 2001, AJ, 122, 2538
- Oosterloo et al. (1996) Oosterloo, T., Da Costa, G. S., & Staveley-Smith, L. 1996, AJ, 112, 1969
- Putman et al. (2002) Putman, M. E. et al. 2002, AJ, 123, 873
- Schweitzer et al. (1995) Schweitzer, A. E., Cudworth, K. M., Majewski, S. R., & Suntzeff, N. B. 1995, AJ, 110, 2747
- Spaans & Norman (1997) Spaans, M. & Norman, C. A. 1997, ApJ, 483, 87
- van Zee (2001) van Zee, L. 2001, AJ, 121, 2003
- Weiner et al. (2001) Weiner, B. J., Vogel, S. N., & Williams, T. B. 2001, preprint (astro-ph/0109055)
- Young & Lo (1996) Young, L. M. & Lo, K. Y. 1996, ApJ, 462, 203
- Young & Lo (1997) — 1997, ApJ, 490, 710