Spatially resolved spectroscopy of Coma cluster early – type galaxies: III. The stellar population gradients
Based on Paper I of this series (Mehlert et al. 2000), we
derive central values and logarithmic gradients for the , Mg and Fe
indices of 35 early-type galaxies in the Coma cluster. We find that
pure elliptical galaxies have on average slightly higher velocity
dispersions, lower , and higher metallic line-strengths than
galaxies with disks (S0). The latter form two families, one
comparable to the ellipticals and a second one with significantly
higher , and weaker metallic lines. Our measured logarithmic
gradients within the effective radius are
, ,
and . The gradients
strongly correlate with the gradients of , but only weakly
with the central index values and galaxy velocity dispersion.
Using
stellar population models with variable element abundance ratios from
Thomas, Maraston & Bender (2003a) we derive average ages,
metallicities and [] ratios in the center and at the effective
radius.
We find that the ratio correlates with velocity dispersion
and drives 30% of the Mg- relation, the remaining 70% being
caused by metallicity variations.
We confirm previous findings that part of the lenticular galaxies in
the Coma cluster host very young ( Gyr) stellar populations,
hence must have experienced relatively recent star formation
episodes. Again in accordance with previous work we derive negative
metallicity gradients ( dex per decade) that are
significantly flatter than what is expected from gaseous monolithic
collapse models, pointing to the importance of mergers in the galaxy
formation history. Moreover, the metallicity gradients correlate with
the velocity dispersion gradients, confirming empirically earlier
suggestions that the metallicity gradient in ellipticals is produced
by the local potential well. The gradients in age are negligible,
implying that no significant residual star formation has occurred
either in the center or in the outer parts of the galaxies, and that
the stellar populations at different radii must have formed at a
common epoch. For the first time we derive the gradients of the ratio and find them very small on the mean. Hence, enhancement
is not restricted to galaxy centers but it is a global phenomenon.
Our results imply that the Mg- local relation inside a galaxy,
unlike the global Mg- relation, must be primarily driven by
metallicity variations alone. Finally we note that none of the
stellar population parameters or their gradients depend on the density
profile of the Coma cluster, even though it spans 3 dex in density.
Key Words.:
Galaxies: clusters: individual: Coma – Galaxies: elliptical and lenticular – Galaxies: stellar content1 Introduction
This is the third paper of a series studying the dynamics and the stellar populations of a sample of 35 early-type galaxies in the Coma cluster, the richest of the local universe and therefore an ideal place to test the theories of galaxy formation as a function of environmental density. In Mehlert et al. (2000, hereafter Paper I) we presented the photometry and the long-slit spectroscopy along the major axis of the galaxies. In Wegner et al. (2002) this dataset is complemented by long-slit spectroscopy along the minor axis and parallel to the major axis for 10 objects of the sample. Here we focus on the radial profiles of the Mg, Fe and H indices derived in Paper I, exploiting newly developed stellar population models (Thomas, Maraston & Bender 2003a, hereafter TMB) to study the metallicity, the age and the distributions inside the galaxies and relate these findings to the global relations among the galaxies.
Recently, a number of papers have investigated the constraints on the ages, metallicities and element abundances of Coma cluster galaxies coming from (central) colors and spectroscopic (Lick) index measurements and the possible influence of the environmental density. Jørgensen (1999) studies 115 E and S0 galaxies in the central region of the cluster, suggesting that metallicities are strongly anti-correlated with the mean ages of the galaxies. Poggianti et al. (2001a) analyze the spectra of 52 early-type Coma galaxies and find that more than 40% of the S0s are found to have undergone star formation in their central regions during the last 5 Gyr, while such activity seems absent in ellipticals (see also Trager et al. 2003). Poggianti et al. (2001b) extend this study to a sample of 257 galaxies with no emission lines, spanning a wide magnitude range. They find that age and metallicity are anti-correlated in any given luminosity bin and that in the central regions of the cluster a large fraction of galaxies at any luminosity shows no evidence for star formation occurring in their central regions at redshift . Carter et al. (2002) focus on the possible environmental dependence of the indices, finding that after allowing for the correlation with magnitude, galaxies near the core of the cluster have stronger Mg2, while the Fe and H values show a much weaker sensitivity to the cluster distance. In contrast, Kuntschner et al. (2002) study a sample of “field” E/S0 galaxies in low-density environments, reaching the conclusion that these objects are younger than E/S0s in clusters (by Gyr) and more metal-rich (by dex). They confirm that an anti-correlation of age and metallicity is responsible for maintaining the zero-point of the Mg- relation (see also Kuntschner et al. 2001, pointing out the role of correlated errors in generating this anti-correlation).
Similar to Terlevich & Forbes (2002), these studies break the metallicity-age degeneracy by combining pairs of indices with nearly orthogonal dependences on metallicity and age, and are based on simple stellar population models (Worthey 1994, Vazdekis et al. 1996). They take into account the overabundance of the –elements with ad-hoc assumptions (Jørgensen 1999) or simple, approximated recipes (Trager et al. 2000) and might be severely affected by systematics induced by complex metallicity distributions (Maraston & Thomas 2000). However, they provide a way to test the low-redshift predictions of galaxy formation models and distinguish between the traditional “monolithic collapse” of proto-galactic gas clouds (Eggen, Lynden-Bell & Sandage 1962; Jimenez et al. 1999) and the hierarchical models of Cold Dark Matter cosmologies (Kauffmann 1996; Baugh et al. 1996; Cole et al. 2000). Moreover, they allow a powerful insight in the mechanisms generating the global relations observed with the structure parameters of early-type galaxies (the color-magnitude relation, Bower et al. 1992; the Mg- relation, Bender, Burstein & Faber 1993; Colless et al. 1999; the Fundamental Plane, Djorgovski & Davis, 1987, Dressler et al. 1987) and regulating their scatter. In addition, they are the local counterpart of the studies of the evolution of early-type galaxies with redshift in clusters (van Dokkum & Franx 1996, Bender et al. 1998, van Dokkum & Standford 2003) and in the field (Treu et al. 1999; van Dokkum et al. 2001). Analyzing a large number of objects, they are also able to detect the possibly subtle effects of the environment.
The present paper cannot compete in terms of galaxy numbers with the literature discussed above. Rather, it relies on the high quality of the data and stresses two aspects neglected in the past: First a rigorous quantitative analysis of the role in determining the ages and metallicities of early-type galaxies, and second the discussion of the radial variations of the stellar populations of the galaxies. The former is based on newly developed models of the Lick indices (TMB) that incorporate the response functions of Tripicco & Bell (1995), allowing a proper treatment of the element abundances. The latter provides an additional tool to test the predictions of galaxy formation models.
“Classical” monolithic collapse models with Salpeter IMF (Carlberg 1984) generate steep metallicity gradients (the centers are more metal rich than the outer parts), shallow positive age gradients (the centers are slightly younger than the outer parts) and positive overabundance gradients (the centers are less enhanced, Thomas, Greggio and Bender 1999). The merger trees typical of hierarchical models of galaxy formation (Lacey & Cole 1993) are expected to dilute gradients originally present in the merging galaxies and therefore give end-products with milder gradients (White 1980), although detailed quantitative predictions are still lacking. There is consensus that the radial changes in colors and line indices observed in local ellipticals reflect variation in metallicities rather than age (Faber 1977; Davies et al. 1993; Kobayashi & Arimoto 1999), a conclusion confirmed by the study of the evolution of the color gradients with redshift (Saglia et al. 2000; Tamura et al. 2000). However, nothing is known about possible radial gradients of the abundance ratio detected at the centers of early-type galaxies. If no gradients are present, then the bulk of the stars of elliptical galaxies are overabundant and the constraint of short ( Gyr) formation time-scales (e.g., Matteucci 1994; Thomas, Greggio & Bender 1999) applies to the stellar populations of the galaxies as a whole, and not only to the galaxy centers. Our dataset clarifies this issue.
The paper is organized as follows. Section 2 describes the dataset. Section 3 discusses the central values and the radial profiles of the line indices. Section 4 derives constraints on the age, metallicities and the distributions inside the galaxies (central values and gradients). Conclusions are drawn in Section 5.
2 The data sample
The basis of this investigation are the radial line index profiles of , , and as well as the profile of the velocity dispersion derived for 35 early-type galaxies in Mehlert et al. (2000, Paper I). These parameters were obtained from high S/N and spatially resolved longslit spectra obtained along the major axis of the galaxies. Details on the galaxy sample, the observations, data reduction and parameter derivation are described in Paper I. With this dataset we can not only investigate the stellar population of the galaxies based on their central line indices, but also derive the gradients of the line indices and the stellar population parameters like age, metallicity and the ratios. Since the sample analyzed here comprises E and S0 galaxies and spans a range of 3 dex in local mass densities (as determined by X-ray observations, Briel, Henry and Böhringer 1992), the influence of galaxy type and environmental density on the stellar population of the Coma cluster early type galaxies can be explored. In Paper I we already showed that our derived line index and values agree quite well with literature data. This is also supported by a detailed comparison to a different galaxy sample in Moore et al. (2002).

3 Line indices
3.1 Central values
Table 2 lists the central values of the indices , , Fe5270, Fe5335 and of the velocity dispersion with the respective errors. The values have been derived from the major axis profiles shown in Paper I averaging data points inside , where is the distance along the major axis, that corresponds to the effective radius of the galaxy with ellipticity . The central values were calculated by weighting proportional to the signal-to-noise ratio S/N:
| (1) |
where indicates the radial points available. This way of weighting our radial values turned out to be a good compromise to optimize the quality of the mean values without overemphazising the central value.
In the following we indicate the average Iron index with (Gorgas et al. 1990) and the combined Magnesium-Iron index with
| (2) |
newly defined by TMB. This index turns out to be completely independent of the and hence serves best as a metallicity tracer. The usual index earlier defined by González (1993) still depends a little on (see also Sect. 4.1). We also consider the index (see Colless et al. 1999):
| (3) |
with Å.
In Fig. 1 we plot the central index values as a function of velocity dispersion. Our data show a tight Mg- correlation (panel a) in good agreement with the literature (e.g., Bender et al. 1993; Colless et al. 1999). Correlations of velocity dispersion with the other indices and , instead, are much less well-defined (panels b and c) in agreement with results from, e.g., Jørgensen et al. (1999). Still, seems to be weakly correlated with (see also Kuntschner 2000). Linear least square fits (see the solid lines in Fig. 1) yield the following relations:
Although there is no striking difference between elliptical and lenticular galaxies in Fig. 1 (see also Mehlert 1998), we note that the S0s in our sample have on average lower central velocity dispersions, and tend to have slightly lower metallic indices at a given . The most significant feature is the separation of the lenticulars in two distinct subclasses, one being almost indistinguishable from the ellipticals, the other having extraordinarily high values. We will come back to this point in Sect. 4, where we discuss the derived ages and element abundances.
Note that also the two cD galaxies (triangles) have Balmer lines that are unusually strong given the relatively high galaxy’s velocity dispersion. For a detailed discussion of the properties of the stellar populations (age, metallicity and ratios) derived from these indices see Sect. 4.2.
Finally it should be emphasized that we do not find any dependence of the derived indices or the galaxies velocity dispersion on the density profile of the Coma cluster.
3.2 Gradients
We compute logarithmic index and velocity dispersion gradients performing a linear fit to the data points within , where is the distance from the center along the major axis.
| (5) |
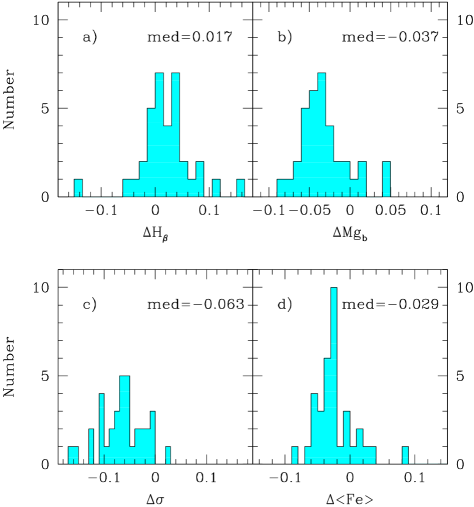
The fitted gradients and the logarithmic values of the indices and at are listed in Tables 3 and 4, respectively. The number distribution of the gradients and their median values are shown in Fig. 2. The velocity dispersion and the metallic line indices and show on average negative gradients. The median of the Balmer line gradient, instead, is positive. The -gradients measured here (with a median values of -0.063) agree quite well with those found by Davies et al. (1987) and are slightly steeper than the modeling of Jørgensen et al. (1995), who use -0.04. gradients are not available in the literature, the Mg2 gradient measured by Davies et al. (1993; Mg), however, tends to be slightly steeper than our values ( for , see Fig. 2). The median gradients in Fig. 2 are also somewhat shallower than measurements from Davies et al. (1993) and Gorgas et al. (1990), but are consistent within the errors. Reliable gradients for meaningful comparisons are not available in the literature.
Interestingly, we do not find any statistically significant correlation between index gradients and their central values or central velocity dispersion. There is only a very weak hint, that galaxies with stronger central metallic lines have steeper index gradients. Similar results for the Mg2 index have been found for 114 and 42 elliptical galaxies in the field by González & Gorgas (1995) and Carollo, Danziger, & Buson (1993), respectively.

We do find a correlation, however, between the metallic index gradients and the gradients in velocity dispersion. In Fig. 3 it is shown that both and become steeper with a steepening of at the significance level of and , respectively. Hence we basically confirm the validity of the assumption, made by Jørgensen et al. (1995) when modeling aperture corrections, that the and gradients correlate with the gradient of . However, this does not hold for (see 3c), where the median gradient is slightly positive. Moreover, our results indicate an aperture correction slightly steeper (but consistent within the errors) than the one proposed by Jørgensen et al. (1995) for the measurements ( instead of (), a shallower one for the values (), while on the spot for the data (). Anyway, in a recent paper Moore et al. (2002) show that the aperture correction is usually negligible since it is typically smaller or at most of the order of the individual index errors. It is also interesting to note that the slope of the local correlation is not very different from the one of the global correlation of Eq. LABEL:eqmgbsig.
Finally we note that, like for the central index values, no correlation between the index gradients and the density profile of the Coma cluster is present in our galaxy sample.
4 Ages, metallicities and ratios
4.1 The model
In the following we use the stellar population models of TMB in order to derive the stellar population parameters age, metallicity, and ratio from the line indices , , and .


The TMB models take into account the effects on the Lick indices from element abundance ratio changes, hence give Lick indices of simple stellar populations not only as a function of age and metallicity but also as a function of the ratio. They are based on the evolutionary population synthesis code of Maraston (1998). The impact from element ratio changes is computed with the help of the Tripicco & Bell (1995) response functions, using an extension of the method introduced by Trager et al. (2000a). Because of the inclusion of element ratio effects, the models allow for the clear distinction between total metallicity [] and the to iron-peak elements ratio []. The latter can be best derived from the classical Lick indices and Fe5270 and/or Fe5335 (Maraston et al. 2003, TMB). The models of TMB cover the ages 1 to 15 Gyr, metallicities , and the abundance ratios .
The Balmer line is widely used as an age indicator to break the age-metallicity degeneracy (González 1993; Worthey 1994), because it is very sensitive to warm turnoff stars. We note the caveat, however, that the possible presence of unusually warm horizontal branch stars in the stellar population can hamper the usefulness of Balmer lines as age indicators and seriously affect the age diagnostics (Maraston & Thomas 2000). Such blue horizontal branch stars may originate from either a metal-poor subpopulation or metal-rich populations with blue horizontal branch morphologies due to enhanced mass loss along the red giant branch evolutionary phase. The TMB models are constructed with the canonical mass loss rates along the red giant branch (Fusi-Pecci & Renzini 1976), that have been calibrated on galactic globular clusters (Maraston & Thomas 2000; Maraston et al. 2003). The effect described above, i.e. anomalies in the horizontal branch morphology as a further parameter besides age, metallicity, and ratio, is not considered in the present paper.
We derive the three stellar population parameters age, metallicity, and ratio from the three line indices , , and in a twofold iterative procedure. First, we arbitrarily fix the ratio, and determine ages and metallicities for the index pairs (,) and (,), by starting with arbitrary age-metallicity pairs, which we modify iteratively until both index pairs are reproduced. The two metallicities obtained from and , respectively, are used to adjust the ratio, and to start a new iteration. These steps are repeated until the age-metallity pairs derived from (,) and (,) at a given ratio are consistent within 1 per cent accuracy. For ages and metallicities between the grid points quoted above, we interpolate linearly.
4.2 Central values
From the central line indices (Table 2) we now derive the central ages, metallicities and ratios of the stellar population for the early type galaxies investigated in this paper using the TMB stellar population model described in Sect. 4.1.
4.2.1 The diagnostic diagrams
The left diagram in Fig. 4 shows the distribution of the central and indices plotted with the stellar population models of TMB. In this parameter space, mean age and total metallicity can be best read-off by eye, as both indices are practically insensitive to ratio variations as shown in TMB. In the right-hand panel of Fig. 4 we show models and data in the - plane, which provides a reasonably good first approximation of ratios, although age effects cannot be neglected for the final derivation of ratios. The models in the right panel are plotted for fixed age (12 Gyr). The precise central ages, metallicities and ratios derived for our sample are listed in Table 5.
Most objects have super-solar total metallicities and element ratios, hence they are enhanced. The sample spans a relatively large range in average ages from 2 to 15 Gyr in agreement with a recent study of Coma cluster galaxies by Trager et al. (2003). The bimodal distribution in the - parameter space is particularly interesting. We notice one ’clump’ at old ages scattering about an average age of 10 Gyr with a rather narrow distribution in metallicities (), and a second one at roughly 2 Gyr spanning a larger range in metallicities (). There is a very clear separation between the two. While the ’old clump’ contains all types of objects, i.e. ellipticals (E), lenticulars (S0) and transition types (E/S0), the ’young clump’ is by far dominated by S0 galaxies plus the two cDs. This result was already indicated by the distribution of the indices discussed in Sect. 3.1, where a subclass of lenticulars with high was pointed out.
Type N age rms(age) H rms(H) rms() Gyr Gyr E 11 10.5 3.1 0.24 0.06 0.26 0.06 E/S0 7 11.2 4.4 0.12 0.17 0.27 0.04 S01 7 9.6 1.3 0.14 0.06 0.21 0.06 S02 5 2.6 0.6 0.34 0.16 0.18 0.05
The average stellar parameters of these subclasses are summarized in Table 1. The averages exclude, however, the galaxy GMP 3958 (E) because of its extremely low Balmer index (, see Table 2), which implies an extrapolated unreasonable age of 24 Gyr (see Fig. 4). Also the three objects GMP3329 (cD), GMP2921 (cD), and GMP3561 (S0) are not included in these average values, because they lie outside the model grid, so that their derived stellar parameters are strongly affected by uncertainties caused by extrapolation. Finally, we excluded galaxy GMP3201 from the further discussion (averages in Table 1 and linear fits in Figs. 5 and 6), since the errors of the measured indices and hence the corresponding stellar parameters are systematically larger than those of all other objects.
Table 1 confirms the S0 dichotomy found by Poggianti et al. (2001a), who investigated a sample of 52 Coma early type galaxies. They interpret the young class (S02) as being the descendants of typical star-forming spirals whose star formation has been stopped due to the dense cluster environment, while the evolutionary history of the S01 class and Es should be identical. The low average ages of the young S0 subclass (S02) measured would then be the direct consequence of recent star formation that had ceased just recently due to the infall in the dense cluster environment. The resulting extended star formation histories would imply, however, a significant enrichment of iron from Type Ia supernovae, so that low ratios should be observed in contrast to the results found here (see Table 1). The relatively high ratios disfavor the occurence of recent star formation. They would be more compatible with the alternative interpretation that the high Balmer line indices measured in the objects of class S02 are actually caused by the presence of unusually blue horizontal branches in these objects rather than by young stellar populations (see Sect. 4.1).
4.2.2 Correlations with velocity dispersion

Fig. 5 shows the derived stellar parameters as a function of velocity dispersion . The parameter which correlates best with is the element ratio (panel c). Excluding the class of young S0s and cDs, also total metallicity correlates reasonably well with velocity dispersion (panel b). Age, instead, does not seem to be a major parameter among early-type galaxies (see also Trager et al. 2000b; Kuntschner et al. 2002; Trager et al. 2003). Again, the separation in two classes, the ’young’ one being dominated by S0 galaxies, is very striking (panel a).
It should be emphasized, however, that the age derivation is most affected by observational errors. A proper analysis to decide about possible trends of age with galaxy mass therefore requires a larger galaxy sample and the consideration of errors, e.g., via Monte Carlo simulations. Such an analysis is carried out in Thomas, Maraston, & Bender (2003b) for a sample of 126 field and cluster galaxies (including the present sample). Interestingly, the dichotomy mentioned above is confirmed for this larger sample (including galaxies in low density environments), and the data of the ’old clump’ are best consistent with age slightly increasing with galaxy mass. Still, the above conclusion that age is only a secondary parameter remains. The existence of a []- correlation, instead, is further reinforced by the study of Thomas et al. (2003b).
Fig. 5 shows that the elliptical galaxies and the ’old’ lenticular galaxies (class S01 in Table 1) follow the same correlations of metallicity and ratio with velocity dispersion. The total metallicities of the young lenticulars (class S02 in Table 1), instead, are significantly ( dex) higher than they are expected to be for their , while their ratios are consistent with their velocity dispersions.
Using the mean correlations shown in Fig. 5 (assuming a constant age of 9 Gyr) we can now reproduce the and indices with the TMB models, and in this way estimate the relative importance of metallicity and variations in generating the global Mg and Fe relations. The resulting index- relations for models in which only metallicity or only increases with are shown in Fig. 1 by the long and short-dashed lines, respectively. We deduce the contributions from metallicity and variations to the Mg relation to be approximately 70 and 30 per cent, respectively. Hence, we confirm that metallicity is the main driver of the relation, as suggested in the past. We show, however, that the ratio does play a non-negligible role. Fig. 1 further illustrates that the shallower Fe is the result of the combination of the (positive) metallicity dependence with the negative (anti-) correlation.

4.2.3 Correlations between the stellar population parameters
Possible correlations between the three stellar population parameters are explored in Fig. 6. There is a weak indication for a possible age-metallicity anti-correlation among the old subclass (above Gyr). It is more likely, however, that an anti-correlation at such low significance is an artifact caused by correlated errors in age and metallicity (Trager et al. 2000b; Kuntschner et al. 2002; Thomas et al. 2003b). Note also that the young subclass is not restricted to high metallicities, but exhibits, instead, a large range in metallicities from to 0.9 dex.
We detect the trend that galaxies with higher ratios tend to have older average ages (panel c, see also Thomas et al. 2002). This result is important, as it supports the connection between ratio and formation timescale. It is important to take into account that correlated errors actually lead to the opposite trend, namely higher ratios at younger ages (Thomas et al. 2003b).
It does not come as a surprise that, like the central indices, also the central ages, metallicities and ratios derived for our galaxy sample do not correlate with the density profile of the Coma cluster. Note that, except for a very small fraction of young field elliptical galaxies (see also Kuntschner et al. 2001), also Thomas et al. (2002) could not find any significant differences between early-type galaxies in low and high density environments with respect to their stellar parameters. Environmental density seems indeed to be only of secondary importance for the formation of early-type galaxies.
4.3 Gradients
We determine the gradients in ages, metallicities, and ratios from the fitted index gradients (, , ) and the logarithmic fit values at given in Tables 3 and 4 by means of the SSP models of TMB. The ages, metallicities, and ratios at and are derived and the gradient was set as the difference between the two. Hence, we obtain the variation of the stellar population parameters per decade within (see also Equation 5). The 1- errors were evaluated through Monte Carlo simulations taking into account the errors in the gradients and the logarithmic fit values of the three indices. For the two objects GMP3661 and GMP4679 no reliable gradients could be obtained, because the very high indices at would require extrapolation to ages much younger than covered by the grid of the present SSP models, which makes a reliable age determination impossible. Like in case of the central values, the very low of GMP3958 again made its age determination unreliable.
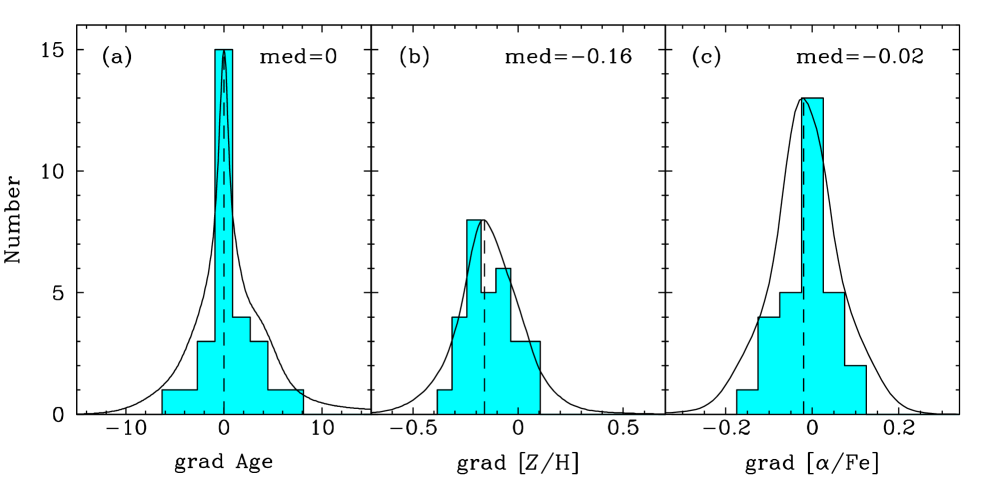
The final gradients of the age, metallicity and the ratio including their errors are listed in Tab. 6. Histograms of their number distributions and the median values are shown in Fig. 7. The solid lines are obtained by summing up the distributions of the gradients folded with their Gaussian errors.
4.3.1 Age and ratio
The most striking result is that, on average, the early-type galaxies in the Coma cluster do not exhibit gradients in age or ratio. The number distributions of the age and ratio gradients (panels (a) and (c) in Fig. 7) show both a very clear peak at zero. As the distributions in age and ratio are not well-defined Gaussians, we approximate their rms (Gaussian widths ) by the deviation of 68 per cent of the objects from the median value of the distribution. The resulting values for the age and gradients are 2.7 Gyr and 0.05 dex, respectively, and fully consistent with the respective median errors of the gradients (2.9 Gyr and 0.05 dex, see Table 6). In both cases, 91 per cent of the objects fall inside of the distributions. To conclude, the non-detection of a gradient within one effective radius in both age and for the sample studied here is a statistically significant result. Devations from the median value can be explained by observational errors alone. It is worth noting that we do not find a correlation between grad Age and grad [], or between grad Z and grad [], which further supports the above conclusion. There is a weak anticorrelation between grad Age and grad Z as a consequence of the expected correlated errors.
The lack of gradients in age and ratio is particularly interesting as both parameters reflect formation timescales. The presence of enhanced stellar populations is obviously not restricted to galaxy centers. Early-type galaxies are globally enhanced, at least within their effective radii. Hence, the formation epochs and timescales of the stellar populations do not significantly change within the galaxy as a function of radius. This conclusion goes along well with the lack of a significant age gradient. The stellar populations in a galaxy may form on long or on short timescales, but they form simultaneously in the entire galaxy independent of their distance to the galaxy center. Note that also the lack of a significant evolution with redshift of color gradients in early-type galaxies strongly disfavors the presence of age gradients in early-type galaxies (Saglia et al. 2000; Tamura et al. 2000).
This implies that scenarios with strong inside-out or outside-in formation processes are both disfavored. No significant residual star formation can have occurred either in the outskirts or in the center of a galaxy. This stands in conflict with simple monolithic models, that predict the onset of galactic winds to occur first at large radii, so that a positive gradient in should be detected (Martinelli et al. 1998; Thomas et al. 1999).
On the other hand, current models of hierarchical galaxy formation cannot easily accommodate globally enhanced stellar populations (Thomas & Kauffmann 1999). In general, one expects significant star formation to rapidly occur in the galaxy center triggered by a merger event (Schweizer 1990; Barnes 1992; Bender & Surma 1992). Therefore an overabundant stellar population should be present there (i.e. a centrally localized negative gradient, Thomas 1999). However, note that the spatial resolution of our data (typically , see Mehlert et al. 2000) allows us to detect decoupled cores in only two of our 35 galaxies (see Mehlert et al. 1998) and that our gradients avoid the central regions.
4.3.2 Metallicity


While age and the ratio indicate zero gradients, we do find a significant negative median metallicity gradient (panel b in Fig. 7). The distribution exhibits a well-defined peak at . The rms of this peak is 0.12 dex and fully consistent with the median error in the metallicity gradient ( dex, see Table 6). More than 97 per cent of the data points fall inside around the peak of the distribution. The median metallicity gradient found here is in agreement, although a bit flatter than previous determinations (e.g., Davies et al. 1993). It has already been discussed extensively in the literature (e.g., Peletier et al. 1990; see also references in the Introduction) that galaxy formation in a simple dissipative collapse (e.g., Larson 1974) would produce average metallicity gradients of about 0.5 dex per decade (Carlberg 1984), well in excess of the slope derived here. Hence some kind of mixing process, for instance induced by galaxy mergers, are required to flatten out the metallicity gradient (White 1980).
The total metallicity of a stellar population only depends on the efficiency of star formation, i.e. the fraction of gas turned into stars (e.g., Tinsley 1980). It seems therefore natural to assume that a relationship between metallicity and escape velocity produces the metallicity gradient (Franx & Illingworth 1990; Davies et al. 1993; Martinelli et al. 1998). In the galaxies’ center, where the gravitational potential is highest, star formation and hence the enrichment of metals is more effective than in outer regions with lower gravitational potential.
We find empirical support for this picture, as our data indicate a correlation between the metallicity gradient and the gradient in velocity dispersion (left panel in Fig. 8). Galaxies with steeper metallicity gradients have also steeper gradients in velocity dispersion. Note that the determination of the metallicity gradient is affected by uncertainties in the index gradient and hence the age gradient, due to correlated errors caused by the age-metallicity degeneracy. In other words, an erroneously steep negative age gradient causes a too flat or even positive metallicity gradient and vice versa. Therefore we determine the linear fit (solid line in left panel of Fig. 8) for those objects that are inside about the mean of the age gradients’ distribution (see Fig. 7). The galaxies outside one , hence objects with unusually steep positive or negative age gradients, are shown as smaller symbols. It can be seen that most outliers fall in that latter category. The right panel of Fig. 8 illustrates this effect esplicitly, by showing the residuals from the correlation between the gradients in metallicity and velocity dispersion (solid line) as a function of the age gradient. Objects with age gradients close to the median value follow the correlation surprisingly well, given the large error bars.
Finally we note that we did not find any significant evidence for correlations of the stellar population gradients with central velocity dispersion or other central stellar population properties, as well as other galaxy properties like galaxy type, velocity dispersion, and environmental density in terms of radial distance from the cluster center.
4.3.3 Global vs. intrinsic Mg- relations
In Sect. 4.2 we have shown that the variations of the ratio drive 30% of the global Mg- relation. The intrinsic Mg- relation, i.e. local velocity dispersion versus local Mg line-strength inside a galaxy, instead, must be due to metallicity variations alone, because of the absence of a significant gradient in and age. In other words, the global and intrinsic Mg- relations do not have a common origin. Somewhat amazingly, however, the slopes of the global and local relations are not very different.
5 Conclusions
From high S/N spectra of 35 early type galaxies in the Coma cluster we have measured central values and gradients within one effective radius of velocity dispersion and the line indices , , Fe5270, and Fe5335. With the new sensitive stellar population models of TMB, we have determined central values and gradients of the stellar population parameters age, total metallicity, and element ratio.
Central values
We find a very clear age dichotomy among the population of S0 galaxies in the Coma cluster. The first class is dominated by old ( Gyr) stellar populations and is practically indistinguishable from the elliptical galaxy population. The lenticulars of the second class, that also includes the two cD galaxies, have very young ( Gyr) average ages, hence are dominated by recent major star formation episodes. They may be the descendants of typical star-forming spirals whose star formation has been stopped due to the dense cluster environment (Poggianti et al. 2001a).
The element ratio correlates with central velocity dispersion, and drives 30% of the Mg- relation. We find the tendency that older galaxies have higher ratios (see also Thomas et al. 2002), which implies that the most massive galaxies in the Coma cluster had not only the shortest star formation timescales (because of the ratio; e.g., Matteucci 1994; Thomas et al. 1999) but were also the first to form.
Interestingly, none of the indices or the stellar population parameters depend on the density profile of the Coma cluster, which spans a range of about 3 dex. We conclude that environmental effects did not significantly influence on the evolution of the early-type galaxies in the Coma cluster.
Gradients
The most striking result from studying the stellar population gradients (within ) of our sample is the absence of a gradient in both age and ratio. The first direct important inference is that the existence of enhanced stellar populations in early-type galaxies is not restricted to their centers but it is a global phenomenon. The star formation timescales do not vary significantly inside a galaxy as a function of radius. The local potential at a given radius does not affect the formation timescales.
It does affect, instead, the fraction of gas lost in a galactic wind, as we detect a significant negative metallicity gradient. At larger radii, the potential is shallower, i.e. the escape velocity is lower, so that star formation is less complete and the metallicity is lower than in the center (e.g., Davies et al. 1993). This conclusion is further supported by the fact that we find a relationship between the metallicity gradient and the gradient in velocity dispersion.
Finally, the presence of a metallicity gradient and the absence of gradients in age and ratio show that the intrinsic Mg- relation, i.e. local velocity dispersion versus local Mg line-strength inside a galaxy, is driven by metallicity alone. We have shown that the global relation, instead, is driven by both metallicity and ratio, the former contributing roughly 70 the latter 30 per cent. Hence, the global and the intrinsic Mg- relations have different origins, the former being at least partially produced by formation timescales ( ratio), the latter by the local gravitational potential (metallicity) alone.
Acknowledgements.
We thank the referee Bianca Poggianti for very helpful comments and Scott Trager for the many interesting discussions. This work was supported by the Deutsche Forschungsgemeinschaft via project Be 1091/6 and SFB 375.References
- (1) Barnes J., 1992, ApJ 393, 484
- (2) Baugh, C.M., Cole, S., Frenk, C., 1996, MNRAS, 283, 1361
- (3) Bender R., Surma P. 1992, A&A 258, 250
- (4) Bender, R., Burstein, D., Faber, S.M., 1993, ApJ, 411, 153
- (5) Bender, R., Saglia, R.P., Ziegler, B., Belloni, P., Greggio, L., Hopp, U., Bruzual, G., 1998, ApJ, 493, 529
- (6) Bower, R.G., Lucey, J.R., Ellis, R.S., 1992, MNRAS, 254, 601
- (7) Briel, U., Henry, J.P., Böhringer, H., 1992, A&A, 259, L31
- (8) Burstein, D., Davies, R.L., Dressler, A., et al. 1988, in Towards Understanding Galaxies at Large Redshifts, Eds.: R.K. Kron and A.Renzini, Dordrecht, Kluwer.
- (9) Carlberg R.G., 1984, ApJ, 286, 403
- (10) Carter, D., Mobasher, B., Bridges, T.J., et al. 2002, ApJ, 567, 772
- (11) Carollo, M., Danziger, I.J., Buson, L. 1993, MNRAS, 265, 553
- (12) Cole, S., Lacey, C.G., Baugh, C.M., Frenk, C.S., 2000, MNRAS, 319, 168
- (13) Colless, M. Burstein, D., Davies, R.L., McMahan, R.K., Saglia, R.P., Wegner, G. 1999, MNRAS, 303, 813
- (14) Davies, R.L., Sadler, E.M., Peletier, R.F., 1993, MNRAS, 262, 650
- (15) Davies, R.L., Burstein, D., Dressler, A., et al., 1987, ApJS 64, 581
- (16) Djorgovski, S., Davis, M., 1987, ApJ, 313, 59
- (17) Dressler, A., Lynden-Bell, D., Burstein, D., et al. 1987, ApJ, 313, 42
- (18) Eggen, O.J., Lynden-Bell, D., Sandage, A.R. 1962, ApJ, 136, 748
- (19) Faber, S.M., 1977, in Tinsley, B., Larson, R.B. (eds.) The Evolution of Galaxies and Stellar Populations, Yale Univ. Obs., New Haven, p. 157
- (20) Franx, M., Illingworth, G.D. 1990, ApJ, 359, L41
- (21) Fusi-Pecci, F., Renzini, A., 1976, A&A, 46, 447
- (22) González, J.J., Gorgas J., 1996, in Fresh views of elliptical galaxies, ASP 86, p. 225, Eds.: A. Buzzoni, A. Renzini & A. Serrano
- (23) González J.J. 1993, PhD thesis, University of California, Santa Cruz
- (24) Gorgas, J., Efstathiou, G., Aragón-Salamanca, A. 1990, MNRAS, 245, 217
- (25) Jimenez, R., Friaca, A.C.S., Dunlop, J.S., et al., 1999, MNRAS, 305, L16
- (26) Jørgensen, I. 1999, MNRAS, 306, 607
- (27) Jørgensen I., Franx M., Kjærgaard P., 1995, MNRAS 276, 1341
- (28) Kauffmann, G., 1996, MNRAS, 281, 487
- (29) Kobayashi, C., Arimoto, N., 1999, ApJ, 527, 573
- (30) Kuntschner, H., Davies, R.L. 1998, MNRAS, 295, L29
- (31) Kuntschner, H., MNRAS, 315, 184
- (32) Kuntschner, H., Lucey, J.R., Smith, R.J., Hudson, M.J., Davies, R.L. 2001, MNRAS, 323, 615
- (33) Kuntschner, H., Smith, R.J., Colless, M., Davies, R.L., Kaldare, R., Vazdekis, A., 2002, MNRAS, 337, 172
- (34) Lacey, C., Cole, S., 1993, MNRAS, 262, 627
- (35) Larson, R.B. 1974, MNRAS, 166, 385
- (36) Maraston, C., 1998, MNRAS, 300, 872
- (37) Maraston, C., Thomas, D., 2000, ApJ, 541, 126
- Maraston et al. (2002) Maraston C., Greggio L., Renzini A., Ortolani S., Saglia R. P., Puzia T., Kissler-Patig M., 2003, A&A, 400, 823
- (39) Martinelli, A., Matteucci, F., Colafrancesco, S. 1998, MNARS, 298, 42
- (40) Mehlert, D., Saglia, R.P., Bender, R., et al. 2000, A&AS, 141, 449 (Paper I)
- (41) Mehlert D. 1998, PhD thesis, Universität München
- (42) Mehlert, D., Saglia, R.P., Bender, R., Wegner, G., 1998, A&A, 332, 33
- (43) Moore, S.A.W., Lucey, J.R., Kuntschner, H., et al. 2002, MNRAS, 336, 382
- (44) Peletier, R.F., Davies, R.L., Illingworth, G.D., Davis, L.E., and Cawson, M., 1990, AJ 100, 1091
- (45) Poggianti, B.M., Bridges, T.J., Carter, D., et al. 2001a, ApJ, 563, 118
- (46) Poggianti, B.M., Bridges, T.J., Mobasher, et al. 2001b, ApJ, 562, 689
- (47) Saglia, R.P., Maraston, C., Greggio, L., Bender, R., Ziegler, B., 2000, A&A, 360, 911
- (48) Schweizer F. 1990, in Dynamics and Interactions of Galaxies, p.60, Ed.: R. Wielen, Springer – Verlag
- (49) Tamura, N., Kobayashi, C., Arimoto, N., Kodama, T., Ohta, K., 2000, AJ, 119, 2134
- (50) Terlevich, A.I., Forbes, D. A., 2002, MNRAS, 330, 547
- (51) Tinsley, B. 1980, Fundam. Cosmic Phys., 5, 287
- (52) Thomas, D., 1999, MNRAS, 306, 655
- (53) Thomas, D., Kauffmann, G. 1999, in Spectrophotometric dating of stars and galaxies, ed. I. Hubeny, S. Heap, & R. Cornett, Vol. 192 (ASP Conf. Ser.), 261
- (54) Thomas, D., Greggio, L., Bender, R., 1999, MNRAS, 302, 537
- (55) Thomas D., Maraston, C., Bender R. 2002, Ap&SS, 281, 371
- (56) Thomas D., Maraston, C., Bender R. 2003a, MNRAS, 339, 897 (TMB)
- (57) Thomas D., Maraston, C., Bender R. 2003b, in preparation
- (58) Trager S.C., Worthey, G., Faber, S.M., et al. 1998, ApJS, 116, 1
- (59) Trager S.C., Faber, S.M., Worthey, G., González, J.J. 2000a, AJ, 119, 164
- (60) Trager S.C., Faber, S.M., Worthey, G., González, J.J. 2000b, AJ, 120, 165
- (61) Trager S.C., Faber, S.M., Dressler, A. 2003, ApJ, in preparation
- (62) Treu, T., Stiavelli, M., Casertano, S., Moller, P., Bertin, G., 1999, MNRAS, 308, 1037
- (63) Tripicco, M.J., Bell, R.A., 1995, AJ, 110, 3035
- (64) van Dokkum, P.G., Franx, M., 1996, MNRAS, 281, 985
- (65) van Dokkum, P.G., Franx, M., Kelson, D.D., Illingworth, G.D., 2001, ApJ, 553, L39
- (66) van Dokkum, P.G., Stanford, S.A., 2003, ApJ, 585, 78
- (67) Vazdekis, A., Peletier, R.F., Beckman, J.E., Casuso, E., 1996, ApJS, 106, 307
- (68) Wegner, G., Corsini, E.M., Saglia, R.P., Bender, R., Merkl, D., Thomas, D., Thomas, J., Mehlert, D., 2002, A&A, 395, 753
- (69) White S.D.M., 1980, MNRAS 191, 1
- (70) Worthey, G., 1994, ApJS, 95, 107
Appendix A Line indices
Nr. GMP Type d d Fe5270 dFe5270 Fe5335 dFe5335 d Nr. Å Å Å Å Å Å Å Å km/s km/s 1 3329 D 2.13 0.03 4.91 0.03 2.82 0.04 2.93 0.04 256.5 1.5 2 2921 D 1.94 0.07 5.45 0.08 2.93 0.08 3.15 0.09 380.6 5.1 3 4928 E/S0 1.41 0.10 4.90 0.11 2.83 0.12 2.68 0.13 272.3 4.7 4 4822 E 1.61 0.10 4.57 0.11 2.91 0.12 2.94 0.14 262.0 3.2 5 1750 E 1.55 0.13 5.17 0.13 3.08 0.15 2.47 0.17 300.5 2.7 6 2390 E 1.43 0.13 5.33 0.14 2.93 0.15 2.57 0.17 273.8 2.7 7 2795 S0 1.60 0.09 4.33 0.096 2.90 0.104 2.30 0.12 246.8 2.2 8 3792 E 1.39 0.13 5.39 0.14 2.99 0.15 2.72 0.17 284.7 4.9 9 2629 S0 1.72 0.13 4.32 0.13 2.78 0.12 2.72 0.13 191.9 2.0 10 3561 S0 2.26 0.14 4.48 0.12 2.96 0.16 2.99 0.17 283.0 4.3 11 2000 E 1.70 0.12 4.43 0.13 2.87 0.15 2.50 0.16 199.1 2.2 12 2413 S0 1.77 0.11 4.11 0.09 2.85 0.14 2.35 0.14 211.3 2.0 13 4829 E/S0 1.63 0.10 4.94 0.12 3.01 0.12 2.81 0.13 245.5 2.9 14 3510 E 1.41 0.12 4.83 0.13 2.98 0.15 2.82 0.16 201.5 2.8 15 2417 S0/E 1.61 0.17 4.55 0.18 2.82 0.20 2.39 0.22 224.4 3.8 16 2440 E 1.46 0.15 4.70 0.17 2.95 0.19 2.58 0.21 209.4 3.7 17 3414 S0 1.61 0.22 4.36 0.23 2.82 0.27 2.41 0.29 168.7 9.5 18 4315 E/S0 1.57 0.15 4.39 0.16 2.67 0.19 2.50 0.21 190.2 4.1 19 3073 S0 1.58 0.14 4.44 0.15 3.12 0.16 2.60 0.18 170.4 2.4 20 1853 S0 1.65 0.22 4.33 0.24 2.91 0.25 2.75 0.28 201.8 3.8 21 3201 E 2.29 0.42 4.12 0.44 2.53 0.48 1.88 0.56 181.7 5.7 22 3661 S0 2.25 0.16 4.20 0.17 2.79 0.18 2.86 0.20 177.8 7.3 23 4679 S0 2.37 0.12 3.42 0.13 2.45 0.14 2.62 0.16 82.0 2.2 24 3352 E/S0 2.05 0.17 4.00 0.18 2.80 0.19 2.73 0.22 186.7 6.7 25 2535 S0 2.22 0.08 3.93 0.09 2.91 0.09 2.88 0.10 124.4 3.0 26 3958 E 1.29 0.14 4.18 0.15 2.29 0.16 1.59 0.18 152.9 2.1 27 2776 S0/E 2.00 0.2 4.21 0.22 2.69 0.24 1.90 0.27 132.6 2.8 28 0144 E 1.76 0.04 4.53 0.04 2.89 0.05 2.98 0.05 217.1 1.4 29 0282 E 1.71 0.07 4.75 0.08 2.88 0.09 2.51 0.10 290.6 2.3 30 0756 S0 2.15 0.06 3.83 0.07 2.70 0.08 2.55 0.09 178.3 0.7 31 1176 S0 2.13 0.07 3.87 0.08 2.80 0.09 2.55 0.10 189.0 0.8 32 1990 E/S0 1.40 0.04 4.78 0.12 2.83 0.13 2.19 0.15 275.1 3.7 33 5279 E 1.54 0.093 4.89 0.10 2.91 0.12 2.70 0.13 269.1 2.7 34 5568 S0 1.62 0.066 4.82 0.07 2.80 0.08 2.63 0.09 226.9 1.8 35 5975 E 1.81 0.18 4.39 0.20 2.88 0.23 2.68 0.25 198.4 5.4
GMP Nr. Hβ dHβ Mgb dMgb Fe5270 dFe5270 Fe5335 dFe5335 d 3329 -0.006 0.010 -0.010 0.005 -0.035 0.009 -0.006 0.009 -0.025 0.009 2921 -0.026 0.023 -0.021 0.009 -0.036 0.017 -0.045 0.018 -0.065 0.015 4928 0.029 0.037 -0.046 0.013 -0.026 0.024 0.064 0.023 -0.004 0.024 4822 0.029 0.037 -0.046 0.013 -0.026 0.024 0.064 0.023 -0.023 0.020 1750 -0.050 0.048 -0.062 0.016 -0.046 0.028 0.025 0.036 -0.077 0.012 2390 -0.044 0.057 -0.045 0.015 -0.019 0.027 -0.022 0.035 -0.034 0.013 2795 0.042 0.015 -0.031 0.007 -0.002 0.011 0.004 0.018 -0.128 0.008 3792 0.045 0.044 -0.042 0.014 -0.034 0.027 0.007 0.033 -0.014 0.021 2629 0.110 0.027 0.001 0.013 -0.002 0.019 0.082 0.020 -0.005 0.012 3561 -0.010 0.034 -0.038 0.013 -0.017 0.027 -0.042 0.029 -0.103 0.014 2000 -0.001 0.032 -0.041 0.014 -0.026 0.024 -0.039 0.032 -0.053 0.016 2413 -0.011 0.025 -0.018 0.008 0.016 0.018 0.006 0.026 -0.059 0.008 4829 0.002 0.029 -0.038 0.010 -0.037 0.018 -0.056 0.021 -0.075 0.011 3510 0.038 0.031 -0.045 0.011 -0.050 0.021 -0.056 0.025 -0.050 0.017 2417 0.076 0.034 0.016 0.015 0.015 0.022 -0.031 0.030 -0.055 0.013 2440 0.064 0.034 -0.050 0.014 -0.046 0.024 -0.005 0.028 -0.169 0.018 3414 0.051 0.049 -0.034 0.021 0.018 0.034 -0.063 0.048 -0.088 0.021 4315 0.008 0.035 -0.036 0.013 -0.024 0.024 -0.056 0.029 -0.106 0.015 3073 0.037 0.039 -0.003 0.015 0.009 0.024 -0.008 0.032 -0.067 0.019 1853 0.043 0.060 -0.054 0.028 -0.044 0.045 -0.058 0.055 -0.151 0.021 3201 -0.136 0.085 0.043 0.034 0.011 0.058 0.165 0.070 0.022 0.031 3661 0.150 0.022 -0.037 0.016 -0.069 0.027 -0.047 0.027 -0.101 0.020 4679 0.003 0.031 0.040 0.022 -0.000 0.034 0.045 0.033 -0.005 0.035 3352 0.076 0.022 -0.029 0.014 -0.026 0.021 -0.094 0.029 -0.108 0.027 2535 -0.027 0.022 -0.051 0.013 -0.069 0.019 -0.044 0.021 -0.056 0.017 3958 0.005 0.052 -0.027 0.017 -0.028 0.034 -0.046 0.058 -0.037 0.021 2776 0.034 0.043 -0.019 0.024 -0.058 0.042 0.053 0.058 -0.015 0.015 0144 0.038 0.015 -0.055 0.007 -0.019 0.012 -0.031 0.013 -0.062 0.006 0282 0.022 0.022 -0.056 0.010 -0.042 0.018 -0.003 0.022 -0.069 0.006 0756 0.013 0.017 -0.071 0.011 -0.054 0.019 -0.053 0.022 -0.124 0.006 1176 0.012 0.014 -0.029 0.009 -0.028 0.014 -0.019 0.016 -0.084 0.004 1990 -0.002 0.040 0.015 0.014 -0.036 0.024 0.087 0.030 -0.095 0.009 5279 0.058 0.032 -0.068 0.013 -0.056 0.025 0.012 0.027 -0.063 0.011 5568 0.005 0.039 -0.035 0.014 -0.046 0.029 -0.012 0.032 -0.047 0.012 5975 0.017 0.040 -0.087 0.020 -0.029 0.033 -0.023 0.037 -0.078 0.016
GMP Nr. d d d d d Hβ Hβ Mgb Mgb Fe5270 Fe5270 Fe5335 Fe5335 3329 0.325 0.016 0.678 0.008 0.397 0.014 0.474 0.014 2.397 0.015 2921 0.246 0.030 0.708 0.012 0.409 0.022 0.426 0.024 2.477 0.020 4928 0.205 0.041 0.625 0.016 0.412 0.028 0.512 0.025 2.431 0.033 4822 0.196 0.032 0.639 0.012 0.420 0.022 0.493 0.020 2.387 0.024 1750 0.114 0.049 0.636 0.016 0.433 0.028 0.446 0.033 2.379 0.012 2390 0.098 0.063 0.674 0.016 0.435 0.029 0.372 0.038 2.384 0.014 2795 0.290 0.016 0.594 0.008 0.454 0.013 0.384 0.018 2.225 0.007 3792 0.198 0.033 0.680 0.011 0.445 0.022 0.461 0.025 2.434 0.020 2629 0.400 0.028 0.632 0.015 0.444 0.022 0.566 0.020 2.278 0.018 3561 0.319 0.028 0.612 0.010 0.446 0.021 0.413 0.023 2.340 0.010 2000 0.232 0.028 0.599 0.013 0.425 0.022 0.357 0.029 2.229 0.016 2413 0.228 0.028 0.601 0.010 0.493 0.018 0.404 0.026 2.237 0.010 4829 0.228 0.022 0.648 0.008 0.432 0.015 0.382 0.019 2.298 0.009 3510 0.202 0.026 0.625 0.010 0.406 0.019 0.370 0.024 2.245 0.015 2417 0.269 0.023 0.642 0.010 0.460 0.017 0.325 0.026 2.255 0.014 2440 0.240 0.021 0.616 0.009 0.420 0.016 0.408 0.018 2.140 0.014 3414 0.258 0.033 0.611 0.015 0.461 0.023 0.326 0.034 2.116 0.024 4315 0.199 0.033 0.595 0.011 0.392 0.020 0.311 0.025 2.134 0.014 3073 0.240 0.031 0.643 0.012 0.490 0.019 0.403 0.026 2.159 0.017 1853 0.263 0.044 0.582 0.023 0.423 0.036 0.394 0.045 2.132 0.016 3201 0.164 0.075 0.637 0.023 0.453 0.040 0.499 0.040 2.276 0.027 3661 0.477 0.013 0.585 0.011 0.383 0.019 0.419 0.019 2.137 0.016 4679 0.383 0.029 0.590 0.020 0.391 0.033 0.481 0.031 1.903 0.036 3352 0.356 0.011 0.586 0.007 0.431 0.011 0.379 0.016 2.208 0.017 2535 0.320 0.017 0.542 0.010 0.394 0.015 0.413 0.017 2.031 0.016 3958 0.118 0.031 0.599 0.011 0.337 0.021 0.161 0.036 2.149 0.014 2776 0.321 0.026 0.603 0.015 0.377 0.027 0.329 0.034 2.084 0.014 0144 0.283 0.013 0.597 0.006 0.437 0.010 0.432 0.011 2.283 0.005 0282 0.254 0.017 0.610 0.008 0.412 0.014 0.400 0.016 2.366 0.006 0756 0.348 0.013 0.500 0.009 0.376 0.015 0.352 0.018 2.084 0.006 1176 0.351 0.011 0.548 0.007 0.413 0.012 0.382 0.014 2.146 0.004 1990 0.127 0.023 0.668 0.007 0.412 0.016 0.433 0.018 2.267 0.011 5279 0.245 0.023 0.616 0.010 0.405 0.019 0.430 0.020 2.340 0.012 5568 0.218 0.052 0.634 0.019 0.379 0.039 0.406 0.042 2.296 0.020 5975 0.269 0.022 0.572 0.012 0.432 0.018 0.420 0.021 2.215 0.013
Appendix B Stellar parameters
| GMP Nr. | age | dage | H | dH | d | |
| [Gyr] | [Gyr] | |||||
| 3329 | 2.2 | 0.1 | 0.77 | 0.04 | 0.37 | 0.01 |
| 2921 | 2.6 | 0.2 | 0.75 | 0.05 | 0.42 | 0.02 |
| 4928 | 14.5 | 1.4 | 0.15 | 0.05 | 0.28 | 0.03 |
| 4822 | 11.2 | 1.3 | 0.21 | 0.06 | 0.16 | 0.03 |
| 1750 | 11.3 | 1.7 | 0.28 | 0.08 | 0.33 | 0.03 |
| 2390 | 13.2 | 2.0 | 0.26 | 0.08 | 0.36 | 0.03 |
| 2795 | 9.6 | 1.3 | 0.11 | 0.06 | 0.25 | 0.03 |
| 3792 | 13.4 | 2.1 | 0.31 | 0.07 | 0.33 | 0.03 |
| 2629 | 8.7 | 1.5 | 0.12 | 0.07 | 0.14 | 0.03 |
| 3561 | 2.0 | 0.15 | 0.854 | 0.163 | 0.287 | 0.04 |
| 2000 | 8.6 | 1.3 | 0.18 | 0.06 | 0.24 | 0.03 |
| 2413 | 7.3 | 1.6 | 0.10 | 0.06 | 0.21 | 0.03 |
| 4829 | 7.9 | 1.9 | 0.37 | 0.06 | 0.27 | 0.03 |
| 3510 | 14.2 | 1.6 | 0.19 | 0.06 | 0.22 | 0.03 |
| 2417 | 11.5 | 2.4 | 0.10 | 0.10 | 0.27 | 0.05 |
| 2440 | 13.5 | 2.1 | 0.13 | 0.08 | 0.24 | 0.04 |
| 3414 | 11.2 | 2.7 | 0.07 | 0.12 | 0.23 | 0.07 |
| 4315 | 12.2 | 1.7 | 0.04 | 0.08 | 0.24 | 0.05 |
| 3073 | 10.5 | 1.5 | 0.19 | 0.07 | 0.17 | 0.04 |
| 1853 | 10.1 | 2.9 | 0.16 | 0.12 | 0.15 | 0.06 |
| 3201 | 2.5 | 1.1 | 0.22 | 0.24 | 0.45 | 0.13 |
| 3661 | 2.0 | 0.2 | 0.59 | 0.14 | 0.25 | 0.05 |
| 4679 | 2.1 | 0.3 | 0.20 | 0.06 | 0.14 | 0.04 |
| 3352 | 3.4 | 0.5 | 0.32 | 0.08 | 0.20 | 0.04 |
| 2535 | 2.3 | 0.5 | 0.41 | 0.09 | 0.14 | 0.03 |
| 3958 | ||||||
| 2776 | 11.8 | 2.3 | -0.10 | 0.06 | 0.28 | 0.09 |
| 0144 | 5.8 | 0.5 | 0.34 | 0.02 | 0.20 | 0.01 |
| 0282 | 7.7 | 0.8 | 0.26 | 0.04 | 0.30 | 0.02 |
| 0756 | 3.1 | 0.2 | 0.24 | 0.03 | 0.20 | 0.02 |
| 1176 | 3.3 | 0.4 | 0.26 | 0.04 | 0.19 | 0.02 |
| 1990 | 17.0 | 1.2 | 0.05 | 0.33 | 0.04 | |
| 5279 | 10.9 | 0.8 | 0.25 | 0.05 | 0.27 | 0.03 |
| 5568 | 9.6 | 0.6 | 0.25 | 0.04 | 0.30 | 0.02 |
| 5975 | 5.7 | 1.2 | 0.27 | 0.09 | 0.22 | 0.05 |
| GMP | age | dage | H | dH | d | |
|---|---|---|---|---|---|---|
| Nr. | [Gyr] | [Gyr] | ||||
| 3329 | ||||||
| 2921 | ||||||
| 4928 | ||||||
| 4822 | ||||||
| 1750 | ||||||
| 2390 | ||||||
| 2795 | ||||||
| 3792 | ||||||
| 2629 | ||||||
| 3561 | ||||||
| 2000 | ||||||
| 2413 | ||||||
| 4829 | ||||||
| 3510 | ||||||
| 2417 | ||||||
| 2440 | ||||||
| 3414 | ||||||
| 4315 | ||||||
| 3073 | ||||||
| 1853 | ||||||
| 3201 | ||||||
| 3661 | ||||||
| 4679 | ||||||
| 3352 | ||||||
| 2535 | ||||||
| 3958 | ||||||
| 2776 | ||||||
| 0144 | ||||||
| 0282 | ||||||
| 0756 | ||||||
| 1176 | ||||||
| 1990 | ||||||
| 5279 | ||||||
| 5568 | ||||||
| 5975 |