The X-ray nebula around the Seyfert 2 galaxy NGC4388
Abstract
We report on X-ray emission from the Seyfert 2 galaxy NGC4388 observed with the Chandra X-ray Observatory. A hard X-ray peak is found at the position of the active nucleus suggested by optical and radio observations. Extended soft X-ray emission correlates well with the ionization cone found in optical line emission. A large soft X-ray extension is found up to 16 kpc (and possibly 30 kpc) to the north of the galaxy. Photoionized gas with low ionization parameters (log 0.4) appears to be the likely explanation of this emission. The same ionized gas clouds could be responsible for the optical [OIII] emission. Fe K line emission from cold material is found to be extended by a few kpc.
keywords:
Galaxies: individual: NGC4388 — galaxies: ISM — X-rays: galaxies1 introduction
NGC4388 () is a nearly edge-on () spiral galaxy hosting a Seyfert 2 nucleus (Phillips & Malin 1982; Filippenko & Sargent 1985), located near the core of the Virgo cluster. The recession velocity measured for this galaxy (2540 km s-1) is much higher than the cluster mean velocity (1100 km s-1). This suggests that the galaxy is moving away from us through the intracluster medium (ICM) at a supersonic speed, and an interaction between the galaxy and ICM has been suspected, particularly in the context of ram-pressure stripping of the interstellar medium (Chamaraux et al 1980; Giovanelli & Haynes 1983; Kenney & Young 1986; Petitjean & Durret 1993; Veilleux et al 1999).
Radio images show a compact double central source and a plume extending to the north (Stone, Wilson & Ward 1988; Hummel & Saikia 1991; Falcke, Wilson & Simpson 1998). No broad emission component was found in optical spectropolarimetric observations of the nucleus (Kay 1994). However, the somewhat controversial detection of off-nuclear broad H emission by Shields & Filippenko (1988) led to the idea of an obscured Seyfert 1 nucleus in NGC4388. Unambiguous confirmation of the hypothesis came from hard X-ray observations by which a strongly absorbed ( cm-2) X-ray source has been detected (Hanson et al 1990; Iwasawa et al 1997; Forster, Leighly & Kay 1999; Bassani et al 1999).
The presence of extended optical emission-line nebulae in NGC4388 has been known for a few decades (Ford et al 1971; Sandage 1978; Colina et al 1987; Pogge 1988; Corbin, Baldwin & Wilson 1988; Veilleux et al 1999; Yoshida et al 2001). Besides the low excitation optical emission extending along the galaxy disk, which probably traces active star forming regions, the high excitation extended emission above the galactic plane has been of great interest in connection with its kinematics and ionization mechanism. Until recently, the extraplanar ionized gas was known to extend up to 4 kpc from the nucleus, but the wide-field images obtained from the SUBARU SuprimeCam show optical filaments extending up to 35 kpc to the north-east (Yoshida et al 2001). Studies of the excitation conditions in this extraplanar nebula suggest that it is likely to be photoionized by the central active nucleus, although some contribution by shock excitation has been claimed recently (Ciroi et al 2003). The required ionizing luminosity is estimated to be of the order of erg s-1(Colina 1992; Kinney et al 1991; Yoshida et al 2001).
The soft X-ray emission of NGC4388 was first shown to be extended from a ROSAT HRI observation (Matt et al 1994). However, the details of the extended X-ray emission and its origin have been unclear. In this paper, we present an imaging observation with the Chandra X-ray Observatory (Weisskopf et al 2000), which reveals the detailed morphology of the extended X-ray nebula and spectral variations across the nebula, as well as the active nucleus seen in hard X-rays. The distance of the galaxy is assumed to be 16.7 Mpc throughout this paper. The angular scale is then pc arcsec-1 (or 12 arcsec corresponding to 1 kpc).
2 Observation and data reduction
NGC4388 was observed with the Chandra ACIS detectors on 2001 June 8. The nucleus of the galaxy was positioned on the ACIS-S3 detector. The focal plane temperature for this observation was C. The data reduction was carried out using the CIAO 2.2 package and calibration files in CALDB version 2.10.
The data at the position of the nucleus of NGC4388 are affected by photon pile-up (the estimated pile-up fraction is about 10 per cent). The detector background of ACIS-S3 during this observation was relatively stable. The analysis for the emission at small radii was performed using the data of the full exposure of 20 ks. However, for extended emission found at larger radii, we filtered the event file using the 2.5–7 keV light curve from a source-free region on the S3 chip. Data taken in periods when the background counts deviate by more than 20 per cent from the mean value have been discarded, which results in an exposure time of 14 ks for analysis. The spectral analysis was performed using XSPEC version 11. The time dependent degradation of the ACIS sensitivity at low energies have been corrected with acisabs by Chartas & Getman.
The total background-corrected observed fluxes are estimated to be erg cm-2 s-1 in the 0.5–2 keV band, and erg cm-2 s-1 in the 2–7 keV band.
3 Active nucleus
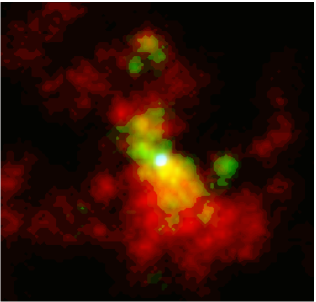
The composite X-ray image of the central part of NGC4388, produced from the three energy bands, 0.3–1 keV,
1–3 keV and 4–7 keV, is shown in Fig. 1. The active nucleus is located at the position of the hard X-ray peak indicated in blue. The soft X-ray emission shows complex morphology. Particularly bright is a conical feature to the south. These soft X-ray features are discussed in detail in the following section.
3.1 The hard X-ray nucleus

The active nucleus of NGC4388 is very faint below 4 keV in the Chandra image and not visible below 1 keV, due to obscuration probably associated with gas in the edge-on stellar disk.
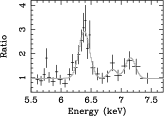
Strong emission is seen at energies above 4 keV. Its spectral shape is consistent with a strongly absorbed source (Fig. 2). The spectrum presented in Fig. 2 was taken from within 1.5 arcsec radius of the hard X-ray peak. It can be broadly described as having a heavily absorbed power-law above 3 keV with Fe K line features at 6.4 and near 7 keV and a flat component at low energies. As mentioned in Section 2, the nucleus is so bright that the data were affected by moderate photon pile-up (estimated to be per cent). The main consequences of the photon pile-up are a hardening of the spectrum and a reduction in the detected flux. We correct for these effects using the pile-up model of Davis (2001).
The absorption column density is found to be cm-2(hereafter quoted errors are for a 90 per cent confidence range for one parameter of interest, unless stated otherwise), when the photon index of the power-law continuum is assumed to be 1.8 and a simple absorbed power-law is fitted to the 4–7.8 keV data. A deep Fe K photoelectric absorption edge seen above 7.1 keV is consistent with the large absorption column density.
A strong Fe K line is found at an energy of keV (hereafter quoted line energies are corrected for the galaxy redshift) with an equivalent width of eV. The line flux is ph s-1 cm-2. This line is unresolved and the 90 per cent upper limit of the line width is FWHM km s-1. There is also an excess peak at keV with eV, and a less significant peak at keV with eV (90 per cent confidence detection). The estimated line fluxes for these lines are and ph s-1 cm-2, respectively. Given the low pile-up fraction, these weak emission features (at least the statistically robust one at 7 keV) are unlikely to be artifacts of pile-up. A similar feature was detected at keV in the ASCA SIS spectrum. Fe K emission is predicted to be three times weaker than the observed value. It could be blended with FeXXVI K at 6.97 keV from a highly ionized medium. A similar K line from hydrogen-like iron has been detected in the XMM-Newton spectrum of the Seyfert 2 galaxy Mrk463 (Sanders et al 2003 in prep.). The presence of such a highly ionized Fe line is consistent with the high ionization gas (log ) hypothesized in the following section.
Extrapolating the absorbed power-law leaves a faint excess below 4 keV. The spectrum is nearly flat in the 0.5–2 keV band. This component is probably scattered light of the hidden active nucleus. As the soft X-ray image shows, the nucleus is very faint below 1 keV, suggesting further obscuration to the scattering region, in addition to the primary obscuration of the central source occuring probably at much smaller radii.
The observed fluxes (corrected for pile-up) in the 0.5–2 keV and 2–7 keV bands are erg cm-2 s-1 and erg cm-2 s-1, respectively. The estimated absorption-corrected 2–10 keV luminosity, excluding the iron line luminosity, is erg s-1. This value is lower than the two previous ASCA observations in 1993 and 1995 (Iwasawa et al 1997; Forster et al 1999) by a factor of 2–3.
3.2 Position of the active nucleus
The obscuration of the nuclear region affects the measurements of the position of the optical nucleus of this galaxy. The northern blob of the central double radio source has been considered to be the active nucleus, since it has a flat spectrum (Carral, Turner & Ho 1990). The best registration of the radio and optical images obtained so far is the one by Falcke et al (1998, see the paper for detailed discussion) for the VLA and HST data. The positions of the HST red peak and the northern blob in the VLA 3.5 cm map are in agreement to within 0.45 arcsec. Our 4–7 keV image shows a strong point-like source with a faint envelope. In this energy band, the nucleus is largely free of obscuration and its position should coincide with the active nucleus. We have applied the latest aspect correction using the alignment files released in 2002 May by the Chandra Science Center. With this aspect correction, the expected absolute positional accuracy is smaller than 0.6 arcsec. Our 4–7 keV peak is located at R.A. = , Dec. = (J2000), which is arcsec NE of the VLA radio nucleus. Given the uncertainties, the optical, radio and the X-ray positions are all in agreement.
4 Soft X-ray nebula
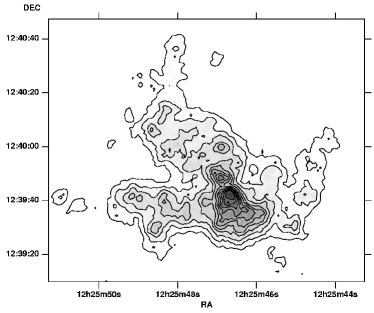
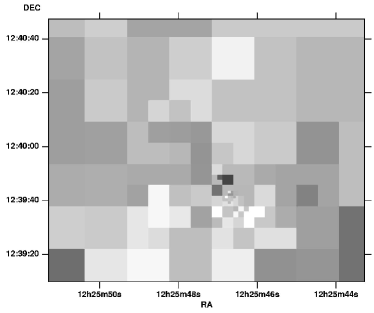
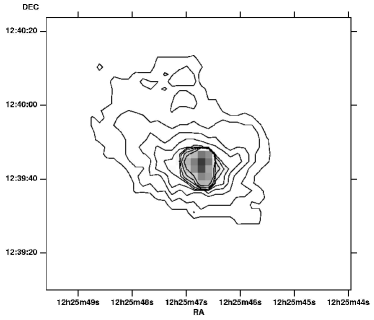
The soft X-ray emission is spatially extended and shows interesting morphology. The 0.3–1 keV image of the central , or kpc is shown, along with the X-ray colour map (0.7–1 keV / 0.4–0.7 keV) in Fig. 3. Some regions of interest are investigated separately below. Basic data for these regions are summarized in Table 1.
4.1 Southern cone
The soft X-ray (0.3–1 keV) image shows a well-defined conical extension to the south (Fig. 1, Fig. 3a), resembling the [OIII] ionization cone (Pogge 1988; Falcke et al 1998; Veilleux et al 1999; Yoshida et al 2001). The western side of the soft X-ray cone, in particular, has a sharp, straight boundary at . Its apex is, however, slightly north of the hard X-ray peak. With the apex of the cone slightly displaced from the nuclear position (0.5 arcsec to the east, 2.5 arcsec to the north) when extrapolated with the rims of the cone, the opening angle of the X-ray cone is measured to be .
The surface brightness of the soft X-ray emission drops at the centre due to strong absorption, whilst at radii from the nucleus larger than 2 arcsec, where the brightness peaks, its profile shows an exponential decline (, where is the radial distance from the hard X-ray nucleus in arcsec). An alternative description is with a King profile with a core radius of 5.7 arcsec (or 460 pc) and a slope index of . In either case, the soft X-ray emission reaches the background level at radii of 20–25 arcsec (1.6–2 kpc), and there appears to be no further emission at larger radii to the south (in contrast to the northerly direction; see the following section).
The ACIS-S spectrum of the southern cone is shown in Fig. 4. The spectral data were taken from a conical region in the radial range of 1.5–19 arcsec from the nucleus. The spectrum is dominated by soft X-ray emission below 3 keV.
Although the steep rise of the soft X-ray spectrum down to 0.5 keV can be approximated by a power-law form with photon index of , the most likely explanation for the soft X-ray emission is a blend of strong emission lines. Modelling by thermal emission spectra (from collisionally ionized plasma, e.g., MEKAL, Kaastra 1992) is not favoured on the following grounds. If the observed X-ray emission is due to collisionally ionized plasma, a likely origin is a galactic outflow driven by a nuclear starburst. Circumstantial evidence against this hypothesis is that, although star formation is taking place in the spiral arms of the stellar disk (Pogge 1988), there is no strong evidence for a compact nuclear starburst in NGC4388. To drive a well-collimated outflow, as seen in the southern cone, a compact starburst region needs to be thermalized to form a high pressure core (e.g., Chevalier & Clegg 1985), which does not appear to be the case in NGC4388.
Spectral analysis does not support the thermal emission hypothesis either. A single temperature model fails to explain the strong OVII emission lines at 0.56 keV, even with non-solar abundance ratio. Strong OVII is emitted from keV gas if it is collisionally ionized. Since this low temperature gas does not emit much above 0.7 keV, a higher temperature gas is required to explain the data. A two-temperature model in which one component has a fixed temperature of keV and the other has a fitted temperature of keV gives a reasonable fit to the data up to 1.5 keV with for 39 degrees of freedom. This fit, however, underestimates the Mg emission feature at 1.3 keV by a factor of 2, and the Si feature at 1.8 keV by a factor of 4, on extrapolation. This modelling also has two significant problems: 1) the metallicity, which is assumed to be identical between the two components, is very low, solar. This is not consistent with the gas which should have been enriched by supernovae through a starburst; 2) large internal absorption of cm-2 is required. With the Galactic dust-to-gas ratio, this implies visual extinction of mag. Unlike the northern extension (see Section 4.2), the southern cone is located well outside the obscuration and such a large extinction is unlikely to be present (even the nuclear optical spectrum taken from inner radii shows a smaller reddening , Petitjean & Durret 1993).
We therefore explore the possibility of photoionized plasma, as postulated for the optical ionization cone. In terms of quality of the fit to the data, the photoionization model described below gives a better fit to the data in the same energy range (0.4–1.5 keV) with for 40 degrees of freedom.
High resolution X-ray spectra of photoionized gas in Seyfert 2 galaxies obtained from grating spectrometers show many emission features from a broad range of ionization in the soft X-ray band (e.g., see Kinkhabwala et al 2002; Brinkman et al 2002 for XMM-Newton RGS and Chandra LETGS data, respectively, of NGC1068; Sako et al 2000 for Mrk 3). These emission lines are heavily blended together and mostly difficult to resolve at the spectral resolution of the CCD. This heavy line blending also makes an estimate of the underlying continuum difficult in a CCD spectrum, if it is present at all. Therefore, we will not perform a detailed analysis here as one would accomplish with a high resolution grating spectrum, but instead only describe some key features characterizing the observed spectrum and present a possible model, which should be treated as a guide only.
A few of the strongest emission-line peaks can be recognized in the data at 0.56, 0.86, 1.33, 1.77 and 2.33 keV, for which the typical error in the line centroids is 0.04 keV and the significance of the detection is larger than 90 per cent confidence level. These correspond to the OVII triplet, a blend of various Fe L emission, OVIII Radiative Recombination Continuum (RRC) and NeIX (0.92 keV), and low ionization (IV–VIII; for the ionization parameter inferred below) lines of Mg, Si and S, respectively. These are all low ionization features, and the 0.4–0.9 keV data and the three discrete emission-lines above 1 keV are explained well with emission from optically thin gas with log (here, we compare with model spectra generated by XSTAR version 2.1 by T. Kallman, see Kallman & Bautista 2001, for optically thin gas, illuminated by a power-law continuum between 13.6 eV and 50 keV with a photon-index of 1.8. The ionization parameter is defined as erg cm s-1, where is the 1–1000 Ryd luminosity, is the density and is the distance from the ionizing source. XSTAR calculates physical conditions for a spherical gas shell by solving radiative transfer. The quoted value for is for the inner edge of the shell. Therefore the calculated spectra include emission from a range of lower than the quoted value from outer radii). This fit requires no significant excess absorption by cold gas above the Galactic value ( cm-2, Dickey & Lockman 1990). The only significant residual below 0.9 keV is an excess at 0.65 keV, which could be OVIII Ly, indicating the presence of higher ionization gas.
The 0.9–3 keV data unexplained by the above emission, apart from the Mg, Si and S emission lines, may be emission and scattered continua from highly ionized, low density gas, as suggested by the excess OVIII at 0.65 keV. Unfortunately, there is no other significant detection of spectral signatures, which could be used to constrain the ionization parameter. If FeXXV at 6.7 keV, possibly present in the hard X-ray spectrum (see Section 5.1), is real and originates from the same medium as the OVIII emission, then the ionization parameter would be a few thousands. For example, the spectrum from high ionization gas with , when combined with the low ionization (log ) spectrum, can provide a reasonable fit to the 0.4–3 keV data (see Fig. 4). This high ionization spectrum has broader radiative recombination continua due to high temperature of the gas ( K), as well as high ionization lines, which could fill the continuum between the emission lines of low ionization spectrum. A possible alternative which would play the same role is the soft X-ray excess component of the reflection spectrum, which is seen in the hard X-ray band (see e.g., Ross, Fabian & Young 2000 for a computed reflection spectrum from mildly ionized matter). Further investigation is, however, beyond the capability of the present CCD spectrum.
In summary, low ionization (log ) photoionized gas appears to be a plausible explanation for prominent soft X-ray spectral features; Another component, which could be highly ionized (log ) gas, is required, although its origin is not clear. It should, however, be noted that this two-component photoionization model is only an approximation required to describe the spectrum at the CCD resolution with limited signal-to-noise ratio, from which only a few strong emission features can be recognized. Emission features from photoionized gas with a broad range of ionization parameter are likely to be present and would be detected in a high resolution spectrum.
There are significant spectral changes within the southern cone (see Fig. 3b). Spectra from radial ranges of 1.5–7 arcsec (0.1–0.6 kpc) and 7–19 arcsec (0.6–1.5 kpc) are compared (cf. the [OIII]/H maximum occurs at 3 arcsec from the nucleus, Falcke et al 1998; Veilleux et al 1999). At the low energy end, the spectrum from the larger radii is slightly softer than that from the inner part. The spectral softening at larger radii can be explained by a slight increase in ionization parameter for the low ionization gas, or a decrease in absorption, or both. In the second case, with a constant ionization parameter of log , a marginal excess absorption ( cm-2) above the Galactic value is found for the inner part while no excess absorption is required for the outer part.

4.2 Northern extension within 1 kpc


In contrast to the southern extension, the inner part on the north side of the nucleus (within arcsec, or 1.2 kpc) is faint in the soft X-ray (0.3–1 keV) band. However, the appearance of the image changes dramatically in the higher energies. In the 1–2 keV band, the northern and southern extensions show comparable brightness, apart from at very inner radii (Fig. 5). This is also demonstrated by radial profiles in the two energy bands (Fig. 6).
This change in appearance of the X-ray image can be understood as a result of obscuration toward the northern extension (and the nucleus). The soft X-ray spectrum taken from the radial range of 3–11 arcsec (0.2–0.9 kpc) to the north of the nucleus is shown as “N plume” in Fig. 4. In comparison with the southern cone spectrum, the soft X-ray excess below 0.9 keV is much less pronounced, and the low ionization emission lines from Mg and Si in the 1–2 keV range are stronger relative to the emission complex at lower energies. The data can be modelled by the same combination of low and high ionization gases as used for the southern cone spectrum (see Section 4.1) but with a larger absorption column density of = cm-2(the model is shown in solid histogram together with the data in Fig. 4). Combining with the radial surface brightness profiles in Fig. 6, it can be argued that, in the absence of absorption, the nebulae to the north and south would share similar brightnesses and possibly ionization conditions.
NGC4388 is viewed nearly edge-on, with the near side of the stellar disk being tilted upward by (see Fig. 5 of Veilleux et al 1999). This enables us to have a clear view of the SW cone. On the other hand, the tilted near side of the disk blocks our line of sight towards the northern extension, suppressing low energy X-ray emission through photoelectric absorption. Probably we see the northern extended X-ray emission through the stellar disk for which the inferred column density appears to be reasonable.
There are a few morphological and spectral features to note on the northern extension: the 1–2 keV image (Fig. 5) shows that a relatively narrow bright filament emanates from the nucleus at before bending northwards at arcsec from the nucleus, past which point the filament opens up, similar to the radio plume imaged with the VLA (Falcke et al 1998).
4.3 Lower surface brightness emission within 4 kpc
Besides the bright southern cone and the northern extension at small radii, lower surface brightness soft X-ray emission is seen in the radial range of 1–4 kpc from the nucleus. The extension is to the east along the stellar disk, to the west with a bent morphology, and to the north-east, as shown in Fig. 3a. Although there is possible evidence for spectral variations across the low surface brightness emission (Fig. 3b), limited statistics due to the short exposure of our observation prevent us from dividing the low surface brightness emission into multiple regions and analysing their spectra separately. The soft X-ray spectrum integrated over this region is shown in Fig. 4 as “LSB”.
Although, as cautioned above, the photoionization model should be taken as only a guide, the spectrum favours a higher ionization parameter of log for the low ionization gas than that for the southern cone. A large absorption of cm-2 is required. It should also be noted that the emission extended along the stellar disk might be different in origin. As the optical H image and the excitation map (Corbin et al 1988; Veilleux et al 1999; Yoshida et al 2001) show, this region is the site of intense star formation in the spiral arms, and the soft X-ray emission could originate in thermal hot gas with a temperature of a few million K. The spectrum there lacks the strong OVII feature at 0.55 keV, but the quality of the present data cannot provide a clear answer to the question of whether the gas is collisionally- or photo-ionized.
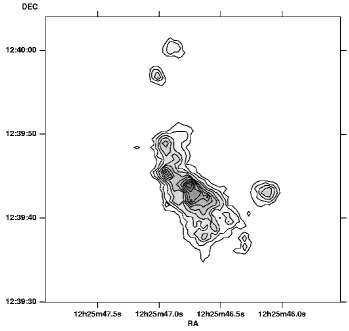
To the north-east, the soft X-ray image shows three shell-like structures, aligned parallel to each other with an approximate separation of 10 arcsec, or 0.8 kpc (Fig. 7). They are located in the radial range of 14–40 arcsec (1.1–3.2 kpc) from the nucleus at PA, and coincide with the location of the [OIII] north-east complex (e.g., Veilleux et al 1999). The colour map (Fig. 3b) shows that the three-shell region has a harder spectrum than the surroundings. In fact, the shell structure is clearer in the 0.7–1 keV image than in the 0.4–0.7 keV image.

4.4 Northern extension beyond 4 kpc
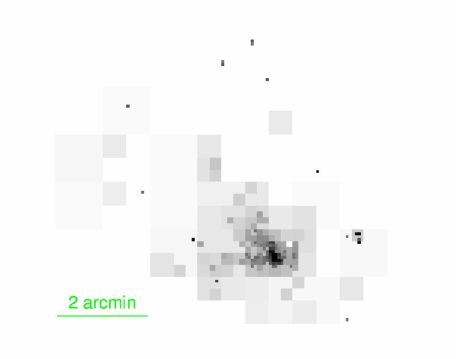
The large-scale image in the 0.3–2.5 keV band is shown in Fig. 8. The original image was produced from the entire ACIS-S3 chip with 5 arcsec binning. In this energy band, the Virgo cluster emission is significant. The background obtained from a source-free region on the same detector was assumed to be constant over the field. After subtracting the background, the image has been adaptively binned so that each pixel has a signal-to-noise ratio larger than 2.5.
Very low surface brightness emission extends to the north-east beyond the region shown in Fig. 3. There is a low sensitivity belt on the detector due to the CCD node boundary, which extends in at around 1.8 arcmin ( kpc) from the nucleus. Including this sensitivity gap, extended emission with significance above reaches 3.3 arcmin ( kpc) from the nucleus. It coincides with the region where emission-line filaments are seen in both the H and [OIII] images taken by the SUBARU Suprime-Cam (Yoshida et al 2001).
The radial surface brightness profile of the 0.3–2.5 keV emission to the north-east (in the P.A. range between and ) can be fit well with a power-law (; in kpc) with . A fainter excess is seen further out at PA, 4 arcmin (20 kpc) away from the nucleus, where there is a bright complex of H knots, which is a part of the SUBARU 35-kpc-long filament (Yoshida et al 2001). However, the significance of this X-ray excess is just above .
The spectrum taken from the region between 4 kpc and 9 kpc in radius is shown in Fig. 4 (as “NE VLSB”). No significant emission is detected above 2 keV. Two prominent emission lines from low ionization Mg and Si at 1.3 and 1.8 keV, respectively, are seen in the 1 – 2 keV range. The inferred ionization parameter is found to be slightly low at log with Galactic absorption.
| Region | Area | Count rate | ||
|---|---|---|---|---|
| arcmin2 | ct s-1 | erg cm-2 s-1 | erg cm-2 s-1 | |
| S cone | 0.062 | |||
| N plume ( kpc) | 0.021 | |||
| LSB (1–4 kpc) | 0.58 | |||
| VLSB NE (4–9 kpc) | 1.10 | — |
5 Hard X-ray emission
5.1 Circumnuclear hard X-ray emission


The 4–7 keV emission is highly concentrated around the nucleus (approximately 90 per cent of the total 4–7 keV flux comes from the central 2 arcsec in radius) but marginally resolved. The surface brightness distribution of the hard X-ray emission is found to be skewed slightly to the north at low brightness levels (see also the following subsection on the Fe K emission). Although the asymmetry suggests that the extension is real, since the point spread function (PSF) of the Chandra optics (HRMA) has a broad low-level wing at high energies, we have examined the radial distribution of the hard X-ray emission. Fig. 9 shows radial surface brightness profiles in the 4–7 keV band, taken from northern and southern regions divided at P.A. of 80∘ and 255∘ to compare with the PSF (NB. the northern region overlaps the southern cone slightly at its inner western edge). We note that the photon pile-up at the nucleus results in a slightly diluted core. The innermost bins of the two observed profiles have been increased by 10 per cent as an approximate correction for pile-up.
A PSF was simulated at the monochromatic energy of 6.4 keV for the same position on the detector as that of the hard X-ray nucleus, using the standard PSF library in CIAO. The total hard X-ray spectrum peaks at the Fe K band (6.1–6.6 keV), which carries per cent of the observed 4–7 keV counts. Because the off-axis angle of the source is small (0.65 arcmin) and 6.4 keV is close to the higher end of the bandpass, the simulated PSF can be regarded as a conservative estimate of the PSF for the 4–7 keV emission. While the radial profile for the southern half is consistent with the PSF, the northern half shows significant excess emission above the PSF but reaches the background level at around 30 arcsec ( kpc).
The origin of the extended hard X-ray emission is probably some form of reflection of the hidden active nucleus, as suggested by the hard spectrum (Fig. 10). This appears to be true, at least, for the spectrum of the low surface brightness emission region which shows a strong Fe K line at keV with keV. A similar picture is consistent with the noisy spectrum of the inner northern plume, which barely shows evidence for an Fe K line with eV. This cold reflection could contribute to low ionization lines at lower energies (e.g., 2–4 keV band), depending on the ionization state and obscuration to the reflecting medium. The reflecting medium could be molecular clouds distributed in the stellar disk (recall the Sgr B2 clouds near our Galactic centre, which is located 100 pc away from the Sgr A⋆, e.g., Koyama et al 1996). If ram-pressure stripping of the gas in the host galaxy is taking place (e.g., Petitjean & Durret 1993; Cayatte et al 1994; Veilleux et al 1999) and the stripped gas forms sufficient column density to the central source, it would also work as an X-ray reflector, albeit ram-pressure stripping is not expected to be effcient near the centre of a galaxy.
Much of the hard X-ray tail in the southern cone spectrum could be accounted for by the faint wing of the PSF for the nuclear source, although a faint extension is present at the inner part of the western edge of the cone, on inspecting the 4–7 keV image. The hard X-ray spectrum lacks a strong Fe K emission line (Fig. 10). The 90 per cent upper limit on the EW of a narrow line at 6.4 keV is still consistent with the spectral shape of the nuclear source (Section 3.1). A higher energy line, e.g., at 6.7 keV, appears to be more favoured by the data (in this case, the EW could be around 800 eV), although the significance of the line is sensitive to the assumed underlying continuum. This line may arise from the high ionization gas (log ) in agreement with the soft X-ray emission (Section 4.1).
5.2 Extended Fe K emission
The Fe K emitting region is spatially resolved in the Chandra image. A narrow-band (6.2–6.5 keV) image centred on cold iron K emission is shown in Fig. 11. While much of the line emission arises from the nuclear region, the image of the low surface-brightness emission shows ridges extending to the north-east and north-west. A faint extension appears to be present to the north up to 30 arcsec (2.5 kpc). The reality of this extended line emission is supported by the hard X-ray emission with an asymmetric extension examined in the previous subsection (Fig. 9) and the spectrum of the low surface brightness region (LSB in Fig. 10) which shows a strong Fe K line with EW much larger than that of the nuclear spectrum. The energy of the line centroid ( keV) of the LSB spectrum implies that the line emission originates in low ionization gas. The extension of the line emission is in rough agreement with the photoionized gas traced by soft X-ray emission, although any detailed correlation between the two emission components is unclear due to the low signal to noise ratio of the Fe K emission data.
The 6.4 keV Fe K line is a reliable indicator of cold gas, and could trace the history of nuclear activity by mapping the iron line emission (Fabian 1977). The extension of the line emission implies that the central source was turned on at least ten thousands years ago. More details could be obtained from a deeper observation.
6 discussion
The soft X-ray image shows clear bi-conical extended emission, bearing a strong resemblance to the optical [OIII] ionization cone. The faintness of the northern cone is probably due to the effect of shadowing by the stellar disk on the near side (see Section 4.2). The spatial correlation between the soft X-ray and optical line emission, which was not found in the much lower signal-to-noise image taken by the ROSAT HRI (Matt et al 1994), suggests a common mechanism working for the creation of the extended nebula. As discussed in Section 4.1, the extended X-ray emission in NGC4388 is unlikely to be thermal (collisionally ionized) emission from a shock-heated medium, as previously thought (however, Netzer, Turner & George 1998 explained the ASCA spectrum with a photoionization model). Convincing evidence for photoionized gas that is responsible for the soft X-ray emission in other Seyfert 2 galaxies has been obtained from high resolution spectroscopy with the XMM-Newton RGS and the Chandra LETG (Kinkhabwala et al 2002; Brinkman et al 2002; Ogle et al 2000; Sako et al 2000; see also Young, Wilson & Shopbell 2001). This also seems to be the case for the X-ray nebula around NGC4388.
The strong OVII emission, together with the other low energy X-ray emission features, found in the spectrum of the southern cone suggests that photoionized gas with a low ionization parameter (log ) dominates the bright soft X-ray emission. With the inferred low ionization, the same gas could explain the optical [OIII] luminosity, since photoionization codes predict the luminosity ratio of [OIII] to OVII (0.55 keV) to be for the ionizing spectrum we assumed (this value is from XSTAR). Given the rough power-law approximation to the shape of the ionizing spectrum for the photoionization calculation and various uncertainties, including the aperture difference and varying absorption/extinction across the region, which complicate any direct comparison, the observed line flux ratio (erg cm-2 s-1 for [OIII] measured with a aperture by Falcke et al (1998); erg cm-2 s-1 for OVII measured only from the southern cone) is in a rough agreement with the prediction. Recall that the quoted above is for the inner edge of a photoionized gas shell in the calculation of XSTAR (see Section 4.1), and the ionization parameter varies across the gas: OVII peaks near the inner edge while OIII peaks at outer radii where is lower but the radial emissivity of the two have a significant overlap.
In the southern cone, a comparison between the spectra of the inner and outer parts suggests the ionization parameter is approximately constant with radius (Section 4.1). This implies that the radial density profile follows . Since the temperature (a few K here) should hold for gas with the same ionization parameter, the pressure profile is also proportional to the inverse square of the radius, which is consistent with gas expanding at constant velocity, ejected matter from the active nucleus, for instance.
If the X-ray nebula around NGC4388 is indeed photoionized gas, as we demonstrated, its size of over 10 kpc is larger than other photoionized nebulae known around nearby Seyfert galaxies. High resolution X-ray spectroscopy is desirable to confirm the photoionization nature. The large extent of the X-ray emission would make a Chandra grating observation difficlt. An observation with the XMM-Newton RGS may still be possible, given the broader PSF of the XMM-Newton telescopes. Note, however, such a grating observation will lose information on the spatial variation of gas properties, as we see in the Chandra data.
Large scale X-ray nebulae with the size up to a few tens kpc, which are often associated with H emission (e.g., Heckman et al 1996; Lira et al 2002), are usually attributed to thermal emission heated by starburst-driven winds (e.g., Lehnert, Heckman & Weaver 1999; Gallagher et al 2002; Done et al 2003). However, at least in the presence of an active nucleus, the possibility of photoionized gas as a source of an extended X-ray nebula should be considered, especially when there is a correlation with high ionization optical emission gas such as [OIII], as seen in NGC4388.
While the radial extent of the southern cone is limited, the question arises why the extension of the gas to the north is so much larger in both optical line and X-rays. Various possibilities for the origin of this gas have been proposed: ram-pressure stripping of the interstellar medium (Petitjean & Durret 1993; Veilleux et al 1999), debris of a small accreted galaxy (Yoshida et al 2001), and a starburst-driven superwind (e.g., Corbin et al 1988). The last possibility is not favoured because the X-ray spectrum is not thermal (see also Veilleux et al 1999; Vollmer & Huchtmeier 2003). The extended cold iron K emission rather favours a photoionization model. The narrow filaments of a few tens of kpc length, imaged by SUBARU, are certainly suggestive of the merger debris hypothesis. They are reminiscent of the tidal tails often observed in a major merger system, e.g., in HI. Of course, the unusual environment particular to NGC4388, residing in the cluster core and moving at high velocity in it, may play an important role in causing the long one-sided matter distribution.
The radial surface-brightness profile of the soft X-ray emission suggests that the density profile to the north side of the galaxy is significantly flatter than that to the south. If the ionized gas in the northern extension is excited through photoionization by the active nucleus, then its luminosity is controlled by the amount of matter available for photoionization. If the ionization parameters obtained from the photoionization models of the various regions are used as a guide, the very low surface brightness region at large radii (4–9 kpc or NE VLSB; Section 4.4) appears to have a lower ionization parameter than the inner north plume (within 1 kpc; Section 4.2). The decrease in the ionization parameter indicates that the density profile is flatter than . Under a matter-bounded condition, the emissivity depends on the photoionization rate which is proportional to density. The observed power-law form of the soft X-ray surface-brightness profile (, Section 4.4) implies that the density profile to the north of the galaxy may have a similar form, if projection effects are not important, i.e., it has a shallow depth, for example, of a sheet-like structure, as expected for a narrow streak of stripped gas, or the debris/tidal tail of a galaxy merger.
The apparent high ionization condition found at intermediate radii (LSB; Section 4.3) is not explained by the above scenario. This could result from a different ionization condition, i.e., a different distribution function of ionization parameters, in the north-east “three-shell” region. Although the X-ray spectrum of that region alone is too noisy to be conclusive, the X-ray colour map (Fig. 3b) indicates that the shell region shows a harder spectrum than the surrounding area. The aligned shell-like structure resembles that in the optical ionization bi-cone of the Seyfert 2 galaxy NGC5252 (e.g., Tadhunter & Tsvetanov 1989; Acosta-Pulido et al 1996). It is also reminiscent of the X-ray bow structure found in the X-ray nebula around the Vela Pulsar (Pavlov et al 2001). These structures may be due to a density discontinuity created by shock (the shells in NGC5252 may be pre-existing HI rings). The harder spectrum of the shell region could be related to the shock-heated media, although increased absorption is an alternative explanation.
The radio images show that radio-emitting plasma extends to the north at large radii whereas the axes of the ionization bi-cone and bright radio emission lie along the NE-SW direction. Veilleux et al (1999) attributed this misalignment to buoyancy or refractive bending (note that the NE extraplanar ionized gas is moving towards us and the axis of the ionization cone is not perpendicular to the stellar disk). As we noted in Section 4.2, the major axis of the 1–3 keV (green colour in Fig. 1) or 1–2 keV (Fig. 5) emission, which is likely to trace the path of the nuclear radiation at inner radii (within 1 kpc), lies in the NE-SW direction. Its southern extension also match the well-defined edge of the western side of the southern soft X-ray/OIII cone. The fact that the eastern edge of the southern cone is more blurred suggests that some buoyancy effect might bring the ionised gas southwards, while the true axis of the nuclear radiation which escapes from the nuclear obscuring torus is indicated by the 1–3 keV elongation. In this case, although the apparent opening angle of the southern cone is about , the nuclear ionizing radiation could be more collimated. On the north side, both the 1–2 keV X-ray emitting gas and radio plasma point towards the NE at small radii and bend towards the north at arcsec from the nucleus.
NGC4388 is often believed to be interacting strongly with the Virgo ICM at supersonic speeds. A Mach cone formed on the far-side of the galaxy with an opening angle of has been proposed by Veilleux et al (1999). Some temperature rise in the bow-shocked region around the interaction point is expected above the surrounding ICM, which should have a temperature of keV. Unfortunately, we were unable to find such a bow-shocked region, mainly due to the presence of the extended ionized gas. The lack of evidence for strong interaction with the ICM leaves room for the hypothesis that NGC4388 could be more distant than the Virgo cluster and lies closer to at its Hubble distance for km s-1.
Finally, with regard to the unification scheme of the two types of Seyfert galaxies, if the nucleus of NGC4388 were viewed from a direction near the axis of the ionization cone, the central X-ray source would be seen through the low ionization gas (and possibly very high ionization gas). The column density of the low ionization gas could be of the order of cm-2, depending on the filling factor. Although the detailed X-ray grating spectra of bright Seyfert 1 galaxies, such as NGC3783 (Kaspi et al 2002), do not show clear evidence for such low ionization gas, it might be seen in other mildly-absorbed Seyfert nuclei.
Acknowledgements
XSTAR is maintained by Tim Kallman and his collaborators at Goddard Space Flight Center. ACF and KI thank Royal Society and PPARC, respectively, for support. This research was supported in part by NASA through grants NAG 81027 and NAG 81755 to the University of Maryland.
References
- [1] Acosta-Pulido J.A., Vila-Vilaró B., Pérez-Fournon I., Wilson A.S., Tsvetanov Z.I., 1996, ApJ, 464, 177
- [2] Bassani L., Dadina M., Maiolino R., Salvati M., Risaliti G., Della Ceca R., Matt G., Zamorani G., 1999, ApJS, 121, 473
- [3] Brinkman A.C., Kaastra J.S., van der Meer R.L.J., Kinkhabwala A., Behar E., Kahn S.M., Pearels F.B.S., Sako M., 2002, A& A, 396, 761
- [4] Carral P, Turner J.L. Ho P.T.P., 1990, ApJ, 362, 434
- [5] Cayatte V., Kotanyi C., Balkowski C., Kotanyi C., 1990, AJ, 100, 604
- [6] Chamaraux P. Balkowski C., Gérard E., 1980, A&A, 83, 5
- [7] Ciroi S., Contini M., Rafanelli P., Richter G.M., 2003, A& A, in press (astro-ph/03011110v1)
- [8] Colina L., Fricke K.J., Kollatschny W., Perryman M.A.C., 1987, A&A, 186, 39
- [9] Colina L., 1992, ApJ, 386, 59
- [10] Corbin M.R., Baldwin J.A., Wilson A.S., 1988, ApJ, 334, 584
- [11] Davis J.E., 2001, ApJ, 562, 575
- [12] Dickey J.M., Lockman F.J., 1990, ARAA, 28, 215
- [13] Done C., Madejski G.M., Życki P., Greenhill L.J., 2003, ApJ, in press
- [14] Fabian A.C., 1977, Nat, 269, 672
- [15] Falcke H., Wilson A.S., Simpson C., 1998, ApJ, 502, 199
- [16] Filippenko A.V., Sargent W.L.W., 1985, ApJ,S, 57, 503
- [17] Ford W.K., Rubin V.C., Roberts M.S., 1971, AJ, 76, 22
- [18] Forster K., Leighly K.M., Kay L.E., 1999, ApJ, 523, 521
- [19] Galagher S.C., Brandt W.N., Chartas G., Garmire G.P., Sambruna R.M., 2002, ApJ, 569, 655
- [20] Giovanelli R., Haynes M.P., 1983, AJ, 88, 881
- [21] Hanson C.G., Skinner G.K., Eyles C.J., Wilmore A.P., 1990, MNRAS, 242, 262
- [22] Heckman T.M., Dahlem M., Eales S.A., Fabbiano G., Weaver K.A., 1996, ApJ, 457, 616
- [23] Hummel E., Saikia D.J., 1991, A& A, 249, 43
- [24] Iwasawa K., Fabian A.C., Ueno S., Awaki H., Fukazawa Y., Matsushita K., Makishima K., 1997, MNRAS, 285, 683
- [25] Kaastra J.S., 1992, An X-Ray Spectral Code for Optically Thin Plasmas, Internal SRON-Leiden Report, updated version 2.0
- [26] Kallman T., Bautista M., 2001, ApJS, 133, 221
- [27] Kaspi S. et al, 2002, ApJ, 574, 643
- [28] Kay L.E., 1994, ApJ, 430, 196
- [29] Kenney J.D., Young, J.S., 1986, ApJ, 301, L13
- [30] Kinkhabwala A. et al, 2002, ApJ, 575, 732
- [31] Kinney A.L., Antonucci R.R.J., Ward M.J., Wilson A.S., Whittle M., ApJ, 377, 100
- [32] Koyama K., Maeda Y., Sonobe T., Takeshima T., Tanaka Y., Yamauchi S., 1996, PASJ, 48, 249
- [33] Lehnert M.D., Heckman T.M., Weaver K.A., 1999, ApJ, 523, 575
- [34] Lira P., Ward M.J., Zezas A.m Murray S.S., 2002, MNRAS, 333, 709
- [35] Matt G., Piro L., Antonelli L.A., Fink H.H., Meur E.J.,A., Perola G.C., 1994, A&A, 292, L13
- [36] Netzer H., Turner T.J., George I.M., 1998, ApJ, 504, 680
- [37] Ogle P.M., Marshall H.L., Lee J.C., Canizares C.R., 2000, ApJ, 545, L81
- [38] Pavlov G.G., Zavlin V.E., Sanwal D., Burwitz V., Garmire G.P., 2001, ApJ, 552, 129
- [39] Petitjean P., Durret F., 1993, A&A, 277, 365
- [40] Phillips M.M., Malin D.F., 1982, MNRAS, 199, 905
- [41] Pogge R.W., 1988, ApJ, 332, 702
- [42] Ross R.R., Fabian A.C., Young A.J., 1999, MNRAS, 306, 461
- [43] Sandage A., 1978, AJ, 83, 904
- [44] Shields J.C., Filippenko A.V., 1988, ApJ, 332, L55
- [45] Stone J.L., Wilson A.S., Ward M.J., 1988, ApJ, 330, 105
- [46] Sako M., Kahn S.M., Paerels F., Liedahl D.A., 2000, ApJ, 543, L115
- [47] Tadhunter C., Tsvetanov Z., 1989, Nat, 341, 422
- [48] Veilleux S., Bland-Hawthorn J., Cecil G., Tully R.B., Miller S.T., 1999, ApJ, 520, 111
- [49] Vollmer B, Huchtmeier W., 2003, A&A, in press (astro-ph/0304136)
- [50] Weisskopf M.C., Tananbaum H.D., Van Speybroeck L.P., O’Dell S.L., 2000, Proc SPIE, 4012, 2
- [51] Young A.J., Wilson A.S., Shopbell P.L., 2001, ApJ, 556, 6
- [52] Yoshida M., et al, 2001, ApJ, 567, 118
appendix
Detector-efficiency corrected versions of spectral data shown in Fig. 2, Fig. 4 and Fig. 10 are presented below. The count rate spetra have been divided by the effective area. The correction is independent of the fitted model but some uncertainty may have been introduced due to the detector resolution and data binning. The time-dependent efficiency degradation in the low energy range specific to the ACIS-S3 detector, which was taken into account by acisabs in the spectral analysis, has also been included.


