The puzzling dynamical status of the core of the globular cluster NGC 6752 111Based on observations with the NASA/ESA HST, obtained at the Space Telescope Science Institute, which is operated by AURA, Inc., under NASA contract NAS5-26555. Also based on WFI observations collected at the European Southern Observatory, La Silla, Chile, within the observing programmes 62.L-0354 and 64.L-0439.
Abstract
We have used high resolution WFPC2-HST and ground based Wide Field images to determine the center of gravity and construct an extended radial density and brightness profile of the cluster NGC 6752 including, for the first time, detailed star counts in the very inner region. The barycenter of the 9 innermost X-ray sources detected by Chandra is located only off the new center of gravity. Both the density and the brightness profile of the central region are best fitted by a double King model, suggesting that NGC 6752 is experiencing a post-core collapse “bounce”. Taking advantage from our new optical data, we discuss the puzzling nature of the accelerations displayed by the innermost millisecond pulsars detected in this cluster. We discuss two possible origins to the accelerations: 1) the overall cluster gravitational potential which would require a central projected mass to light ratio of order 6–7 and the existence of a few thousand solar masses of low-luminosity matter within the inner pc of NGC 6752; 2) the existence of a local perturber(s) of the pulsar dynamics, such as a recently proposed binary black hole of intermediate (100–) mass.
1 Introduction
Although NGC 6752 is one of the nearest clusters, there is no consensus in the literature on its dynamical status. It was initially classified as a post-core collapse (PCC) by Djorgovski & King (1986, hereafter DK86) and Auriere & Ortolani (1989, hereafter AO89). Later Lugger, Cohn & Grindlay (1995, hereafter LCG95) argued that the radial profile was not inconsistent with a King model. As part of a project devoted to the study the characteristics of globulars harboring millisecond pulsars (MSPs), we present a new determination of the center of gravity (§3) and of the star density profile (§4) of NGC 6752 both based on new high-resolution and wide-field observations. By coupling the superior resolution of HST with the imaging capability of the wide field camera (WFI) mounted at the 2.2m ESO-MPI telescope, we have obtained the most accurate and extended radial profile ever published for this cluster. After modeling these data (§5) we examine the dynamical status of the cluster (§6).
Recently, observations of and location of five millisecond pulsars in NGC 6752 (D’Amico et al. 2002) have suggested a surprisingly high mass-to-light ratio in its core and the occurrence of non thermal dynamics in the inner regions (see Colpi, Possenti & Gualandris 2002). The determination of by D’Amico et al. relied on results of pulsar timing and published optical data derived from medium resolution ground based observation only. Taking advantage from our new optical data, we re-examine in §7 the D’Amico et al. measurement, discussing the possibile origin and the consequences of the observed values of at some length.
2 Observations and data analysis
The photometric data used here consist of two sets: (i)—High resolution set—a series of HST- WFPC2 images was obtained in March 2001, through the F555W () and F336W () filters as part of a long term project (GO-8709, PI: F. R. Ferraro) aimed to study the central stellar populations in a set of Galactic Globular Glusters (GGCs). In this dataset the planetary camera (PC, which has the highest resolution ) was roughly centered on the cluster center while the Wide Field (WF) cameras (at lower resolution ) sampled the surrounding outer regions; (ii)—Wide Field set—a complementary set of multi-filter (, , ) wide field images was secured during an observing run at the 2.2m ESO-MPI telescope at ESO (La Silla) in July 1999, using the Wide Field Imager (WFI). The WFI has exceptional imaging capabilities—the image consists of a mosaic of 8 CCD chips (each with a field of view of ) giving a global field of view of . The cluster was roughly centered on chip .
2.1 Photometry
The raw WFI images were corrected for bias and flat field, and the over-scan region was trimmed using standard IRAF222IRAF is distributed by the National Optical Astronomy Observatory, which is operated by the Association of Universities for Research in Astronomy, Inc., under cooperative agreement with the National Science Fundation. tools. The point spread function (PSF) fitting procedure was performed independently on each and images, using DAOPHOT II (Stetson 1994). A final catalog listing the instrumental magnitudes for all the stars in each field has been obtained by cross-correlating the and catalogs. The WFI catalog was finally calibrated by using the data-set of Buonanno et al. (1986).
The photometric reductions of the high resolution images were carried out using ROMAFOT (Buonanno et al. 1983), a package developed to perform accurate photometry in crowded fields and specifically optimized to handle under-sampled PSF (Buonanno & Iannicola 1989) as in the case of the HST-WF chips.
PSF-fitting instrumental magnitudes have been obtained using the standard procedure described in Ferraro et al. (1997a, 2001). The final catalog of the F555W and F336W magnitudes was calibrated by using the zero-points listed by Holtzman et al. (1995).
2.2 Astrometry
The recently released Guide Star Catalog () was used to search for astrometric standards in the entire WFI image field of view. Several hundred astrometric reference stars were found in each chip, allowing an accurate absolute positioning of the sources. An astrometric solution has been obtained for each of the 8 WFI chips independently, by using a procedure developed at the Bologna Observatory (Montegriffo et al. 2002, in preparation). At the end of the entire procedure, the rms residuals were of the order of both in RA and Dec.
The small field ( on the side) of the high resolution WFPC2/HST images was entirely contained within the field of view of the WFI chip , which imaged the central part of the cluster. Thus we used more than 1200 bright stars in the WFI catalog lying in the WFPC2-FoV as secondary astrometric standards in order to properly find an astrometric solution for the WFPC2 catalog. We estimate that the global uncertainty in the astrometric procedure is less than both in RA and Dec. At the end of the procedure the two catalogs (WFPC2 and WFI) have a fully homogeneous absolute coordinate system.
The two lists were then matched together: stars in the overlapping area were used to recheck the homogeneity of the calibration of the -magnitude (which is used to construct the surface profile) in the two catalogs. To do this the HST F555W band was transformed into the Johnson system and a homogeneous list of magnitudes and absolute coordinates for the sources in the HST and the WFI catalogs was produced. In order to avoid strong selection effects due to possible incompleteness of the samples (in particular the WFI catalog), we grouped the two samples as follows: (1) HST sample: all stars in the WFPC2 FoV with and from the cluster center; (2) WFI sample: all the stars in the WFI FoV with and from the cluster center. The Color-Magnitude Diagrams (CMDs) derived from these samples are shown in Figure 1.
3 The center of gravity
The first step toward the computation of the density profile is the determination of the center of gravity of the cluster. In doing this, we estimated the position of the geometrical center of the star distribution taking advantage from the knowledge of the exact star positions even in the innermost central region. We applied the procedure described in Montegriffo et al. (1995) which computed by simply averaging the and coordinates of stars lying in the PC camera of the HST catalog. is located at with a typical uncertainty of in both and , corresponding to about pixels in the WFPC2/HST images.
AO89 derived the by using the barycenter of the bright () resolved stars from ground based observations. We transformed the center position in their Figure 3,333Note that the orientation in both the maps shown by AO89—Figures 1 and 3, respectively—is incorrectly reported in their captions since E is on the right and N is at the bottom. into our coordinate system. It well agrees with our determination, being located only S.
The coordinates of the cluster center previously reported in the literature refer mostly to the center of luminosity , which is usually determined by the so-called mirror autocorrelation (see Djorgovski 1988). turns out to be S and E of the reported in the Djorgovski (1993) compilation. Such a difference is not surprising—similar offsets have been found in other clusters (see for example 47 Tucanae—Calzetti et al. 1993, Montegriffo et al. 1995; M80—Ferraro et al. 1999a).
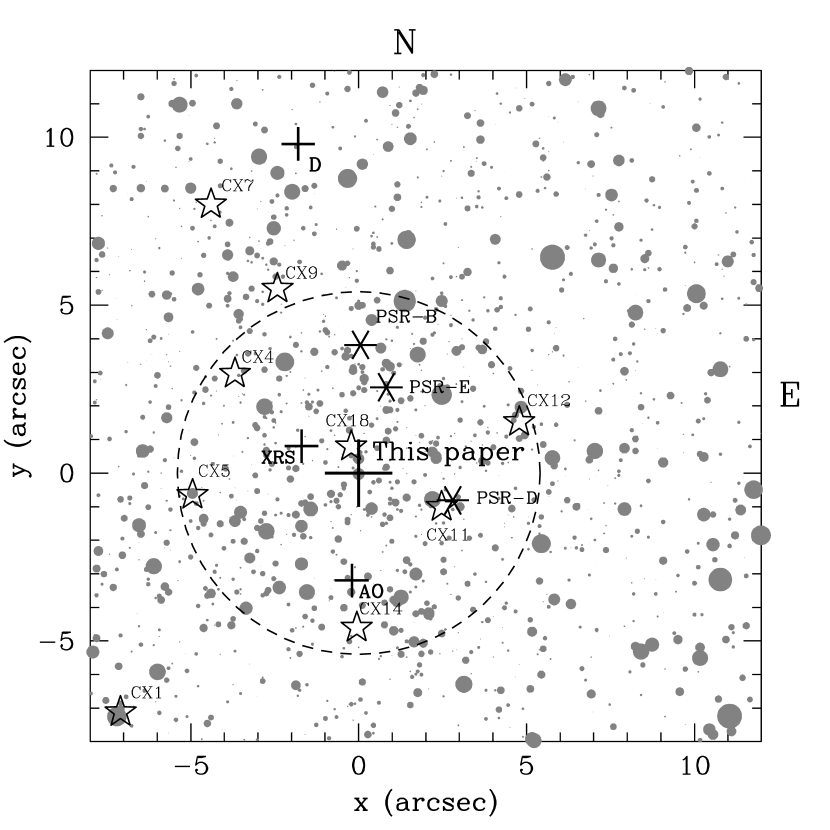
Figure 2 shows the central of the cluster with respect to the determined in this work (marked in Figure with a large cross at ). The center position by AO89 (small cross labeled with AO) and by Djorgovski (1993; small cross labeled with D) are also indicated.
Pooley et al. (2002) noticed that the highest concentration of X-ray sources detected by Chandra in a 30 ksec pointing toward NGC 6752 appeared surprisingly displaced with respect to the optical center by Djorgovski (1988). On the contrary, Figure 2 shows that our value of lies close to the barycenter of the nine more central objects (marked in Figure 2 with a large cross labeled with XRS at coordinates (), reconciling their projected positions with an almost spherical distribution.
4 The surface brightness and star density profiles
By using the combined data set shown in Figure 1 we computed star density and surface brightness profiles applying the standard procedure fully described in Calzetti et al. 1993 (see also Ferraro et al. 1999a, Paltrinieri et al. 2001). The entire photometric sample has been divided in 35 concentric annuli centered on , spanning a spatial range from to ; each annulus has been in turn split in a number of sub-sectors (generally octants or quadrants depending on the shape of the FoV covered by the HST and WFI fields). The surface brightness of each sub-sector has been evaluated as the sum of the luminosity of all the stars lying in it, divided by the area (expressed in ). The average and the rms over the brightness of the sub-sectors determine the value and the uncertainty of the surface brightness of an annulus. However, evaluating the brightness over small regions can suffer by large fluctuations due to small number statistics of few bright giants. Hence, we computed three radial profiles, removing the stars brighter than , respectively. Figure 3 shows that the overall structure of the profile does not change with the adopted magnitude limit. In contrast, the rms between sub-sectors significantly decreases once the brightest stars are excluded. The brightness profile by AO89 is shown (as open circles) for comparison in the lower panel of Figure 3. The agreement with the results of this work is excellent, although their profile is slightly fainter in the very central region, probably due to the incompleteness of their sample. This might be due to the fact that removal of the giants can lead to an unintentional subtraction of the contribution of close, fainter stars, which are often unresolved in ground-based observations.
We can take advantage from the fact that we resolve the stars even in the innermost region of the cluster and directly produce a star density profile. As noted by LCG95, a star density profile is not affected by the statistical fluctuations caused by the bright stars, and it is the most robust mean for determining the cluster structure parameters. Once the photometric sample has been divided in annuli and sub-sectors, the number of stars lying within each sub-sector has been counted and averaged. Star density has been eventually obtained by dividing the average star number by the area of the sub-sector (expressed in ). The star density profile values obtained from this procedure are listed in Table 1. This is the most complete and extended density profile ever published for this cluster, since it samples the cluster population from the very inner region out to from the cluster center.
5 Modeling the radial density profile
Usually GGCs are considered core-collapsed or not depending on how well their radial distribution of stars is fitted by King (1966) profiles (Trager et al. 1995). These models are characterized by two parameters, the core radius, , and the tidal radius, , or, alternatively, the concentration . As stated by Meylan & Heggie (1997, hereafter MH97) a more general rule is that all clusters with a concentration parameter –2.5 can be considered as collapsed, on the verge of collapsing or just beyond the collapse.
In order to reproduce the observed profile, we obtained the surface density by projecting the star density from a standard isotropic, single-mass King-model derived using the code described in Sigurdsson & Phinney (1995).444In our earlier work we have used an analytic representation of King profiles. Parameter values derived from the analytic fits differ somewhat from those derived using the current scheme. The result is shown in Figure 4. As can be seen, a King model which properly fits the outer region significantly overestimates the star density over an extended inner region (–). This fit closely resembles the result obtained by LCG95 who fitted the -band surface brightness profile for with a King model (see their Figure 2r). On the basis of that fit, they concluded that the cluster is not required to be in a post-core collapse state because the model did not differ from the data in a statistically significant way. However, there were aspects of the fit which led us to explore other possibilities. These included the bad fit in the region and the fact that even in the outer parts there are regions where the data line systematically above or below the observed points. We suspected that unmodeled effects were degrading this fit.
For this reason, we searched for alternative solutions. As shown in Figure 5 the density profile can be well fit by a dual King model. The outer cluster () is well fit by a model with and . The observed counts are significantly in excess of this model within the central . In this innermost region a King model with and fits the data, but lies significantly below all of the points with . A dual King model does not represent a detailed equilibrium of cluster structure. However, it is consistent with the scenario in which the central regions have evolved away from a global King model that now only characterizes the outer regions.
This anomalous structure of the innermost radial profile of NGC 6752 has been evident since the very first studies (Da Costa 1979). The -band data presented by DK86 showed a sharp shoulder in the radial profile and prompted the authors to classify NGC 6752 as a core-collapsed cluster. A few years later, AO89 modeled their detailed -band profile with a power law in the region between and from the center, noting a significant flattening for .
LCG95 used also a modified power-law (see their eq. 3, also reported in Figure 6), in order to test the presence of resolved cores. We used the inner part of the star density profile of Figure 5 to repeat an analysis similar to that presented by LCG95. Besides a normalization factor, their expression is a function of two free parameters: the power-law index and the scale-length of the core , which can be easily converted in the usual (see their eq. 2). As can be seen in Figure 6 a proper fit (with for d.o.f) can be obtained, yielding (corresponding to a core radius ) and ( errors). These values are consistent with the previous results by LCG95 ( and ) and by AO89, who estimated a radius of the central plateau of (from the analysis of their images) and (from the brightness density profile). At a distance of kpc (Ferraro et al. 1999b), the core radius we inferred corresponds to a physical dimension of pc.
6 The dynamical status of NGC 6752
The significant deviation of the star number density profile from a canonical King model is a clear indication that the innermost region NGC 6752 has experienced (or is experiencing) a collapse phase. Unfortunately, no similarly unambiguous signature is available for differentiating the in- and post-core collapse state (Meylan & Heggie 1997). However, in favorable cases the phase of the collapse can be evaluated from indirect evidence.
Our results solidify the earlier suggestions of post-core collapse bounce made by AO89. Post-core collapse clusters are expected to undergo large amplitude oscillations in core size due to the gravothermal instability of collisional systems (e.g. Cohn et al. 1991). The oscillating core spends most of the time at near maximum size and a radial extension of pc is consistent with the maximum radius of the core predicted by the models of post-core collapse bounce. The parameter most commonly used in theoretical studies is the ratio of core radius to half-mass radius, . Using our value of and the half-mass radius of from Trager et al (1995), we find a ratio . For comparison, the multi-mass Fokker-Planck models for the post-collapse evolution of M15 presented by Grabhorn et al (1992, see their Fig. 5) reach a comparable value of during the maximally expanded state of the most extreme core bounces. The inclusion of primordial binaries in Monte Carlo simulations by Fregeau et al (2003) results in an even wider range of predicted in the post-collapse phase.
Furthermore, we have found that there is an intermediate region in the composite density profile of NGC 6752 which is well represented by a power law profile with a slope compatible with the steepness predicted by single mass models of expanding bouncing cores (LCG95).
It is also worth noting that NGC 6752 has apparently retained a substantial primordial binary population (Rubenstein & Bailyn, 1997); these binaries may play an important role in supporting the core and delaying the core-collapse event. In this respect, Ferraro et al (1999a) have suggested that some species originated from binary evolution could be used as possible tracers of the cluster dynamical evolution. In particular, the large BSS population recently found in M80 by Ferraro et al (1999a) might be the signature of a transient dynamical state, during which stellar interactions are delaying the core-collapse process leading to an exceptionally large population of collisional-BSS. On the other hand the BSS population found in the central region of NGC 6752 is small (Ferraro et al 2003, in preparation) perhaps indicating that NGC 6752 is in a different dynamical evolutionary state than M80. Maybe the binary population in NGC 6752 has not been “burned out” producing collisional BSS while that in M80 has.
7 The interpretation of the MSPs accelerations
NGC 6752 hosts 5 known millisecond pulsars (D’Amico et al. 2001a; D’Amico et al. 2002). The positions in the plane of the sky of three of them (PSRs B, D and E, all isolated pulsars) are close to the cluster center, as expected on the basis of mass segregation in the cluster. In particular PSR-B and E show large negative values of , implying that the pulsars are experiencing an acceleration with a line-of-sight component directed toward the observer and a magnitude significantly larger than the positive component of due to the intrinsic pulsar spin-down (see e.g. Phinney 1992). What is the origin of such acceleration? Given the location of NGC 6752 in the galactic halo and knowing its proper motion (Dinescu et al. 1999), it is possible to calculate the contributions to due to centrifugal acceleration, differential galactic rotation and vertical acceleration in the Galactic potential, all of them resulting negligible (D’Amico et al. 2002). Hence, the remaining plausible explanations of the observed negative are: the accelerating effect of the cluster gravitational potential well or the presence of some close perturbator(s) exerting a gravitational pull onto the pulsars. Taking advantage from the new results presented in this paper we discuss in the follow viability and implications of these two possibilities.
7.1 Case (i): Overall effect of the GC potential well
The hypothesis that the line-of-sight acceleration of the MSPs with negative is dominated by the cluster gravitational potential has been routinely applied to many globulars. In particular from this assumption a lower limit to the mean projected mass-to-light ratio in the -band in the central region of M15 (Phinney 1992) and 47 Tucanae (Freire et al. 2003), yielded and respectively. Following Phinney (1992), a lower limit to in the inner regions of NGC 6752 is given by
where is the mean surface brightness within a line of sight subtended by an angle with respect to the cluster center and is the mass enclosed in the cylindrical volume of radius This equation holds to within 10% in all plausible cluster models and is independent of cluster distance, except for the effects of extinction. Since is very small for NGC 6752 (= 0.04 according to Harris 1996) the latter is a negligibe affect for this cluster.
Using the observed of PSR-B and PSR-E (D’Amico et al. 2002), combined with our accurate determinations of (the cluster center of gravity) and (the mean surface brightness radial profile), it turns out that –7 (see Figure 7) for the case of NGC 6752. D’Amico et al. (2002) obtained a slightly larger using published values of and derived from medium resolution ground based observations only. The difference between the two estimates is mainly due to our new position of the cluster center of gravity. Despite a residual uncertainty on under the hypothesis that the line-of-sight acceleration of PSR-B and PSR-E are entirely due to the cluster gravitational potential, a lower limit of can be firmly established. It is obtained assuming that the two millisecond pulsars were just symmetrically located (and hence at the minimum projected distance) with respect to the actual center of gravity.
The sample of the core collapsed clusters shows typical values of the projected central mass-to-light ratio in the interval 2–3.5 (Pryor & Meylan 1993), although larger ratios can be obtained when a Fokker–Planck model fit is used (e.g. the case of M15 Dull et al. 1997, 2003). If we take the expected total mass located within the inner pc of NGC 6752 (equivalent to the projected displacement of PSR-B from ) would be – On the other hand, the observed –7 implies the existence of further – of low-luminosity matter segregated inside the projected radius This extra amount of mass could be constituted by a relatively massive black hole, like the black hole in the center of the globular cluster M15 recently proposed by Gerssen et al. (2003). However, the results presented in §4 and §5 show that there are significant differences in the kinematics and mass distributions of the central regions of M15 and NGC 6752 (we note here that because the distance to NGC 6752 is less than half that to M15, its inner core is more easily studied): (1.) HST imaging of M15 (Guhathakurta et al. 1996—WFPC2; Sosin & King 1997—FOC) shows no evidence for a compact core, at variance with our observations of the core of NGC 6752; (2.) The derived stellar density profiles of M15 have power law slopes consistent with (expected from single mass models with a dominant central black hole; LCG95). If a black hole resides in the inner region of NGC 6752, its gravitational influence would extend more than from the center of the cluster and probably produce a central power-law cusp, which we do not observe.
A very high –7 could be also due to central concentration of dark remnants of stellar evolution, like neutron stars (NSs) and heavy white dwarfs (WDs) (as also proposed for M15 by Dull et al. 1997, 2003 and by Baumgardt et al. 2003). In this case, one can constrain the initial mass function (IMF) and/or the neutron star retention fraction in NGC 6752. Based on the current population of turn-off stars (in the mass interval –), the estimated number of upper main sequence initially present in NGC 6752 is (D’Amico et al. 2002). This assumes a Salpeter-like IMF ( which is consistent with that measured by Ferraro et al. 1997b). If the low-luminosity matter observed in the central 0.08 pc were entirely due to NSs of , then % (a reasonable value for collapsed clusters [Drukier 1996]). Alternatively, – can be explained by a Salpeter IMF if % of the total population of heavy -WDs sank into the NGC 6752 core during the cluster dynamical evolution. Either scenario must also be consistent with the observed shape of the star density profile.
According to Cohn (1985), during the core collapse phase the surface density slope for the most massive component is expected to be rather than the projected isothermal slope of . In the central cusp that forms during core collapse, the surface density slope of a component of stellar mass is given approximately by:
where is the stellar mass of the dominant component. If the luminosity profile is dominated by turnoff stars of mass and has a slope of , then the implied mass of the dominant, nonluminous component should be , i.e. somewhat more massive than the adopted turnoff mass. This argument does suggest that the central gravitational potential is not likely to be dominated by a large number of neutron stars, but heavy white dwarfs still remain a possibility.
Velocity dispersions provide a further constraint on the nature of the cluster potential well. The stars dominating the dynamics in the inner part of the cluster should have (see eq. 3.5 of Phinney 1992) a 1-dimensional central velocity dispersion –. This is compatible both with the very wide published interval for the of NGC 6752 (–, Dubath, Meylan & Mayor 1997) and with preliminary proper motion measurements of stars in the central part of NGC 6752, which would suggest a significantly higher one-dimension velocity dispersion and the existence of strong velocity anisotropies (Drukier et al. 2003)555If confirmed, such anisotropies would support the hypothesis of a relatively massive, probably binary black hole. Recent Fabry-Perot spectroscopy of single stars in NGC 6752 shows a flat velocity dispersion profile with typical one-dimension velocity dispersion –7 within the central (Xie et al. 2002). This is also marginally compatibile (given the % uncertainty of the formula 3.5 of Phinney 1992).
7.2 Case (ii): Local perturbator(s)
We here explore the alternate possibility that the acceleration imparted to PSR-B and PSR-E are due to some local perturbator.
NGC 6752 is a highly concentrated cluster and its core could host stars per cubic pc (assuming an average stellar mass of ). Hence close star-star encounters are a viable possibility. In order to produce the line-of-sight acceleration seen in PSR-B (or PSR-E) a passing-by star of mass must approach the pulsar at pc. An upper limit to the probability of occurrence of a suitable close encounter can be roughly estimated as Although this figure is not negliglible, the need of having two different canonical stars independently exerting their gravitational pull onto PSR-B and PSR-E, makes the joint probability of such configuration suspiciously low, . Rather than being randomly placed could the perturber be a binary companion to the MSPs? For such a companion not to have been aleady discovered by pulsar timing analysis would require an orbital period yr. Survival of such a wide binary is quite problematic in the core of a dense cluster like NGC 6752—indeed no binary pulsar with day has been detected in collapsed clusters to date. Seeing two such systems in NGC 6752 appears extremely unlikely.
One may wonder if a single object, significantly more massive than a typical star in the cluster, could simultaneously produce the accelerations detected both in PSR-B and PSR-E. Recently, Colpi, Possenti & Gualandris (2002) suggested the presence of a binary black-hole (BH) of moderate mass (–) in the center of NGC 6752 in order to explain the unprecedented position of PSR-A, a binary millisecond pulsar which is far away from the cluster center (D’Amico et al 2002). As shown in Figure 2, the projected separation of PSR-B and PSR-E is only pc. A binary BH of total mass , approximately located in front of them within a distance of the same order of , could be accelerating both the pulsars without leaving any observable signature on the photometric profile of the cluster. As the BH binarity ensures a large cross section to interaction with other stars, the recoil velocity due a recent dynamical encounter could explain the offset position (with respect to ) of the BH. However this scenario suffers of a probability at least as low as that of the previous two: placing the black hole at random within the core gives roughly a 1% chance that it would land in a location where it would produce the observed pulsar accelerations and the required – is also at the upper end of the expected distribution of for an intermediate mass black-hole in NGC 6752 (Colpi, Mapelli & Possenti 2003, in preparation).
In summary, on the basis of the available data, the accelerations shown by PSR-B and PSR-E can be easilier accounted by the usually adopted hypothesis (i) (which could explain also the large positive of PSR-D if it were not instrinsic), although the nature of the required extra amount (–) of low luminosity mass still remains puzzling. The existence of local perturber(s) of the pulsar dynamics (case (ii)) is a distinct possibility. While it seems extremely unlikely purely on the basis of the high value of measured in PSR-B and PSR-E, there are other indications of a binary low-mass BH. In particular, it would explain: (a) the absence of any cusp in the radial density profile, (b) the flat velocity dispersion profile (Xie et al. 2002), (c) and (d) the ejection of PSR-A and PSR-C in the cluster outskirts (Colpi, Possenti & Gualandris 2002). However it is admittedly ad hoc hypothesis, requiring a fine tuned scenario.
Clearly additional information must be collected. A longer baseline for timing measurements will allow to better constrain the presence of companions in very large orbits around PSR-B and PSR-E. In particular it will permit to derive (at least) upper limits on the second derivative of the pulsars’ spin period, which is more influenced by by-passing stars rather than by the cluster potential well (Phinney 1992). Similarly, the (single massive or binary intermediate mass) black-hole hypotheses could be better investigated with spectroscopic determination of the dispersion velocity of the stars located in the pulsars’ neighborhood, likewise with star density counts reaching higher magnitudes (hence exploiting a larger sample of objects) and better spatial resolution (thus probing the innermost of the cluster and the pulsars’ surroundings).
References
- Auriere & Ortolani (1989) Auriere, M. & Ortolani, S. 1989, A&A, 221, 20 (AO89)
- Baumgardt, et al. (2003) Baumgardt, H., Hut, P., Makino, J., McMillen, S., & Portegies Zwart S. 2003, ApJ, 582, L21
- Buonanno et al. (1984) Buonanno, R., Corsi, C. E., Iannicola, G., & Fusi Pecci, F. 1986, A&A, 159, 189
- Buonanno, et al. (1983) Buonanno, R., Buscema, G., Corsi, C.E., Ferraro, I., & Iannicola, G., 1983, A&A, 126, 278
- Buonanno & Iannicola (1989) Buonanno, R., & Iannicola, G. 1989, PASP, 101, 294
- Calzetti et al. (1993) Calzetti, D., de Marchi, G., Paresce, F. & Shara, M. 1993, ApJ, 402, L1
- Cohn et al. (1991) Cohn, H., Lugger, P. M., Grabhorn, R. P., Breeden, J. L., Packard, N. H., Murphy, B. W., & Hut, P. 1991, in The Formation and Evolution of Star Clusters, ed K. Janes (San Francisco: ASP), 381
- Colpi et al. (2002) Colpi, M., Possenti, A., & Gualandris, A. 2002, ApJ, 570, L85
- D’Amico, et al. (2001) D’Amico, N., Lyne, A., Manchester, R., Possenti, A., & Camilo, F. 2001, ApJ, 548, L171.
- D’Amico, et al. (2002) D’Amico, N., Possenti, A., Fici, L., Manchester, R. N., Lyne, A. G., Camilo, F. & Sarkissian, J. 2002, ApJ, 570, L89
- Da Costa (1979) Da Costa, G. S. 1979, AJ, 84, 505
- Dinescu et al. (1999) Dinescu, D.I., Girard, T.M., van Altena, W.F., 1999, AJ, 117, 1792
- Djorgovski (1988) Djorgovski, S. 1988, IAUS, 126, 333
- Djorgovski (1986) Djorgovski, S. & King, I. R. 1986, ApJ, 305, L71 (DK86)
- Djorgovski & Meylan (1993) Djorgovski, S., Meylan, G., 1993, in Structure and Dynamics of Globular Clusters, ed. S. G. Djorgovski & G. Meylan (ASP: San Francisco), 325
- Drukier (1996) Drukier, G. A. 1996, MNRAS, 280, 498
- Drukier et al. (2003) Drukier, G. A., Bailyn, C. D., Van Altena, W. F., Girard, T. M. 2003, AJ, 125, 2559
- Dubath, Meylan & Mayor (1997) Dubath, P., Meylan G., & Mayor, M., 1997, A&A, 324, 505
- Dull et al. (1997) Dull, J. D., Cohn, H. N., Lugger, P. M., Murphy, B. W, Seitzer, O. P., Callanan, P. J., Rutten, R. G, Charles, P. A. 1997, ApJ, 481, 267
- Dull et al. (2003) Dull, J. D., Cohn, H. N., Lugger, P. M., Murphy, B. W, Seitzer, O. P., Callanan, P. J., Rutten, R. G, Charles, P. A. 2003, ApJ, 585, 598
- (21) Ferraro, F.R., Paltrinieri, B., Fusi Pecci, F., Cacciari, C., Dorman, B., Rood, R.T.,Buonanno, R., Corsi, C.E., Burgarella, D., Laget, M., 1997a, A&A, 324, 915.
- (22) Ferraro, F.R., Carretta, E., Bragaglia, A., Renzini, A., Ortolani, S., 1997b, MNRAS, 286, 1012
- (23) Ferraro, F.R., Paltrinieri, B., Rood, R.T., Dorman, B., 1999a, ApJ, 522, 983
- (24) Ferraro, F.R., Messineo, M., Fusi Pecci, F., de Palo, M. A., Straniero, O., Chieffi, A., Limongi, M., 1999b, AJ, 118, 1783
- Ferraro, et al. (2001) Ferraro, F.R., D’Amico, N., Possenti, A., Mignani, R., & Paltrinieri, B. 2001, ApJ, 561, 337
- Gerssen et al. (2003) Gerssen, J., van der Marel, R. P., Gebhardt, K., Guhathakurta, P., Peterson, R. C., & Pryor, C. 2003, AJ, 125, 376
- Guhathakurta et al. (1996) Guhathakurta, P., Yanny, B., Schneider, D. P., & Bahcall, J. N. 1996, AJ, 111, 267
- Harris (1996) Harris, W. 1996, AJ, 112, 1487.
- Holtzmann, et al. (1995) Holtzmann, J.A., Burrows, C.J., Casertano, S., Hester, J.J., Trauger, J.T., Watson, A.M., & Worthey, G. 1995, PASP, 107, 1065.
- Howell et al. (2000) Howell, J. H., Guhathakurta, P., Gilliland, R. L. 2000, PASP, 112, 1200
- King (1966) King, I. R. 1966, AJ, 71, 64
- Lugger et al. (1995) Lugger, P. M., Cohn, H. N. & Grindlay, J. E. 1995, ApJ, 439, 191 (LCG95)
- Meylan & Heggie (1997) Meylan, G. & Heggie, D. C. 1997, A&ARV, 8, 1
- Montegriffo (1995) Montegriffo, P., Ferraro, F. R., Fusi Pecci, F. & Origlia. L. 1995, MNRAS, 276, 739
- Paltrinieri et al. (2001) Paltrinieri, B., Ferraro, F.R., Paresce, F. & de Marchi, G. 2001, AJ, 212, 3114
- Phinney (1992) Phinney, E. S. 1992, Nature, 358, 198
- Pooley et al. (2002) Pooley, D., et al. 2002, ApJ, 569, 405
- Pryor & Meylan (1993) Pryor, C. & Meylan, G. 1993, ASP Conf. Ser. 50: Structure and Dynamics of Globular Clusters, 357
- Sigurdsson & Phinney (1995) Sigurdsson, S. & Phinney, E. S. 1995, ApJSS, 99, 609
- Sosin & King (1997) Sosin, C., & King, I. R. 1997, AJ, 113, 1328
- Stetson (1994) Stetson, P. B. 1994, PASP, 106, 250
- Trager et al. (1995) Trager, S. C., King, I. R., Djorgovski, S. 1995, AJ, 109, 1912
- Xie et al. (2002) Xie, B., Pryor, C., Gebhardt, K. & Williams, T. 2002, submitted to ApJ
| err | err | |||||||
|---|---|---|---|---|---|---|---|---|
| 0.0 | 2.5 | 0.66121 | 0.14539 | 192.0 | 216.0 | -1.62649 | 0.06390 | |
| 2.5 | 5.0 | 0.53520 | 0.09093 | 228.0 | 259.0 | -1.76117 | 0.07847 | |
| 5.0 | 7.5 | 0.34446 | 0.08111 | 259.0 | 290.0 | -1.84727 | 0.10556 | |
| 7.5 | 10.0 | 0.16290 | 0.07666 | 290.0 | 328.0 | -1.99170 | 0.05829 | |
| 10.0 | 16.0 | 0.06712 | 0.10091 | 328.0 | 366.0 | -2.07631 | 0.06523 | |
| 16.0 | 22.0 | -0.07693 | 0.10896 | 366.0 | 404.0 | -2.18818 | 0.08721 | |
| 22.0 | 28.0 | -0.21536 | 0.08836 | 404.0 | 442.0 | -2.25923 | 0.07283 | |
| 28.0 | 34.0 | -0.27670 | 0.08735 | 442.0 | 480.0 | -2.39233 | 0.07300 | |
| 34.0 | 40.0 | -0.35778 | 0.06545 | 480.0 | 545.0 | -2.49601 | 0.09764 | |
| 40.0 | 46.0 | -0.49884 | 0.09170 | 545.0 | 610.0 | -2.60130 | 0.11642 | |
| 46.0 | 52.0 | -0.55220 | 0.07127 | 610.0 | 675.0 | -2.73773 | 0.09854 | |
| 52.0 | 58.0 | -0.61254 | 0.09105 | 675.0 | 740.0 | -2.80696 | 0.08906 | |
| 58.0 | 71.0 | -0.70716 | 0.04729 | 740.0 | 920.0 | -2.99633 | 0.07358 | |
| 71.0 | 84.0 | -0.82188 | 0.06490 | 920.0 | 1100.0 | -3.12938 | 0.05624 | |
| 84.0 | 96.0 | -0.9577 | 0.04571 | 1100.0 | 1280.0 | -3.21167 | 0.18171 | |
| 120.0 | 144.0 | -1.35696 | 0.05556 | 1280.0 | 1460.0 | -3.29291 | 0.11643 | |
| 144.0 | 168.0 | -1.43250 | 0.04013 | 1460.0 | 1620.0 | -3.40592 | 0.06529 | |
| 168.0 | 192.0 | -1.53549 | 0.05733 |
Note. — and are the inner and outer radii of each annulus in arcsec.