First hours of the GRB 030329 optical afterglow
Abstract
We present the first results of the observations of the extremely bright optical afterglow of gamma-ray burst (GRB) 030329 with the 1.5m Russian-Turkish telescope RTT150 (TÜBITAK National Observatory, Bakyrlytepe, Turkey). RTT150 was one of the first 1.5m-class telescopes pointed to the afterglow. Observations were started approximately 6 hours after the burst. During the first 5 hours of our observations the afterglow faded exactly as a power law with index in each of the BVRI Bessel filters. After that, in all BVRI filters simultaneously we observe a steepening of the power law light curve. The power law decay index smoothly approaches the value , observed by other observatories later. This power law break occurs at days and lasts for days. We observe no variability above the gradual fading with the upper limits – on time scales – s. Spectral flux distribution in four BVRI filters corresponds to the power law spectrum with spectral index . The change of the power law decay index in the end of our observations can be interpreted as a signature of collimated ultrarelativistic jet. The afterglow flux distribution in radio, optical and x-rays is consistent with synchrotron spectrum. We continue our observations of this unique object with RTT150.
keywords:
gamma-ray bursts — afterglows — optical observations2003299573[578]
28 April 2003
Introduction
Although the main part of the energy of gamma-ray bursts is emitted in hard X-rays and gamma, optical observations allowed to obtain a very important information on their sources. For example, they allowed to measure the redshifts for a number of GRBs establishing the cosmological distance scale to the sources of gamma-ray bursts. The observations of the GRB optical afterglows have become possible only when rapid and accurate GRB localizations were obtained in X-rays (first with BeppoSAX satellite, e.g. Costa et al. 1997a). The first optical afterglow was discovered by Bond (1997). The GRB afterglows were found in other wavelengths from radio to gamma as well (e.g. Taylor et al. 1998, Costa et al. 1997b, Burenin et al. 1999).
A number of the optical afterglows were observed in detail to date. Usually the light curves at all wavelengths can be approximated as power laws or their combinations with breaks at different times after the bursts. These breaks are attributed to signatures of collimated ultrarelativistic jets in GRB sources (see, e.g. references in Frail et al. 2001). Other type of the afterglow variability is also observed and interpreted as signatures of underlying supernovae (e.g. Sokolov 2001).
A very bright gamma-ray burst 030329 was detected by instruments aboard HETE-II satellite at 11:37:14.7 UT. The burst peak flux was measured to be erg s-1 cm-2 in 30–400 keV energy range, and duration — about 30 s (Vanderspek et al. 2003, Golenetskii et al. 2003). Within 2 hours a very bright optical transient (OT) was discovered in the position consistent with that measured by HETE-II (Peterson & Price 2003, Torii 2003). At the moment this object has become a prime target for many telescopes throughout the world. The extensive photometric and spectroscopic observations of this object are well documented in GCN circulars (e.g. Burenin et al. 2003, Khamitov et al. 2003). The redshift of the OT was determined to be (Greiner et al. 2003), ranging it as a closest GRB with measured redshift (except for GRB 980425, if it is associated with supernova 1998bw at ). This distance to the source corresponds to “isotropic” energy release in gamma-rays of order erg. The underlying supernova component emerged in OT spectrum later (Stanek et al. 2003).
In this paper we present the first results of the observations of this extremely bright optical afterglow with the 1.5m Russian-Turkish telescope (TÜBITAK National Observatory, Bakyrlytepe, Turkey, 2547 m, E, N). RTT150 turns out to be one of the first 1.5m-class telescopes pointed to the afterglow. Observations were started already in approximately 6 hours after the burst. At the beginning of our observations the magnitude of the optical afterglow in R was estimated to be . This is – brighter than any GRB afterglow previously observed on this time scale.
Observations
We used an AP47p Apogee CCD mounted in the Cassegrain focus of the telescope (). This is a back-illuminated CCD chip. We used binning mode with pixels. As always, bias and dark counts were subtracted and flat field correction applied for all the images. The data reduction was done with IRAF (Image Reduction and Analysis Facility)111http://tucana.tuc.noao.edu/ and using our own software.
, days
, days
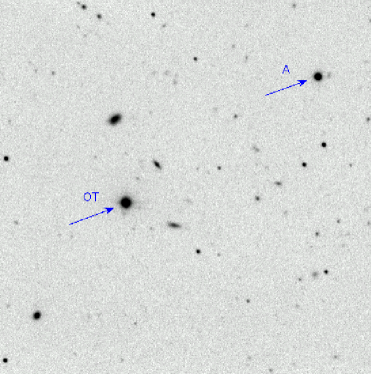
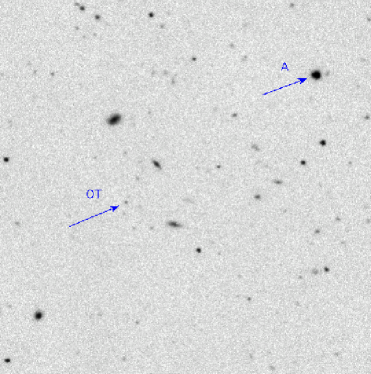
At the very beginning of the night on 29 March 2003, at 17:50 UT, the telescope was pointed to the afterglow of gamma-ray burst 030329. We observed the object till 01:30 UT when its zenith distance had become higher than . All this time the OT field was imaged in BVRI Bessel filters in series of exposures 30 – 10 s (the readout time was about 10 s). In total about 700 images were taken, 175 in each BVRI filter. The combined R image of the field is shown in Fig. 1 in the left. The right panel of this figure shows the image of this field obtained on May 28.
Photometry
All the measurements of the OT flux during the first night of our observations were done relative to the nearby bright star, designated as “A” in Fig. 1. This is the brightest star in our field of view. Nevertheless, during the first night even the star “A” is much fainter than the OT. Thus the errors of the afterglow flux measurements during the first night are dominated by the flux errors for this star. All the results were checked using the other stars in the field, but all of them are much fainter than star “A” and can not be used to improve the OT photometry.
To calibrate the field we observed the Landolt (1992) stars before and after the afterglow observations. These observations show that night was almost perfectly photometric. Small decrease of atmosphere transparency was observed during the very beginning of the night. The transparency was lower by approximately 10% and returned to its usual value during the first few hours of the observations.
Our photometric calibration is in good agreement with the photometry of this field provided by Henden (2003). In this circular it was noted that the OT and star “A” have very different colors. Therefore using star “A” as a reference may cause an additional systematic error correlated with airmass due to possible differential airmass corrections. However, in our photometric solutions we found no variations of the color coefficients with airmass or with the decrease of the transparency during the first hours of our observations. We estimate the systematic errors of the OT flux measurements to be not more than 1%.
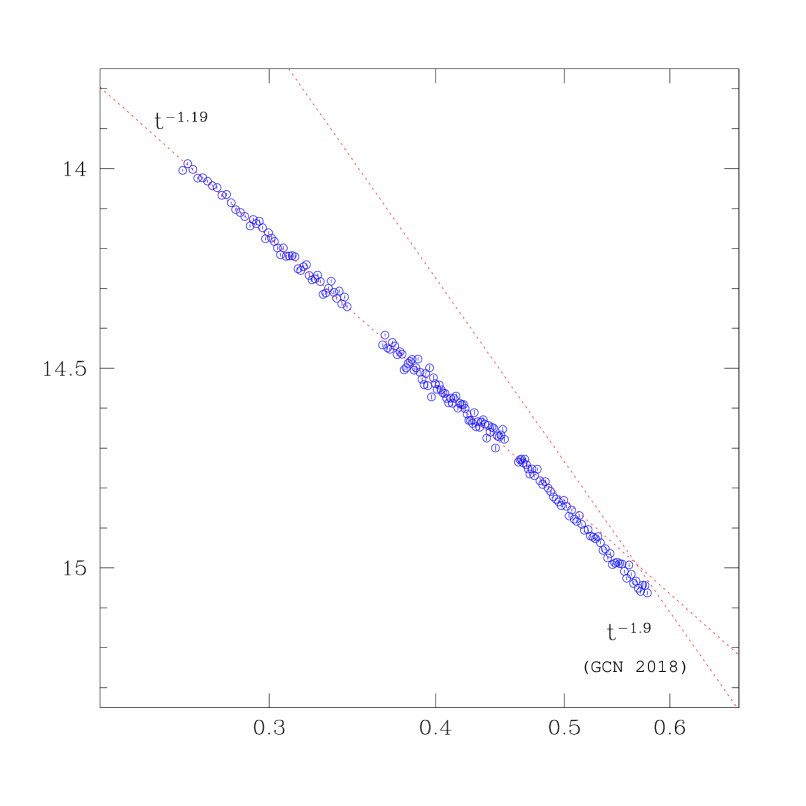
The light curve of the GRB 030329 afterglow in R band, obtained in the first night of our observations, is shown in the left panel of Fig. 2. During the first 5 hours the afterglow flux decayed with good accuracy as a power law with index . After that for approximately 3 hours we observe a steepening of the power law light curve. The power law decay index smoothly approaches the value , observed later by the observatories in the western hemisphere. The left panel also shows the power law with index , obtained at days with FLWO 1.2m telescope (Garnavich et al. 2003).
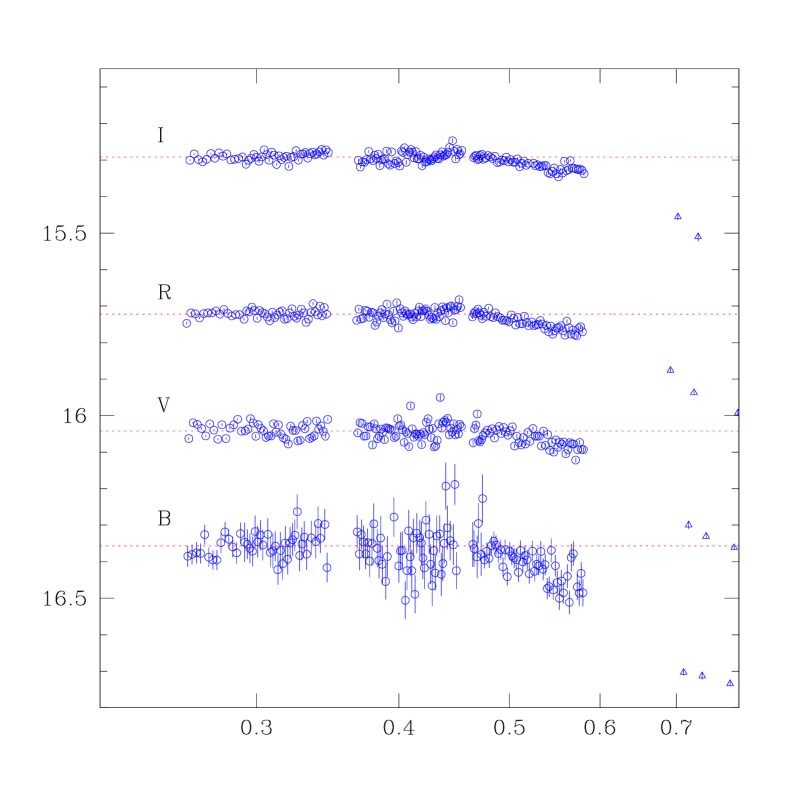
The right panel of Fig. 2 shows the light curve in BVRI filters after the subtraction of power law decay with index , obtained by fitting the first 5 hours of the R band light curve. We see that the power law decay is the same in each of the BVRI filters. The power law slopes in BVI are equal to , and respectively, which is within the errors equal to the power law slope in R. At days the flux decay in all filters simultaneously starts to deviate from this power law. Closer to the end of our observations we observe somewhat higher deviation in B. In the right panel of Fig. 2 the triangles at days show the data from Fitzgerald & Orosz (2003). These data are approximately consistent with our measurements at days.
Comparing our data at with the data of western observatories at (see Fig. 2) one can see, that we were lucky to observe in detail the beginning of the power law break of the afterglow light curve. The break occurred at days and lasted for approximately days. Note that just before the break we observe some marginally significant flattening of the afterglow light curve in R and I.
Before our observations, at , there were unfiltered observations with small telescopes (e.g. Rykoff et al. 2003, Sato et al. 2003). These data should be calibrated properly to be compared with our observations. We note however that the power law slope of the afterglow light curve at from 0.06 till 0.17 days (from 1.5 till 4 hours) equals to as can be inferred from the ROTSE data (Rykoff et al. 2003), which is approximately consistent with our measurements at later . An approximately similar slope was observed also in infrared (Nishihara et al. 2003). Thus, it is likely that the the power law decay index of the afterglow does not change significantly from as early as 1–2 hours after the burst.
, s
Short time scale variability
In Fig. 2 one can see that we observe no variability of GRB 030329 afterglow flux above the gradual decay on time scales 100–1000 s. Detailed analysis of the aperiodic variablity of the afterglow light curve is beyond the scope of this paper and will be a subject of the forthcoming publication. We note however, that RMS deviation of the observed light curve in R band from the best fit power law equals to on these time scales. This number obviously includes contribution of the statistical and systematical errors and therefore gives a conservative estimate of the upper limit on the intrinsic variablity of the optical flux.
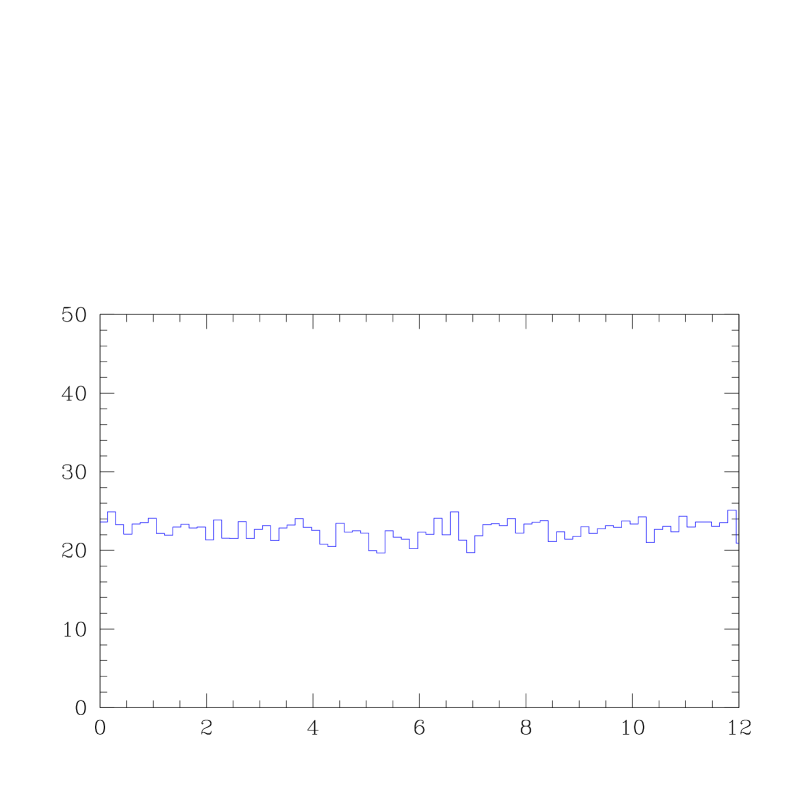
To examine the variability of the afterglow flux on even shorter time scales we observed the OT field, turning off the hour tracking of the telescope. The OT was moving through the field of view during these exposures. We then reconstructed the OT light curve with temporal resolution up to s using the track of the OT in CCD frame. In this method one image contains a segment of the OT light curve of approximately 15 s duration. Twenty images were taken in this way between 20:00 and 20:30 UT. One of those OT light curve segments is shown in Fig. 3. From these data we estimate the RMS of the afterglow optical flux on – s time scales to be equal to – respectively, which again gives conservative upper limits on the intrinsic variablity of the afterglow.
frequency, Hz
, mJy
Spectrum Across the BVRI Bands
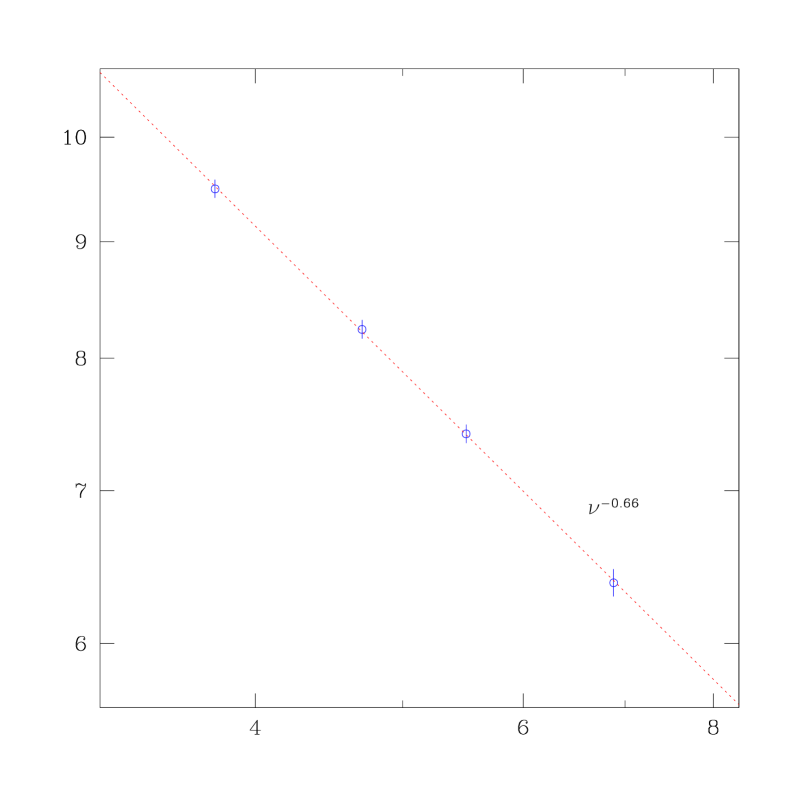
In Fig. 2 one can see that the colors of the optical afterglow of GRB 030329 are constant within the errors during the first 5 hours of our observations. The low resolution spectrum obtained from the fluxes in four BVRI filters at days, and corrected for galactic extinction (Schlegel et al. 1998) is shown in Fig. 4. With good accuracy it can be described as a power law with spectral index . We observe a somewhat flatter spectrum than that obtained by Stanek et al. (2003), who measured a power law spectral index , 2.6 days after the burst. Note that both indices are not corrected for the extinction in GRB host galaxy.
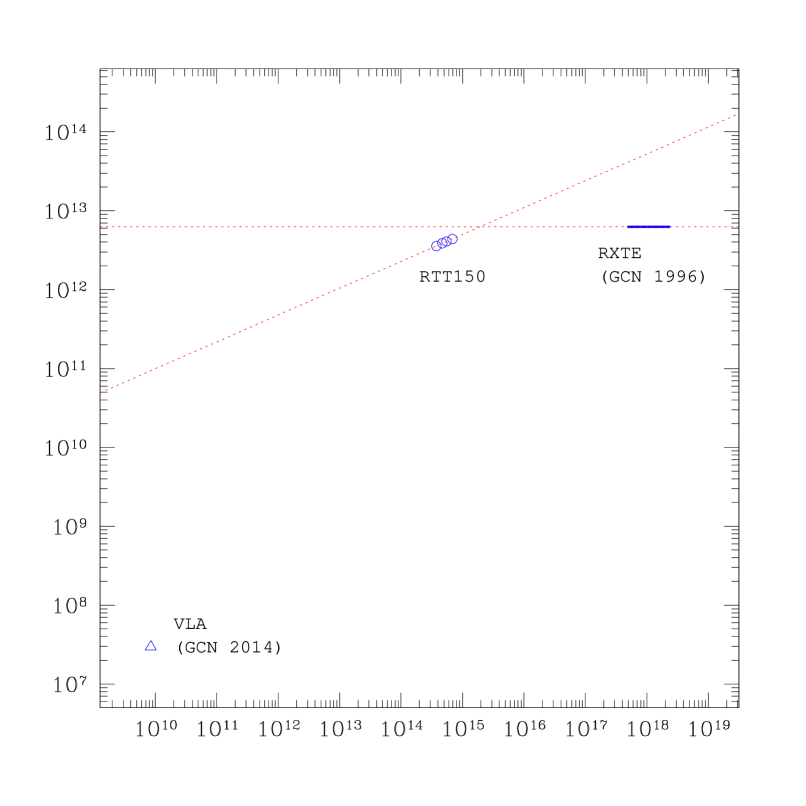
In Fig. 5 we compare the afterglow fluxes in the optical, in X-rays and in radio. The RTT150 data are shown for days (6 hours), when the second RXTE observation was made (Marshall & Swank 2003). We take the X-ray flux and the power law spectral slope from this circular. According to this circular between and hours the X-ray flux decayed by 20%. This corresponds to a power law with slope approximately , which is close to what we observe in the optical at about the same time.
From Fig. 5 we see that at days the maximum of the afterglow power is approximately in X-rays. The maximum is very wide covering far ultraviolet and probably soft gamma-rays. Even in the optical the afterglow power is only a factor of two lower than the power in X-rays.
The first observation of this afterglow in the radio was made approximately 0.6 days (14 hours) after the burst. The afterglow flux at 8.46 GHz was measured to be 3.5 mJy (Berger et al. 2003). Between and 0.6 days the afterglow radio flux probably had not changed by more than an order of magnitude. The afterglow radio flux was observed to be raising after the first observation (e.g. Pooley 2003). Therefore, at the afterglow power in radio should be approximately by 5–6 orders of magnitude lower than in optical or X-rays.
frequency, Hz
, Jy Hz
Discussion
We present a high sensitivity observation of the light curve of the GRB 030329 optical afterglow, starting as early as 6 hours after the burst. In each of the BVRI filters we observe a gradual flux decay, which can be accurately described as a power law during the first 5 hours of our observations. After that the afterglow flux started to decline faster.
High signal-to-noise ratio during our observations allowed us to investigate the variability of the afterglow flux with much higher temporal resolution than it could be done previously. Within the errors of flux measurements we observe no variability above the gradual fading down to the 0.1 s time scale. The upper limits are 10, 3 and 1% on 0.1, 10 and 100–1000 s time scales respectively.
The results of our observations are consistent with the model where the afterglow emission is generated during the deceleration of the ultrarelativistic collimated jet (see, e.g. Hurley et al. 2003). The break in power law light curve, which we observe at , can be interpreted as the “jet break”, i.e. the break which occurs when the angular structure of the ultrarelativistic collimated jet becomes observable. This interpretation is supported by the fact that to good accuracy this break occurred simultaneously in different colors. The power law slope of the light curve changes from to , approximately as it is usually observed in jet breaks (e.g. Harrison et al. 1999). Furthermore, before jet break there can not be any short time scale variability — exactly what we observe with good accuracy. The variability indeed occurs after this break (see GCN circulars).
For a uniform jet moving toward the observer, the time of the jet break corresponds to the time when the gamma-factor of the jet falls below , the inverse opening angle of the jet. We can determine the opening angle using the formula and typical parameters from Frail et al. (2001). The actual energy release in gamma-rays appears to be erg, approximately an order of magnitude lower than the typical value obtained by Frail et al. (2001) and comparable to the energy emitted by a typical supernova.
The form of the afterglow flux distribution in the radio, optical and X-ray bands (Fig. 5) is approximately consistent with synchrotron emission. Here the synchrotron cooling frequency could be between optical and X-rays. Synchrotron self-absorption is probably effective in radio band.
The observations of this unique object are continued now with RTT150. The results of these observations will be presented in the subsequent papers.
We are grateful to Mikhail Revnivtsev for his assistance in the analysis of RXTE data and to Sergey Sazonov for useful discussion of the results of our observations. This work was supported by Russian Fund for Basic Researches (grants 02-02-16619, 03-02-06768, 02-02-17342), by Russian Government Program of Leading Science Schools Support (grant 2083.2003.2), by the program of Presidium of Russian Academy of Sciences “Variable phenomena in astronomy”. This work was also supported by the High Energy Astrophysics Working Group of the Scientific and Technical Research Council of Turkey (TÜBITAK) through its support of basic research in Turkish universities and by the Turkish Academy of Sciences (for MAA).
References
- [ ] Berger E., Soderberg A. M., Frail D. A., \gcnc20142003
- [ ] Bond H. E. \iauc66541997
- [ ] Burenin R. A., Vikhlinin A. A., Gilfanov M. R., Terekhov O. V., Tkachenko A. Yu., Sazonov S. Yu., Churazov E. M., Sunyaev R. A., Goldoni P., Claret A., Goldwurm A., Paul J., Roques J. P., Jourdain E., Pelaez F., Vedrenne G., 344L531999; (astro-ph/9902006)
- [ ] Burenin R., Sunyaev R., Pavlinsky M., Denissenko D., Terekhov O., Tkachenko A., Aslan Z., Uluc K., Khamitov I., Kiziloglu U., Alpar A., Baykal A., Bikmaev I., Sakhibullin N., Suleymanov V., \gcnc2001, 2024, 2046, 2051, 2054, 20792003
- [ ] Costa E., Feroci M., Piro L., et al., \iauc66491997a
- [ ] Costa E., Frontera F., Heise J., et al., 3877831997b
- [ ] Fitzgerald J. B., Orosz J. A., \gcnc20562003
- [ ] Frail D. A., Kulkarni S. R., Sari R., et al., 562L552001
- [ ] Golenetskii S., Mazets E., Pal’shin V., Frederiks D., Cline T., \gcnc20262003
- [ ] Garnavich P., Stanek K. Z., Berlind P., \gcnc20182003
- [ ] Greiner J., Peimbert M., Estaban C., et al., \gcnc20202003
- [ ] Harrison F. A., Bloom J. S., Frail D. A, et al., 523L1211999
- [ ] Henden A., \gcnc2023, 20822003
- [ ] Hurley K., Sari R., Djorgovski S. G., astro-ph/0211620 (2003)
- [ ] Khamitov I., Aslan Z., Golbasi O., Parmaksizoglu M., Bikmaev I., Sakhibullin N., Suleymanov V., Burenin R., Sunyaev R., Denissenko D., Pavlinsky M., Terekhov O., Tkachenko A., Kiziloglu U., Alpar A., Baykal A., \gcnc2094, 2105, 2108, 21192003
- [ ] Landolt A., 1043401992
- [ ] Marshall F. E., Swank J. H., \gcnc19962003
- [ ] Peterson B. A., Price P. A., \gcnc19852003
- [ ] Pooley G., \gcnc20432003
- [ ] Rykoff E. S., Smith D. A., \gcnc19952003
- [ ] Sato R., Yatsu Y., Suzuki M., Kawai N., \gcnc20802003
- [ ] Sokolov V. V., Bulletin of the Special Astrophysical Observatory, (Izvestiya Spetsial’noi Astrofizicheskoi Observatorii), 51, 38 (2001)
- [ ] Stanek K. Z., Matheson T., Garnavich P. M., et al., ApJ ,in press, (2003); (astro-ph/0304173)
- [ ] Schlegel D. J., Finkbeiner D. P., Davis M. 5005251998
- [ ] Taylor G. B., Frail D. A., Kulkarni S. R., Shepherd D. S., Feroci M., Frontera F., 502L1151998
- [ ] Torii K., \gcnc19862003
- [ ] Vanderspek R., Crew G., Doty J., et al., \gcnc19972003