11email: burillo@oan.es 22institutetext: Observatoire de Paris, LERMA, 61 Av. de l’Observatoire, 75014-Paris, France
22email: francoise.combes@obspm.fr 33institutetext: Istituto di Radioastronomia/CNR, Sez. Firenze, Largo Enrico Fermi, 5, 50125-Firenze, Italy
33email: hunt@arcetri.astro.it 44institutetext: Astronomisches Institut der Ruhr-Universität Bochum, Universitätstrasse 150, D-44780, Germany.
44email: fboone@astro.ruhr-uni-bochum.de 55institutetext: Max-Planck-Institut für extraterrestrische Physik, Postfach 1312, D-85741 Garching, Germany
55email: ajb@mpe.mpg.de, linda@mpe.mpg.de 66institutetext: Universität zu Köln, I. Physikalisches Institut, Zülpicherstrasse 77, 50937-Köln, Germany
66email: eckart@ph1.uni-koeln.de 77institutetext: Institut de Radio-Astronomie Millimétrique (IRAM), 300 Rue de la Piscine, 38406-St.Mt.D’Hères, France
77email: neri@iram.fr 88institutetext: Instituto de Astrofísica de Andalucía (CSIC), C/ Bajo de Huétor, 24, Apartado 3004, 18080-Granada, Spain
88email: stephane@iaa.es 99institutetext: National Radio Astronomy Observatory, P.O. Box 0, Socorro, NM87801, USA
99email: eschinne@nrao.edu 1010institutetext: Astronomisches Institut, Universität Basel, Venusstrasse 7, CH-4102, Binningen, Siwtzerland
1010email: ppe@astro.unibas.ch France
Molecular Gas in NUclei of GAlaxies (NUGA)
We present new high-resolution observations of the nucleus of the counter-rotating LINER NGC 4826, made in the = and = lines of 12CO with the IRAM Plateau de Bure mm-interferometer(PdBI).The CO maps, which achieve 0.8(16 pc) resolution in the 2–1 line, fully resolve an inner molecular gas disk which is truncated at an outer radius of 700 pc. The total molecular gas mass (3.1108M☉) is distributed in a lopsided nuclear disk of 40 pc radius, containing 15 of the total gas mass, and two one-arm spirals, which develop at different radii in the disk. The distribution and kinematics of molecular gas in the inner 1 kpc of NGC 4826 show the prevalence of different types of =1 perturbations in the gas. Although dominated by rotation, the gas kinematics are perturbed by streaming motions related to the =1 instabilities. The non-circular motions associated with the inner =1 perturbations (lopsided instability and inner one-arm spiral) agree qualitatively with the pattern expected for a trailing wave developed outside corotation (’fast’ wave). In contrast, the streaming motions in the outer =1 spiral are better explained by a ’slow’ wave. A paradoxical consequence is that the inner =1 perturbations would not favour AGN feeding. An independent confirmation that the AGN is not being generously fueled at present is found in the low values of the gravitational torques exerted by the stellar potential for R530 pc. The distribution of star formation in the disk of NGC 4826 is also strongly asymmetrical. The observed asymmetries, revealed by HST images of the inner disk, follow the scales of the various =1 perturbations identified in the molecular gas disk. Massive star formation is still vigorous, fed by the significant molecular gas reservoir at R700 pc. There is supporting evidence for a recent large mass inflow episode in NGC 4826. The onset of =1 instabilities of the type observed in NGC 4826 may be a consequence of secular evolution of disks with high gas mass contents.
These observations have been made in the context of the NUclei of GAlaxies (NUGA) project, aimed at the study of the different mechanisms for gas fueling of Active Galactic Nuclei (AGN).
Key Words.:
Galaxies:individual:NGC 4826 – Galaxies:ISM – Galaxies:kinematics and dynamics – Galaxies:nuclei – Galaxies:Seyfert – Radio lines: galaxies1 Introduction
1.1 Feeding Active Galactic Nuclei: the Nuclei of Galaxies (NUGA) project
Although there is observational evidence that the majority of galaxies contain super-massive black holes in their nuclei, the existence of nuclear activity is far from universal (Ho et al. 1997). It is commonly accepted that nuclear activity results from the feeding of a massive black hole by the infall of gas from its host galaxy. However, there is no consensus on which mechanisms are responsible for removing the angular momentum from the gas and driving infall down to scales of tens of pc. Moreover, it is unknown whether these mechanisms are at work only in active galaxies, or, alternatively, if the key difference between active and quiescent objects is the availability of gas supply to the nucleus. On large scales, several dynamical perturbations induced by galaxy collisions, mergers and mass accretion (Heckman et al. 1986) can effectively drive infall of gas to scales of . Numerical simulations have also shown that gravity torques from barred potentials are efficient at funneling gas into the center of a galaxy. Observational support for the role of bars in driving gas inflow at these scales has been found (Sakamoto et al. 1999). However, when an Inner Lindblad Resonance (ILR) is present, the gas accumulates in rings (Combes 1988; Piner et al. 1995; Buta & Combes 1996); subsequently there is virtually no gas infall to the nucleus, as gravity torques are positive inside the ILR.
To explain the mass transfer from the scale to radii of tens of pc, we must deal with the non-trivial problem of angular momentum removal. Possible solutions have invoked the onset of non-axisymmetric dynamical perturbations such as nested nuclear bars (Shlosman et al. 1989; Friedli & Martinet 1993); lopsidedness or =1 instabilities (Shu et al. 1990; Kormendy & Bender 1999; García-Burillo et al. 2000); warped nuclear disks (Pringle 1996; Schinnerer et al. 2000a, 2000b); and nuclear spiral density waves (Englmaier & Shlosman 2000).
The study of interstellar gas in the nuclei of galaxies is a fundamental tool for understanding nuclear activity and its relation to circumnuclear star formation. From the theoretical point of view, there is an increasing body of evidence that purely gaseous density waves (spirals, bars, warps or lopsided instabilities) may be driving gas infall to the Active Galactic Nucleus (AGN) (Heller & Shlosman 1994; Elmegreen et al. 1998; Regan & Mulchaey 1999). Within the central kiloparsec, most of the gas is in the molecular phase, which makes CO lines the best tracers of nuclear gas dynamics. Up to now, CO surveys of galaxies made with single-dish telescopes were hampered by insufficient spatial resolution (Kenney & Young 1988; Heckman et al. 1989; Young et al. 1995; Braine et al. 1993; Casoli et al. 1996; Vila-Vilaro et al. 1998). Most CO interferometer surveys of nearby spirals (Sakamoto et al. 1999; Regan et al. 2001; Helfer et al. 2003) mapped CO(1–0) disk emission at low spatial resolution (4–7) and moderate sensitivity (detectability thresholds 180M☉/pc2). Furthermore, until very recently (Jogee et al. 2001), the published survey samples have included very few AGN.
A study of the gas fueling in AGN absolutely requires high (0.5–1) spatial resolution, given the small (50–100 pc) linear scales involved. We also need high sensitivity to provide a high dynamic range in the synthesized maps. The NUclei of GAlaxies project–NUGA–(García-Burillo et al. 2003) is a high-resolution, high-sensitivity CO survey of a sample of 12 nearby AGN which spans the sequence of activity types (Seyfert 1, Seyfert 2 and LINERs). The survey is being carried out with the IRAM Plateau de Bure mm-interferometer (PdBI) in France, which offers the best combination of sensitivity and resolution crucial for this project. NUGA aims at reaching spatial resolutions 1 and will allow the acquisition of CO maps with high dynamic ranges for most of the targets. Our objective is to determine the distribution and dynamics of molecular gas in the inner 1 kpc of the nuclei with resolutions of 10–50 pc, and to study systematically the different mechanisms for gas fueling of the AGN.
The NUGA project relies on a multi-wavelength approach: the sample of galaxies observed at PdBI has been defined based on the availability of high-quality optical and near-infrared (NIR) images. These images have been obtained with both ground-based telescopes and the Hubble Space Telescope (HST). The optical and NIR counterpart of NUGA will provide the stellar potentials, the star formation history and the dust distributions for the galaxies in our sample. We will thus be able to study quantitatively the debated AGN-starburst connection. NIR maps will be used to compute the stellar potentials. These will be the basis for self-consistent numerical simulations of the gas dynamics (obtained from CO) in real case scenarios (defined by the optical and NIR images). The long term aim is to complete a super-sample of 25-30 objects observed by consortium members, within and outside NUGA, with the IRAM array. The initial papers will exploit on a case-by-case basis the data obtained in the context of the NUGA project.
1.2 The counter-rotator LINER NGC 4826
In this first paper, we study the distribution and dynamics of molecular gas in the nucleus of the LINER NGC 4826, using high-resolution (0.8–3) observations made in the 1–0 and 2–1 lines of 12CO with the IRAM array. NGC 4826, also known as the ’Black Eye’ or ’Evil Eye galaxy’ due to its optical appearance, hosts two nested counter-rotating gas disks of comparable mass. The inner disk extends to a radius of 50 and contains 107M☉ of atomic (HI) gas (Braun et al. 1992, 1994) and 2.3108M☉ of molecular (H2) gas (Casoli & Gerin 1993). The outer disk, extending from 80 to 9.8, rotates in the opposite sense to the inner gas and contains 108M☉ of HI (Braun et al. 1992, 1994). Rix et al. (1995), by studying the stellar kinematics along the principal axes of NGC 4826, found that the stars rotate at all radii with the same sense as the inner disk providing strong evidence that stars and gas are coplanar. However, the kinematics of the ionized gas, analyzed by Rubin (1994) and Rix et al. (1995), are considerably more complex. Within radii 30, ionized gas co-rotates with HI and the stars, followed by a strong kinematic disturbance in the region 30r100, where rotation velocity is close to zero. Most remarkably, Rix et al. (1995) found evidence for radial inflow along the minor axis.
Casoli & Gerin (1993) made low-resolution 12CO(1–0) (22) and 12CO(2–1) (12) maps of NGC 4826’s disk using the IRAM 30m telescope. Their maps showed that the co-rotating molecular disk ends quite abruptly at a radius of 45-50, i.e., at a significantly small extent relative to the optical galaxy size (=10). These low-resolution maps could not reveal the small-scale structure and kinematics of the compact molecular disk. NGC 4826 was also observed as a part of the interferometer surveys of OVRO (Sakamoto et al. 1999) and BIMA-SONG (Helfer et al 2003). These interferometer maps confirmed that the molecular gas disk of NGC 4826 extends out to a radius of 700 pc. The OVRO map of NGC 4826, published by Sakamoto et al. (1999), shows tantalizing evidence of an asymmetrical distribution of molecular gas in the inner 1 kpc.
The maps presented in this paper fully resolve the molecular gas distribution in NGC 4826 out to a radius of r=35(700 pc). The high spatial resolution (0.8=16 pc in the 2–1 line) and high dynamic range (70-100) of these observations allow the study of the complex pattern of gravitational instabilities at work from 1 kpc to 10-20 pc scales. Particular attention is devoted to exploring the influence that counter-rotating instabilities may have in driving gas inflow. We also compare in detail the CO maps with other gaseous/stellar tracers in order to obtain a global picture of the gas response to the stellar potential in NGC 4826. Finally, we study the distribution of star formation in the nucleus, using HST archive broad-band and narrow-band images.
2 Observations
2.1 CO observations
Observations of the nuclear region of NGC 4826 were carried out with the IRAM interferometer between December 2000 and January 2002, using the BCD set of configurations of the array (Guilloteau et al. 1992). We observed simultaneously the J=1–0 and J=2–1 lines of 12CO in a single field centered at = and =; the primary beam size is 42′′ (21′′) in the 1–0 (2–1) line. The spectral correlator was split in two halves centered at 115.114 GHz and 230.224 GHz, respectively, i.e., the transition rest frequencies corrected for an assumed recession velocity of v=408 km s-1. The correlator configuration covers a bandwidth of 580 MHz for each line, using four 160 MHz-wide units; this is equivalent to 1510 km s-1(755 km s-1) at 115 GHz (230 GHz). The correlator was regularly calibrated by a noise source inserted in the IF system. Visibilities were obtained using on-source integration times of 20 minutes framed by short ( min) phase and amplitude calibrations on the nearby quasars 1308+326 and 3C273. The data were phase calibrated in the antenna-based mode. The flux of the primary calibrators was determined from IRAM measurements and taken as an input to derive the absolute flux density scale in our map; the latter is estimated to be accurate to 10%. The bandpass calibration was carried out using 3C273 and is accurate to better than 5%.
The point source sensitivities derived from emission-free channels of 10 km s-1 width are 4.0 mJy beam-1 in 12CO(1–0) and 5.7 mJy beam-1 in 12CO(2–1). The image reconstruction was done using standard IRAM/GAG software (Guilloteau & Lucas 2000). Unless explicitly stated, we used natural weighting and no taper to generate the 1–0 line maps with a field of view of 75 and 0.25′′ sampling; the corresponding synthesized beam is , PA=44∘. We used uniform weighting to generate 2–1 maps with a field of view of 43 and 0.20′′ sampling; this enables us to achieve a spatial resolution 1′′ (, PA=34∘). No 3mm (1mm) continuum was detected towards NGC 4826, down to an rms noise level of 0.38 mJy beam-1 (0.67 mJy beam-1) in a 564 MHz-wide band centered on 113.6 GHz (231.7 GHz). The conversion factors between Jy beam-1 and K are 13 K Jy-1 beam at 115 GHz, and 25 K Jy-1 beam at 230 GHz. By default, all velocities are referred to vo and (, ) offsets are relative to the phase tracking center. Except for channel maps, all displayed maps are corrected for primary beam attenuation. We will assume a distance to NGC 4826 of D=4.1(75 H) Mpc (Tully 1988); Ho = 75 km s-1 Mpc-1 implies 1=20 pc. We will assume that the inclination angle of NGC 4826’s disk is =60∘ (Rubin 1994); we derive here a position angle of =1128∘, in rough agreement with previous determinations (e.g., PA=1205∘; Rix et al. 1995).
2.2 Optical and near-infrared observations
We acquired from the HST archive three broad-band images of NGC 4826, including WFPC2 (F450W ( band) and F814W ( band)) and NICMOS (NIC3: F160W ( band)); we also obtained a Pa image (F187N) as this galaxy was included in the survey of Böker et al. (1999). The optical images were combined with elimination of cosmic rays (crreject), and calibrated as described in Holtzman et al. (1995). Sky values were assumed to be zero. This was checked to be in general a good assumption with related NICMOS data (Hunt & Malkan 2003 in prep), and gives H-band magnitudes that agree to within 0.1 mag with ground-based data. The NICMOS images were re-reduced using the best calibration files and the van der Marel algorithm was used to remove the “pedestal” effect (see Böker et al. 1999). The continuum was subtracted from the Pa image according to the precepts explained in Böker et al. (1999), but only for the brightest pixel values (we excluded roughly half the pixels in the image). It was necessary to adjust the slope of F160W-F187N such that the nucleus remained 0 everywhere (see also García-Burillo et al. 2000). The fields-of-view are 2.72.7 and 5151, respectively, for the WFPC2 and NICMOS images.
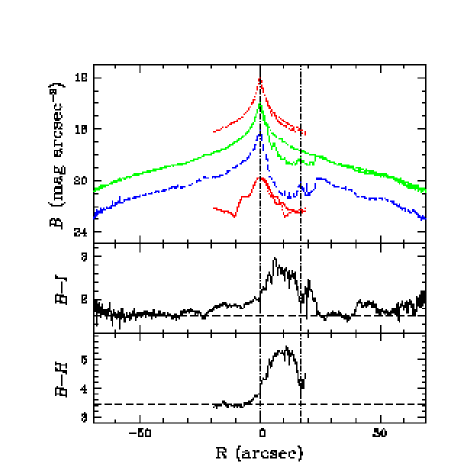
Optical and near-infrared surface-brightness profiles of NGC 4826 were measured along the minor axis (PA = 22∘) with a 3 width, and used to derive color profiles after rebinning to a 0.1 pixel scale. These will be discussed in Sect. 4.
3 Results
3.1 Position of the AGN
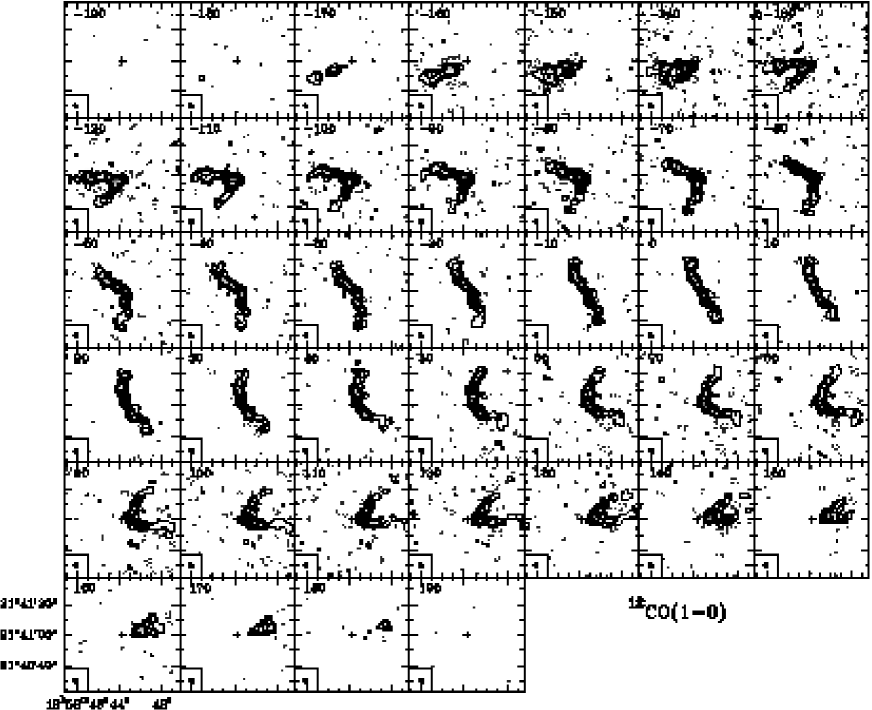
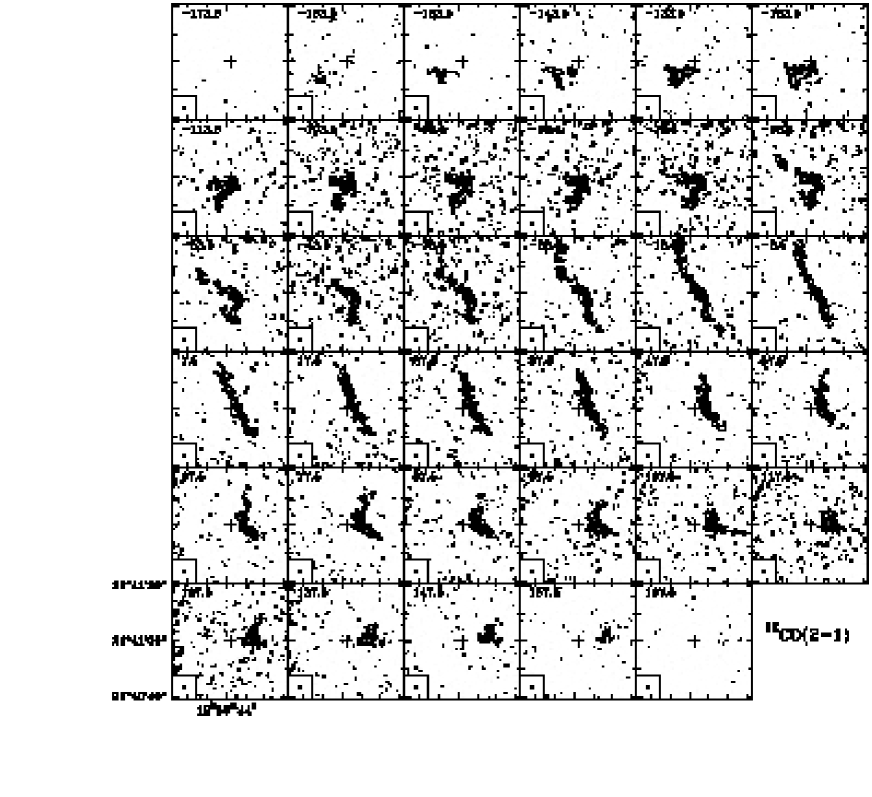
Fig. 1-2 show the velocity-channel maps of 12CO(1–0) and 12CO(2–1) emission in the central region of NGC 4826. The typical spider web diagram visible in the maps is the signature of a spatially resolved rotating disk. The eastern (western) side of the CO disk is blue (red)-shifted with respect to the reference velocity vo. The velocity field indicates that molecular gas co-rotates with the stars (Rix et al. 1995) and the HI gas (Braun et al. 1992) to a radius of 700 pc. We find no evidence of counter-rotating molecular gas in the inner disk. The best fits for the center of rotation and systemic velocity are (,)=(–3.3′′, –0.8′′) and v=vo+8 km s-1=416 km s-1, respectively. Within the errors, the derived dynamical center coincides with the position where CO lines reach their maximum widths (150–200 km s-1). The CO dynamical center lies very close (0.2) to a strong non-thermal continuum source present in the 6cm map of Turner & Ho (1994) (their source number 5; see also Fig. 3 in this work). Furthermore, the dynamical center coincides, within the errors, with the position of a X-ray source detected in the high-resolution (0.5) CHANDRA image of the nucleus of NGC 4826 (source S3; PI:Gordon Garmire, id. 411). Therefore, we ascribe the position , 40′59.3′′ to both the dynamical center and the LINER nucleus in NGC 4826. The systemic velocity derived from CO [v=4165 km s-1=v=4085 km s-1] agrees satisfactorily with the value determined from HI [v=4088 km s-1 from RC3].
3.2 The NGC 4826’s molecular gas disk
3.2.1 Molecular gas masses
The velocity-integrated 12CO(1–0) flux within the 42′′ primary beam field corrected for primary beam attenuation is SCO=1.58103Jy km s-1. Assuming a CO-to-H2 conversion factor =N(H2)/ICO=2.21020 cm-2 K-1 km-1 s (Solomon & Barrett 1991), the total H2 mass derived from the interferometer map is M(H2)=2.3108M☉. Including the mass of helium, the total molecular gas mass in the 12CO(1–0) Bure field is Mgas=M(H2+He)=1.36M(H2)=3.1108M☉, in good agreement with the estimate of 3108M☉ by Sakamoto et al. (1999). We estimate that the PdBI map recovers close to 100 of the single-dish 12CO(1–0) flux measured by Casoli & Gerin (1993) with the IRAM 30m.
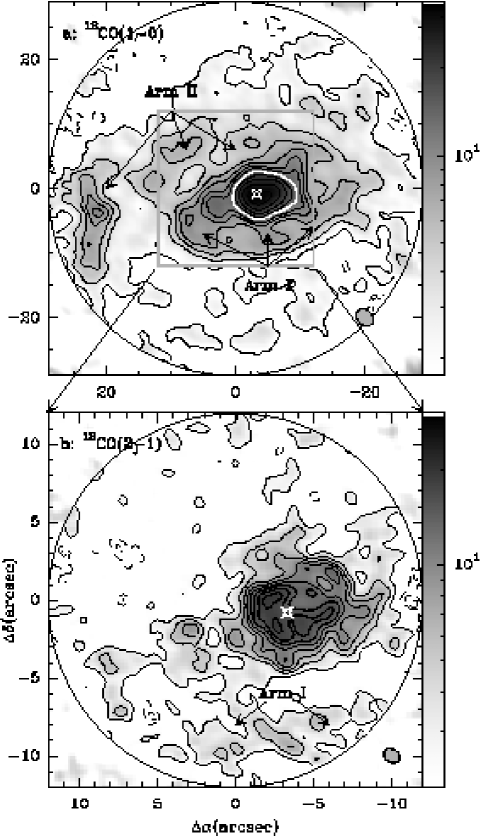
The overall distribution of molecular gas is best seen in Fig. 4, which shows the velocity-integrated intensity 12CO maps. These were derived by integrating channels from v to 200 km s-1. Although the 12CO(1–0) map probably lacks the sensitivity to detect gas emission beyond r35, we find little evidence that NGC 4826’s molecular disk extends significantly outside the 42 primary beam (see Fig. 1). This confirms the finding of Casoli & Gerin (1993) (see also Sakamoto et al. 1999) who reported that molecular gas is confined to the inner 1.6 kpc of NGC 4826. While our 12CO(2–1) map lacks sensitivity outside the central 500 pc of the disk, it gives a sharp image of the molecular gas distribution in the vicinity of the AGN (Fig. 4b).
3.2.2 The imprint of =1 perturbations in the central kiloparcsec of NGC 4826
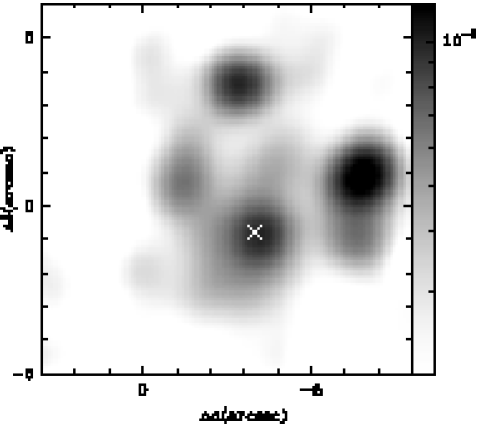
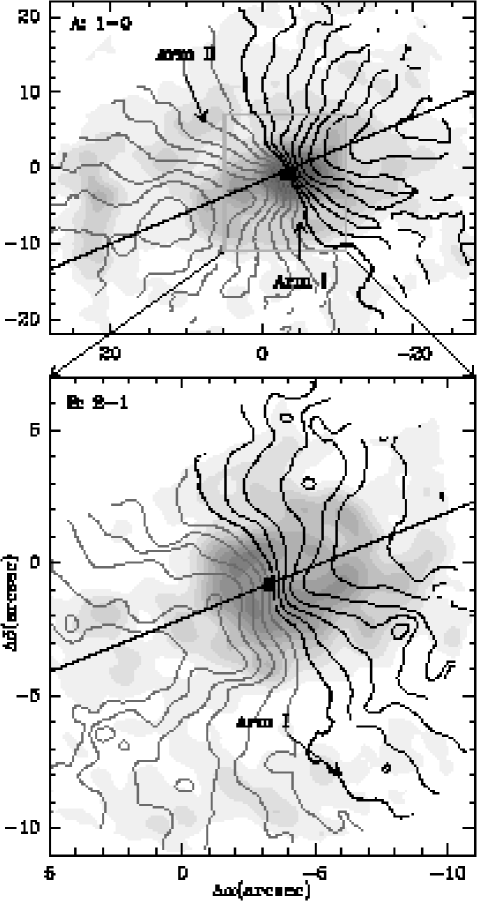
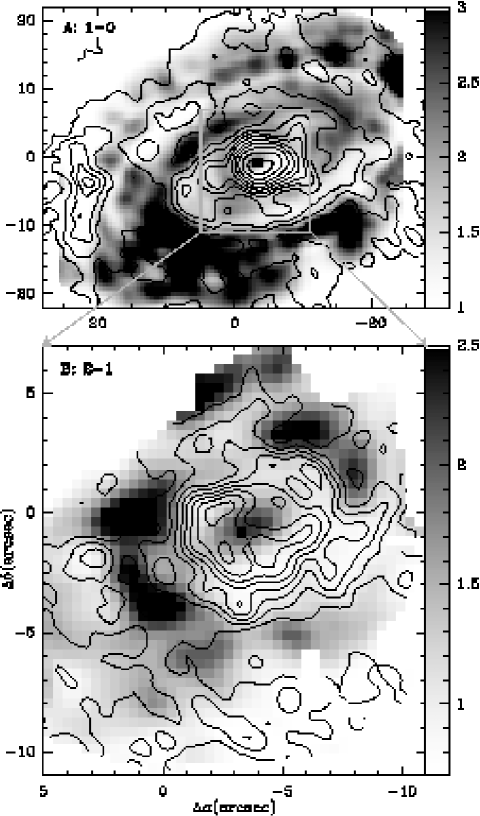
Nearly 15 of the total molecular gas mass is located in a circumnuclear disk (hereafter CND) around the AGN (M=3.4107M☉). This disk has a 80 pc average radius and its boundaries are here defined by the eighth intensity contour of Fig. 4a. The small scale structure of the CND is fully resolved in the 2–1 map (Fig. 4b). At scales of tens of pc, the CND has a lopsided morphology: there is a pronounced 20–60 pc offset between the AGN locus and a ridge of 12CO(2–1) emission which roughly extends from the NE (–3, 0.5) to the W side (–6.5, 1) of the CND (see Fig. 4b). A similar offset between the center of NGC 4826 and the centroid of dense molecular gas was identified by Helfer & Blitz (1997). Their HCN(1–0) map revealed a strong emission peak at (–1.5,–1.5), i.e., close to the ridge seen in 12CO(2–1), offering supporting evidence that the distribution of molecular gas in the inner region of the CND (R60 pc) is strongly lopsided. In the outer boundary of the CND (R60–80 pc) two weak winding spiral arcs can be tentatively identified in the 2–1 map, suggesting that secondary perturbations are at play.
Outside the CND, molecular gas emission is also detected along two spiral arms which are located at noticeably different radii in the disk. This indicates that also at these scales (100-700 pc) the distribution of molecular gas is asymmetrical. An inner spiral arm (hereafter Arm I), identified in both the 1–0 and the 2–1 maps (Fig. 4), extends south of the CND. The CND and Arm I join at (2.5,–3). An outer spiral arm (hereafter Arm II), visible in the 1–0 map (Fig. 4a), extends north of the CND, starting from the western side of the disk [(–10, 5)]. Arm II ends apparently on the SE side of the disk [at (22,–15)]. However, CO emission is detected southward of the CND at declination offsets –20 with a significant 10 level. Together with Arm II, this S arc would delineate an off-centered ring.
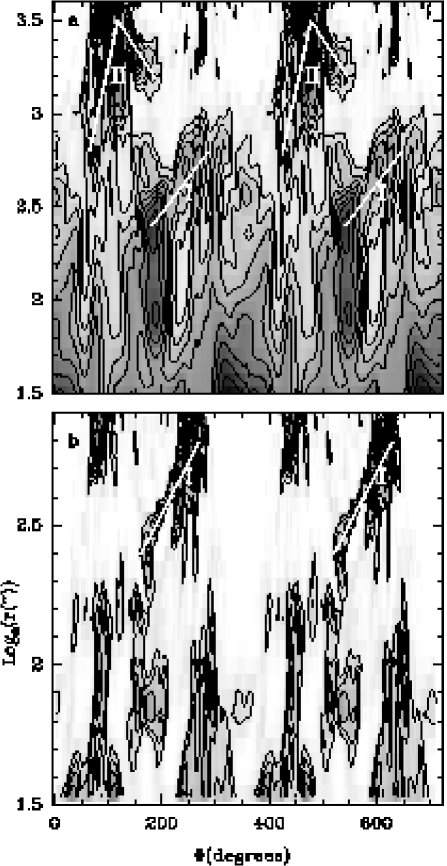
To highlight the geometry of Arms I and II, we have constructed the 12CO(1–0) and 12CO(2–1) peak brightness intensity maps (sensitive to contrasted structures) and deprojected them into the plane of the galaxy. Results are displayed in Fig. 5, which represent the deprojected brightness maps in polar grid coordinates [Log,]. Variable is the galaxy deprojected radius in and is the azimuthal angle in degrees (see Fig. 5 for details). In this representation, a spiral logarithmic feature would appear as a straight line with a non-zero slope.
As shown in Fig. 5, Arm I develops between 2.4Log2.8 (11r16) and 160∘280∘. Arm I shows only a 2–periodicity along . In contrast to two-arm (=2) spiral arms, one-arm (=1) spirals are not -periodic in azimuth. We can derive an average pitch angle () of the spiral from tan()=–Log/ along the arm; is the angle between the spiral and a circle at a given radius, measured counter-clockwise. This gives 167∘ for Arm I. The dust lane seen in optical images of NGC 4826 is a projected foreground layer situated on the northern side of the galaxy, identifying this as the nearer side. According to the observed sense of rotation of the gas, we therefore conclude that Arm I is trailing with respect to the gas and the stellar flows. Interestingly, this is in agreement with the morphological analysis by Walterbos et al. (1994), who also deduced that the inner spiral structure must be trailing inside R2.7 kpc.
Arm II is seen in the outer disk in the range 2.8Log3.5 (16r33) and 65∘190∘. Arm II shows a low order 2–periodicity along , characteristic of =1 instabilities. A similar analysis as done for Arm I indicates that the pitch angle of Arm II changes midway from 146∘ (trailing) to 10∘ (leading). This sudden change of orientation might suggest that at this location (R600 pc) two spiral-like perturbations are meeting in the disk.
In summary, the distribution of molecular gas in the inner 1 kpc of NGC 4826 shows the prevalence of different types of asymmetrical =1 perturbations in the gas disk. Besides two one-arm trailing spirals–Arms I and II–which develop in the outer region (radii 100–700 pc), we have detected a lopsided CND. This indicates that =1 perturbations extend to radial distances as small as 20–60 pc from the AGN. As shown below, the gas kinematics in the inner 1 kpc reveal the presence of non-circular motions which are related to the various detected =1 perturbations. A detailed analysis of these is developed in Sect. 3.3.2 to give an insight into the origin of =1 perturbations in NGC 4826.
3.3 Kinematics of NGC 4826’s molecular gas disk
3.3.1 The rotation curve and the dynamical mass
We show in Fig. 6 the mean velocity field maps obtained from the 12CO(1–0) and 12CO(2–1) data in the nucleus of NGC 4826 (derived with 2- clipping). The kinematics of molecular gas at radii R700 pc are consistent with those of a disk in direct rotation with respect to the stars.
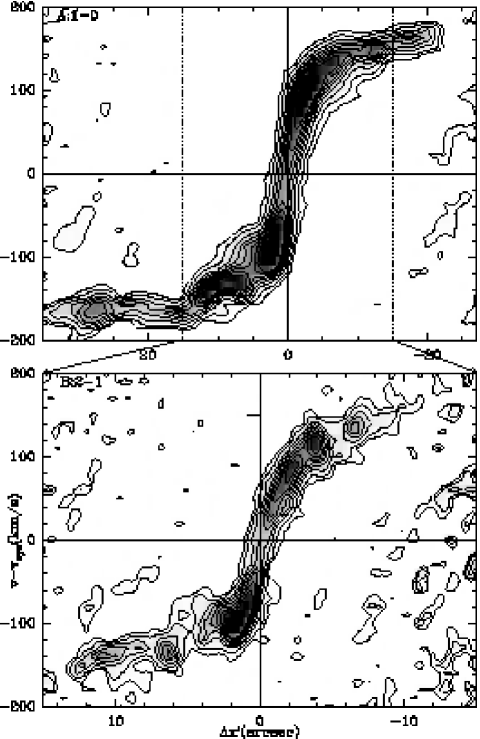
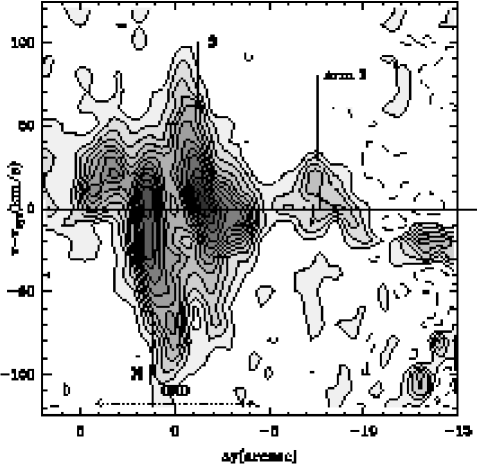
A CO rotation curve (vrot) has been derived from position-velocity (p–v) diagrams taken along the kinematical major axis of NGC 4826 (Fig. 7). We identify the major axis position angle as PA=1128∘; this value yields a larger line-of-sight velocity gradient within R=700 pc than does a p–v cut through the dynamical center at any other angle. Our determination roughly agrees with previous findings based on H and stellar kinematics (PA=1205∘; Rix et al 1995). We have calculated the terminal velocities, and from these, the rotation curve, by fitting gaussian profiles to the spectra across the major axis. The velocity centroids, corrected for inclination =60∘, give vrot for each offset along the major axis. Rotation curves derived from both sides of the major axis do not differ significantly within the errors. Therefore, we have derived vrot as a function of radius by averaging values from the W and E sides of the major axis. Data for both lines were noise-weighted averaged using a radial beaming of r=0.5.
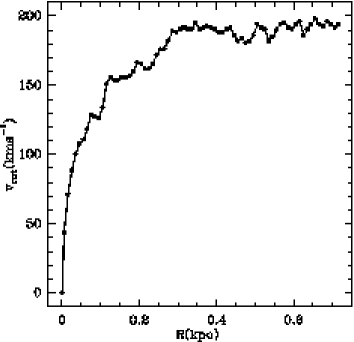
The resultant vrot (Fig. 8) shows a steep increase to the edge of the CND (R70–80 pc), where v120-125 km s-1. This trend is followed by a gradual increase up to a radius of R350 pc, after which vrot remains flat at 190 km s-1. The rotation velocity of molecular gas follows the stellar and the ionized gas motions inside R700 pc (see Fig. 3 and 6 of Rix et al 1995).
The total mass inside the CND can be inferred using M(R)=CRv/G, where G is the constant of gravitation, M(R) is the mass inside a sphere of radius R, and C is constant varying between 0.6 and 1, depending on the disk mass model assumed (Lequeux 1983). If we take a value of C=0.8 intermediate between the values appropriate for spherical (1) and flat disk (0.6) distributions, M(R=70 pc)2.3108M☉. This implies that the molecular gas mass fraction inside the CND is 15, decreasing to 5 within R=700 pc.
With the value estimated for the rotation curve at a radius R10 pc (v58 km s-1) we can set an upper limit of 8106M☉ for the mass of the putative super-massive black hole in the nucleus of NGC 4826.
3.3.2 Streaming motions and =1 modes
Although mainly characterized by circular rotation, the gas kinematics are perturbed by streaming motions. Isovelocities in Fig. 6 display a wavy pattern at the passage of both Arms I and II. Deviations from circular motion can be identified in Arm I as a systematic kink in the isovelocities which appear redshifted; as expected, the shift is most pronounced near the crossing of the galaxy minor axis where only radial motions have non-zero projection (see Fig. 9). We find a gradient across the minor axis from redshifted velocities in Arm I to blueshifted velocities in the adjacent interarm region located at larger radii (see Fig. 6a and Fig. 9). Deprojected into the galaxy plane, the radial velocities measured on Arm I indicate local outflow motions. In contrast, non-circular motions along Arm II indicate that gas velocities are systematically redshifted, a local signature of inflow motions (Fig. 6).
Departures from pure rotation, related to the lopsided instability, also characterize the CND kinematics. The average gas velocities derived from 2–1 data seem slightly redshifted (blueshifted) on the southern (northern) crossing of the lopsided feature along the minor axis (Fig. 9). Similarly to Arm I, these motions can be interpreted as a local signature of outflow. However radial streaming motions are neatly reversed in the outer boundary of the CND (R60–80 pc) where two secondary winding spiral arcs are identified in the 2–1 map (see Fig. 9).
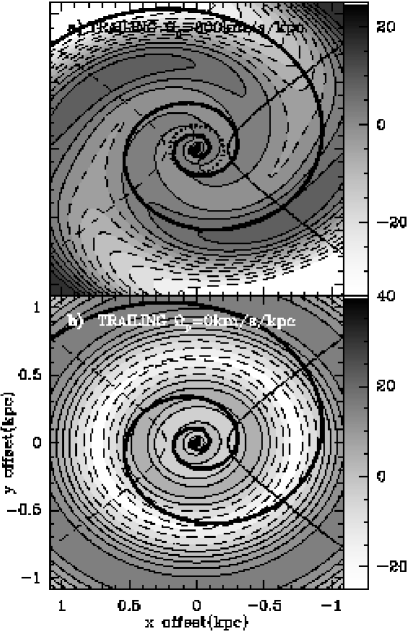
The signatures of the streaming motions expected for trailing/leading waves can be analyzed in the framework of the linear density wave theory (Shu et al. 1973). The sign of velocity perturbations changes close to the minor axis when crossing from inside to outside the corotation resonance. A comparison with models may give some insight into the nature of the density waves that may account for the streaming motions observed in CO. García-Burillo et al. (2000) applied the general formalism to the case of one-arm (=1) spirals for two extreme values of the pattern speed () illustrating the slow and the fast mode solutions. In the slow (fast) solution we are mostly inside (outside) corotation of the modes. In the case of NGC 4826, we have explored a fast solution by adopting a pattern speed large enough to assure corotation lies well inside the disk of the ’model’ galaxy (=800 km s-1 kpc-1; this implies RCOR=200 pc for a rotation curve similar to vrot). In contrast, a slow mode is here characterized by =0 km s-1kpc-1, i.e., a stationary wave where corotation is pushed outside the disk.
We represent in Fig. 10 the radial velocity perturbations, projected into the plane of the sky (vpert), for the fast and slow one-arm trailing solutions. We purposely chose a disk geometry and spiral parameters qualitatively similar to those of NGC 4826, apart from a lower inclination angle adopted here to give a more detailed picture of the velocity field in the model. Moreover, we can reasonably assume that the gas response (peak gas density) is close to the spiral potential minima in all cases. A comparison of the two model solutions with the CO observations indicates that the streaming motions measured on Arm I and, also, on the inner lopsided instability of the CND match qualitatively the solution of the fast trailing =1 mode (Fig. 10): when the spiral arm is outside corotation, velocities are redshifted (blueshifted) on the southern (northern) side of the galaxy minor axis. In contrast, Arm II better matches the solution of the slow trailing mode (Fig. 10).
A paradoxical consequence is that the inner =1 perturbations, represented by Arm I and the lopsided CND instability, would not favor gas infall: behaving as fast modes, the gas would gain angular momentum from the waves and would migrate outwards. In particular the AGN fueling might be temporarily blocked upon the onset of the inner lopsided instability. The perturbations identified in the outer boundary of the CND would favor gas inflow, however. This suggests that inflow and outflow may be globally counterbalanced in the CND. It remains to be determined, however, if angular momentum removal/gain from these instabilities, either stellar or gaseous, can be efficient enough to play some role in AGN feeding (see Sect. 6).
3.4 CO line ratios
To probe the physical conditions of the molecular gas in NGC 4826, we have studied the variation of the 12CO(2–1)/12CO(1–0) ratio in areas with significant emission levels in both lines (brightness temperatures 5). The 2–1 map was first degraded to the spatial resolution of the 1–0 map within the 21 primary beam to assure that the two lines sample identical regions; both maps were also corrected for primary beam attenuation.
The derived 12CO(2–1)/12CO(1–0) ratio is roughly constant over most of the disk, with a mean value 0.650.05. This ratio is close to the canonical value observed in other spiral disks and is typical of moderately dense optically thick molecular clouds (see García-Burillo et al. 1993). The only exception to this is in the vicinity of the AGN (R50-100 pc), where the measured ratio is close to 1. The highest values (1.1) are observed toward the lopsided structure in the CND which coincides with the peak of emission detected in HCN (Helfer & Blitz 1997). Ratios are close to 0.8–0.9 in the strongest clumps along the spiral ridge of Arm I.
4 Star formation in NGC 4826
4.1 Distribution of star formation
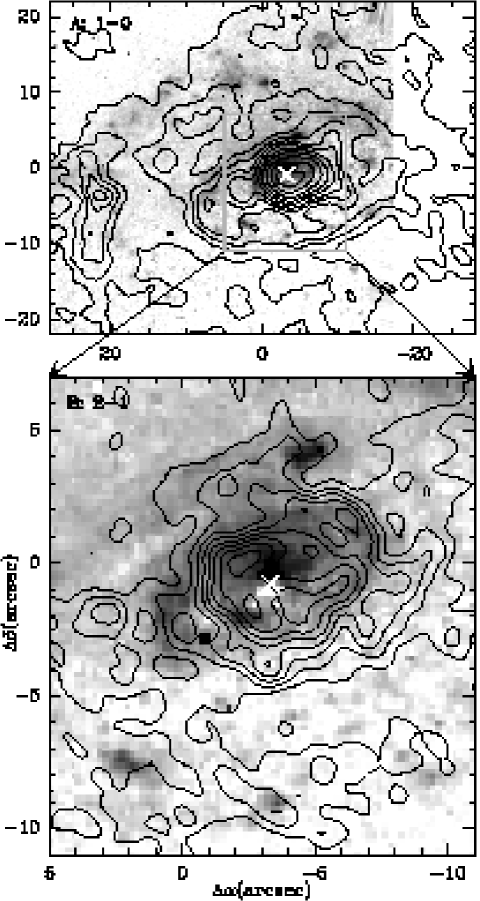
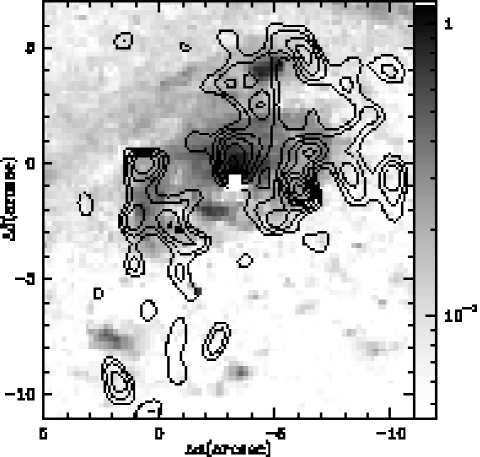
The distribution of star formation in NGC 4826’s disk is strongly asymmetrical, as seen in the HST Pa image (see Fig. 11). The asymmetries follow with similar spatial scales the various =1 instabilities identified in the CO maps. Interestingly, the overall star formation pattern shows a strong N/S asymmetry. While the 12CO(1–0) emission on Arm II is associated with a strong ionized gas emission, to the southern far side in Arm I, where extinction is smaller, Pa is significantly weaker. This is contrary to what would be expected if the reported N/S asymmetry was due mainly to heavy extinction by the conspicuous northern dust lane. Furthermore, the star formation pattern is also very asymmetrical in the CND (Fig. 11). We illustrate this in Fig. 12, which compares the Pa morphology with the mostly thermal radio continuum emission at 2cm in the nucleus of NGC 4826 (from Turner & Ho 1994). A strong maximum is visible in both maps, which indicates that the star formation peaks neither on the AGN nor on the lopsided instability seen in the 12CO(2-1) map, but rather 20 pc northward.
4.2 Extinction in the “Evil Eye”
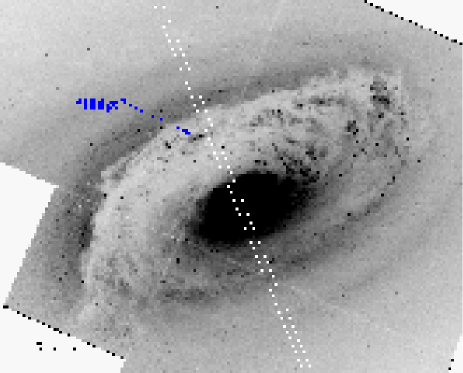
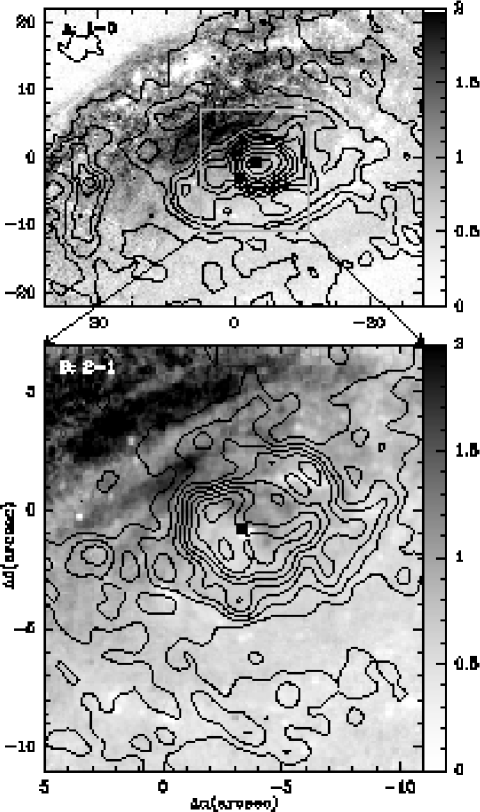
The conspicuous dust lane identified in the optical pictures of NGC 4826 is expected to significantly screen any emission to the N. With the assumption of intrinsic axisymmetry for the stellar disk/bulge, Witt et al. (1994) determined the optical depth in the “Evil Eye”. Following Witt et al. (1994), we have re-examined the issue of extinction by extracting surface brightness profiles along the minor axis in F450W, F814W, and F160W. The relationship of this “cut” to the galaxy morphology is shown in Fig. 13; the profiles, averaged over 3 perpendicular to the direction of the cut, are shown in Fig. 13. The figure shows clearly the effects of extinction towards positive (northern) radii, and confirms the assumption that the stellar populations in the disk of NGC 4826 are rather symmetric, as the discrepancy between the northern and southern halves of the surface brightness profiles decreases substantially with increasing wavelength. However, the ionized gas emission is clearly intrinsically asymmetric since it is more prominent on the near side where there is more extinction.
We have derived the extinction map using the mean colors of the disk, as determined from the outer region of the cuts, toward the S, where (broadband) extinction is low or zero (see Witt et al. 1994). The mean color of the outer (S) region is 1.62, similar to, although 0.16 mag bluer than, the equivalent color from de Jong (1996) for integrated colors of similar morphological types. With the extinction coefficients given in Holtzman et al. (1995) for the WFPC2 filters, we then derived the extinction from the map. The mean extinction measured in the dust lane turns out to be not greater than 1.5 mag, in agreement with the findings of Walterbos et al. (1994) and Witt et al. (1994). This confirms that the Pa image of NGC 4826 is virtually extinction-free, and can be considered as a fair unbiased picture of how recent star formation proceeds in the central kpc of NGC 4826.
The average extinction in the nucleus of NGC 4826 can also be estimated from the 12CO(1–0) integrated intensity map of Fig. 4. Assuming a CO-to-H2 conversion factor =N(H2)/ICO=2.21020 cm-2 K-1 km-1 s (Solomon & Barrett 1991) and the widely used gas-to-dust ratio of N(H2)/A cm-2 mag-1 (Bohlin et al. 1978), we obtain a mean 10 mag within the 42 1–0 primary beam. This value is a factor of 6 higher than that derived from color. However, for several reasons the CO-based value likely overestimates the dust column density that can absorb efficiently the stellar light. First, when this comparison is made, we implicitly assume a screen geometry for the H2 slab with unit filling factor. Second, there is evidence that the CO-to- column density ratio in central regions of galaxies may be lower than the standard Galactic value (see García-Burillo et al. 2000 and references therein). The extinction ‘discrepancy’ is even more severe at small scales. Fig. 14 compares the extinction map, estimated from , with the CO maps. Confirming the impression given in Fig. 13, it is evident that molecular gas column density is not tightly correlated with the -based (see also Block et al. 1994 and Sakamoto et al. 1999). Moreover, the clumpy structure of the interstellar medium makes difficult any comparison between values derived using data taken at very different spatial resolutions.
4.3 The star formation rate
We have measured the Pa flux within the entire NICMOS field-of-view for NGC 4826, summing 3 above sky, and found F(Pa) = 7.4 erg/s/cm2. This gives a luminosity L(Pa) = 1.5 erg/s, or a massive star formation rate (SFR) of 0.14 M⊙/yr, after correcting for a mean extinction of 1.5 mag (this work). This is slightly lower than, although comparable to, the SFR of 0.22 M⊙/yr estimated by Braun et al. (1994) from an H image with a larger field-of-view. While this indicates rather vigorous star formation activity, it is much lower than in true nuclear starburst galaxies such as M 82, which have SFRs more than 10-50 times higher (O’Connell et al. 1995).
The number of ionizing photons can also be measured from the ionized gas emission, and from this we can derive the number of equivalent O stars necessary to ionize the gas. Using the coefficients given in Osterbrock (1989), we find that the total Pa luminosity (not corrected for extinction) corresponds to 9.3 ionizing photons. Taking an O7V star as representative, and assuming the number of Lyman continuum photons from such a star to be 1 (Leitherer 1990), this corresponds to roughly 930 O7V stars. Our estimates of ionizing photons are consistent with those of Pierini et al. (2002), if we consider the total area of the Pa image compared to that of their spectroscopic slit. Because extinction may be an issue here, it is important to compare the number of ionizing photons derived from Pa to that derived by Turner & Ho (1994) from the radio continuum. They find a factor of 3 fewer ionizing photons, but 20 times more massive stars, differences which almost certainly are due to the different normalizations. As noted by Turner & Ho (1994), the HII regions in NGC 4826 are one order of magnitude more energetic than the largest star-forming complexes in the Milky Way. In any case, the rough agreement between the estimates obtained from Pa and from radio continuum maps is an independent confirmation that Pa suffers from virtually no extinction (see also discussion in Sect. 4.2).
4.4 Star formation and compact star clusters in NGC 4826
The comparison of the Pa morphology with that of the F450W and the color map reveals an interesting feature. The very blue compact source that emerges in the color cut at 17 lies within a ridge of HII regions or compact star clusters, visible in Fig. 13 just inside the edge of the “Evil Eye”. Surprisingly, this ridge of star formation does not coincide with the ionized gas emission ridge seen in Pa (Fig. 11). The Pa ridge is positioned roughly 4 closer (80 pc) to the nucleus than the arc of clusters, while the (very blue) 17 feature seems to contain little if any ionized gas. This result is consistent with the radial variations of ionized gas emission along the slit of Pierini et al. (2002), who found the peak of the ionizing photon flux at ; at 17 the ionizing flux is approximately 30% of its peak value. These authors also found the hardness of the ionizing ratio to vary radially, with an abrupt softening at 17 , roughly the same location where we find the blue compact source in the color cuts.
To better understand the pattern of star formation in NGC 4826, we have measured F450W and F814W magnitudes and (FWHM) diameters of compact sources in the ridge just inside the edge of the dust lane (see extra-nuclear cross in Fig. 13). All of the 25 sources measured appear to be star clusters, since their absolute F814W magnitudes range from to (without correction for extinction) and their FWHMs from 4 to 29 pc. If we convert to assuming and correct for 1.5 mag of visual extinction, we find that the absolute magnitudes ( to ) are consistent with those of Super Star Clusters (SSCs) if they are old enough (in which case the correction to the fiducial age of 10 Myr would be 1 mag).
If we infer the ages of these clusters from their color, which ranges from 0.65 to 2, we would derive a minimum age of 40 Myr (Leitherer et al. 1999) in the absence of reddening. This would imply a minimum luminosity correction of mag (Whitmore et al. 1997), which would bring the luminosity of most of these compact star clusters into the SSC range of M at a fiducial age of 10 Myr (Billet et al. 2002). These clusters are not extremely compact, although this also could be related to an older age. In any case, the clusters must be older than 10 Myr, given the conspicuous absence of ionized gas emission in their immediate vicinity. The formation scenario for compact star clusters or SSCs, although not completely understood, appears to involve mergers (Bekki & Couch 2001) and/or high-pressure environments (e.g., Billet et al. 2002).
The ionized and the molecular gas profiles along the minor axis of NGC 4826 share a common feature: the disks are abruptly truncated beyond a ridge of old (10 Myr) compact star clusters. This pattern suggests a parallel pattern in the age of the star formation in the disk. Apparently stars are still vigorously forming elsewehre inside R700 pc where there is a significant molecular gas reservoir.
5 Counter-rotation and =1 modes
NGC 4826 is a prototype among the large variety of counter-rotating disk galaxies. Counter-rotation can be purely stellar, involving stars versus gas, or characterized by the co-existence of two decoupled gas disks as seen in NGC 4826 (see compilations by Bertola & Corsini 1999, and Bettoni et al. 2001). The existence of counter-rotating components in disks suggests the active role that interactions, minor mergers and mass accretion processes may have in driving the evolution of galaxies. In hierarchical merging scenarios which explain how galaxy disks are built up, counter-rotating galaxies may naturally result from merger and/or accretion events. Partly due to the small number of observations, the prevalence of decoupled components in disk galaxies may have been underestimated thus far. Nevertheless, it is important to investigate which are the main gravitational instabilities induced by counter-rotation, and to analyze their influence on the removal of angular momentum from the gas. Analytical studies by Lovelace et al. (1997) indicate that the main dynamical instabilities linked with two-stream flows in galactic disks are one-arm spirals, i.e., =1 modes.
García-Burillo et al. (1998, 2000) mapped at high-resolution the massive counter-rotating molecular disks of the spirals NGC 3593 and NGC 3626, searching for the signatures of counter-rotating instabilities. The maps of both galaxies show compact molecular gas disks with mixtures of =1 and =2 perturbations. With the help of self-consistent numerical simulations adapted for NGC 3593, García-Burillo et al (2000) studied the development of disk instabilities. In their study, they found that counter-rotation drives rapidly evolving perturbations. The disk first develops stationary (0 km s-1 kpc-1) waves, leading with respect to the gas flow, followed later by a mixture of =1 and =2 slow (trailing) waves. The nature of the instabilities is seen to depend critically on the assumed halo/disk mass ratio (see also Comins et al. 1997). Similarly to the aforementioned cases, NGC 4826 has a very compact molecular disk with signatures of =1 perturbations at various scales. Rix et al. (1995) analyzed the stellar velocity distributions and estimated that a sizable fraction (10–30) of the stars in NGC 4826’s inner disk (radii 50) could be in counter-rotation. This decoupled component could drive the two-stream flow instabilities we actually observe in the molecular disk. However, the reported fraction of counter-rotating stars is still compatible with the high-velocity dispersion of this kinematically hot region, and thus cannot be taken as firm evidence for counter-rotation in the stellar component.
In summary, the only true counter-rotating component in NGC 4826 may be the outer HI disk. The instabilities observed in the inner molecular disk are therefore not linked with counter-rotation: =1 perturbations are detected in a region where two-stream flow is not detected. Additional evidence for this comes from the analysis of streaming motions made in the frame of density wave models (see Sect. 3.3.2). The CND lopsided instability and Arm I behave as fast modes, i.e., if the inner =1 perturbations are wave modes they seem to have developed outside corotation. This contrasts with the low pattern speeds of =1 modes which are known to be generated by the two-stream flow instability (Lovelace et al. 1997; Comins et al. 1997; García-Burillo et al. 2000).
6 Gravitational instabilities and AGN fueling
6.1 Gravitational torques in NGC 4826
The objective of this section is to study if gravitational torques, derived from a fair representation of the stellar potential in the inner disk of NGC 4826, can account for the gas kinematics derived from CO. Furthermore, we examine the efficiency of gravitational torques exerted on the gas in the context of AGN fueling.
NIR maps can be used to derive the distribution of old stars as they are less affected by dust extinction or by stellar population biases. Here we have used a high-resolution near-infrared image of NGC 4826 taken with HST-NICMOS to derive the stellar potential within the inner 1 kpc of the disk. The HST field-of-view on NGC 4826 is 1024 pc and is sampled with a grid of 256x256 pixels of 0.203 spatial resolution. The image of the galaxy was completed along the 3rd vertical dimension by assuming an isothermal plane with a scale height constant with radius; this scale height is equal to 1/12th of the radial scale-length, i.e.,160 pc. The gravitational potential is derived by a Fourier transform method on the grid from the NIR image. We also assumed a constant mass-to-light (M/L) ratio; the value of M/L is obtained by fitting the observed rotation curve.
The potential is decomposed as
| (1) |
we define the strength of the -Fourier component, and its global strength over the disk as (e. g. Combes & Sanders 1981).
The strength of the total potential or maximal torque over the whole disk is defined by
| (2) |
where represents the maximum amplitude of the tangential force and is the mean axisymmetric radial force, inferred from the =0 component of the gravitational potential.
The strengths of the main components for R520 pc are plotted in Fig. 15, together with the radial-variation of the corresponding phases, . It is interesting to notice that =1 components are stronger than =2 components in the stellar potential inside this region, especially for R50 pc. This indicates that there are also asymmetrical perturbations in the stellar disk.
Once the potential is obtained all over the grid, we deduce the forces ( and ) by derivation in each pixel, and can compute the average torque exerted on the gas. The surface density of the gas is assumed proportional to the CO emission, either 12CO(1-0) or 12CO(2-1) (both maps are used). We resample the CO maps at the same pixel size of 0.203”, and deproject them with the same geometrical angles as before. On each pixel, the torque is computed by:
We then compute the average over each radius of the torque per unit mass, i.e.:
The mean torques calculated using the 12CO(1-0) map are plotted in Fig. 15, in units of . The results based on the 12CO(1-0) and 12CO(2-1) maps are consistent. Most remarkably, oscillations between negative and positive values for are roughly consistent with the diagnostic based on the change of sign of streaming motions for Arm I (related to a fast trailing wave, hence causing angular momentum gain) and Arm II (related to a slow trailing wave, hence causing angular momentum loss) (see Sect. 3.3.2). The corresponding stellar torques in the CND are marginally positive very close to the AGN (R50 pc), suggesting that stellar perturbations contribute little to AGN feeding. Again, this fits ’qualitatively’ the streaming motions measured in CO, which would rather suggest outflow to some degree. The stellar torques change to negative values in the outer boundary of the CND; this roughly agrees also with the CO-based diagnostic.
While the radial variation of the stellar torques seem to account qualitatively for the changing signature of streaming motions, the maximum value of the mean torque is exceedingly small, however: 50. This implies that the typical time-scale for the gas to lose its angular momentum for R200 pc is of about 1 Gyr. This is much longer than the gas dynamical time-scale at this radius (of the order of 2 Myr). Gravitational torques exerted on the gas due to the stellar potential are ’globally’ quite weak. Weighted by the density, the total torque inside the evaluated region of the disk (R520 pc) is only marginally negative: the combination of all stellar perturbations seems to make the gas lose its angular momentum rather inefficiently.
We can ask whether our conclusions might be partly biased by the existence of residual extinction in the -band image originally used to derive the gravitational potential. However, several arguments can be advanced suggesting that this bias is negligible. Although we estimate that extinction in the band can locally reach magnitudes in the northern dust lane arc (at ), this value is comfortingly low elsewhere. In particular, we do not expect that the stellar gravitational potential is severely biased inside the CND, i.e., at the scales which are critical for evaluating the influence of gravitational torques on the AGN feeding. The derived values for inside the CND (at where ), as well as in Arm I (developing on the southern side, where ), are mostly weighted by the contribution of regions that are virtually extinction-free (see Fig. 14).
To estimate quantitatively the global influence of extinction on the derived torques, we have corrected the NIR map by a factor exp(), where and corresponds to the extinction map of Fig. 14. Confirming our expectations, the Fourier analysis of the gravitational potential thus derived is only slightly modified, and the average torques on the gas are practically unchanged. Although a detailed evaluation of residual extinction on the -band image would require the use of several high-resolution optical and infrared images in order to resolve the age-extinction degeneracy (to be addressed in a forthcoming publication), we can conclude that the value derived here for in the center of NGC 4826 is a robust estimate.
6.2 Gas self-gravity
Stellar perturbations are weak in the inner disk of NGC 4826 (except in the very center of the galaxy: R50 pc). Furthermore, we have found indications that they are probably inefficient to drive AGN fueling at R520 pc. Alternatively, self-gravitating gas instabilities may have a potential role in AGN feeding. When self-gravity of stars and/or gas is strong, galaxy disks are prone to gravitational instabilities. The local stability criterion, first established by Toomre (1964), ensures stability against axisymmetric perturbations in a stellar/gaseous galaxy disk when the column density of stars/gas () is smaller than a critical value (=/), i.e., when the so-called Toomre parameter =/. Here, is the epicyclic frequency, is the velocity dispersion and G is the gravitational constant. Stability against non-axisymmetric perturbations, such as spirals and bars, is guaranteed when is significantly larger than 2.
The stability criterion for a realistic galaxy disk needs to take into account the strong coupling between the stellar and gaseous components through self-regulation and feedback (Combes 2001). Nevertheless, as a first step, it is useful to evaluate separately for the gas disk. In the particular case of AGN host disks, previous extinction maps derived from HST color images seem to indicate that non self-gravitating gas instabilities (10-100) may be ubiquitous in the inner 100-200 pc of Seyfert galaxies (Martini & Pogge 1999) and potential drivers of AGN fueling through energy dissipation in shocks and turbulent motions. This scenario can be fully tested by exploiting the information provided by 12CO maps. Under certain assumptions, the 12CO intensity gives a fair estimate of . Moreover, the 12CO kinematics can be used to derive , , and in the disk. Hence, the derivation of maps follows straightforwardly.
Fig. 16 shows the variation of in the molecular disk of NGC 4826 as derived from 12CO(1–0). Fig. 16 displays also a zoomed-in view of the map for the inner disk obtained from 12CO(2–1). Gas column densities are derived from 1–0 data as explained in Sect. 3.2.1. We have used the 2–1/1–0 line ratio maps discussed in Sect. 3.4 to calculate from 12CO(2–1). and are derived from vrot using standard definitions. Finally, has been estimated from CO second moment maps. The contribution to of the rotation curve gradient within the lobe(s) is found to be significant for , but negligible elsewhere. The velocity dispersion is fairly constant in NGC 4826’s disk and close to 10 km s-1 except for , where doubles its value on average. In the following analysis we take for simplicity =10 km s-1.
With these assumptions, Fig. 16 indicates that Arms I and II are self-gravitating perturbations: the two one-arm spirals are characterized by low values, ranging from 1 to 2. There are also indications for the CND lopsided instability to be self-gravitating (2–3), unless an unrealistic boost in velocity dispersion (not observed) or a much lower CO-to-H2 conversion factor is invoked for . NGC 4826 seems to be a good counterexample to the scenario suggested by Martini & Pogge 1999: the =1 instabilities identified in NGC 4826 have low Q values. This suggests that self-gravity of the gas cannot be neglected and probably plays an essential role in the maintenance of the =1-type perturbations described in NGC 4826.
7 Summary and conclusions
We summarize the main results obtained here as follows:
-
•
High-resolution 12CO observations of NGC 4826 show that the bulk of its molecular gas lies in a highly structured disk of M3.1108M☉ which ends abruptly at R700 pc. The gas disk shows a preponderance of asymmetric perturbations (=1 instabilities). There is a lopsided nuclear disk of 40 pc radius and two one-arm trailing spirals, which develop at different radii in the disk (Arm I: 200–350 pc, Arm II: 350–700 pc).
-
•
The star formation pattern in the disk of NGC 4826 is strongly asymmetrical. The scales of the observed asymmetries resemble those of the various =1 perturbations revealed in the disk of molecular gas. Furthermore, the star-forming ionized/molecular gas disk is truncated beyond a ridge of compact star clusters identified at R700 pc. This suggests an evolutionary trend for star formation in the disk of NGC 4826. Apparently massive star formation has ceased beyond R700 pc, but is still vigorously occurring inside this radius, fed by the significant molecular gas reservoir.
-
•
Gas kinematics reveal streaming motions related to the =1 perturbations. A first analysis of these perturbations suggests that the inner =1 instabilities may be fast trailing waves which have developed between corotation and an Outer Lindblad Resonance (OLR). This would imply that the AGN is probably not being generously fueled in the current epoch. An estimate of the radial variation of the mean gravitational torques due to the stellar potential confirms independently that stellar perturbations are inefficient to drive AGN fueling.
-
•
Arms I and II are both self-gravitating perturbations characterized by low values of the Toomre parameter (=1–2). There are also indications that the CND lopsided instability is self-gravitating (2–3).
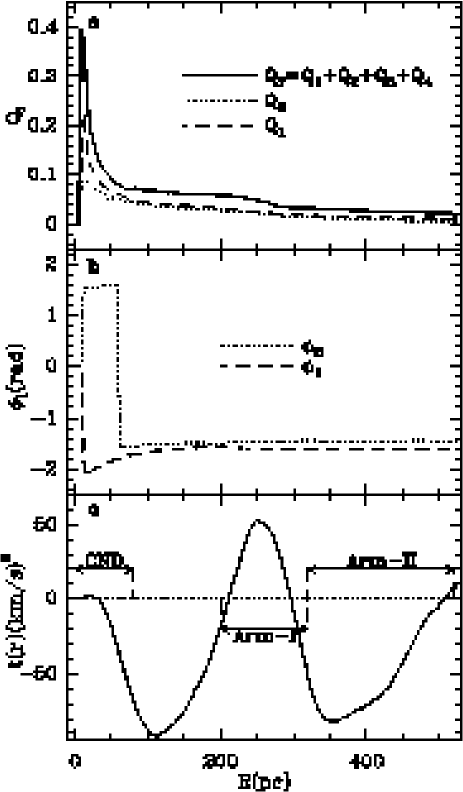
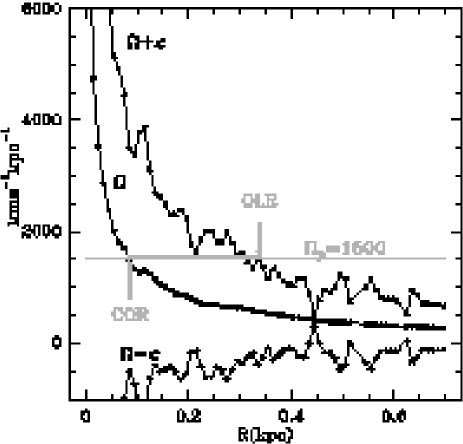
The two-stream flow instabilities, expected in counter-rotators, cannot explain the ubiquity of =1 perturbations in the inner disk of the Evil Eye. Mechanisms other than counter-rotation have been suggested to trigger =1 instabilities, such as interactions with companions (Weinberg 1994; Lovelace et al. 1999), central potentials dominated by massive black holes (Miller & Smith 1992; Taga & Iye 1998; Bacon et al. 2001) and response to an asymmetric halo (Jog 1997). Although pure =1 modes are uncommon in galaxy disks, kinematic lopsidedness has been reported in 50 of spirals (Richter & Sancisi 1994). The self-consistent numerical simulations made by Junqueira & Combes (1996) showed that above a threshold central gas concentration, a typical galaxy disk (including stars and gas) is prone to develop one-arm (trailing) spiral perturbations. The strongest =1 modes in their models appear between their corotation and their OLRs; in other words, these perturbations are fast. Fast =1 trailing modes are decoupled from outer disk perturbations which only have 1/10 the speed of the inner waves. According to Junqueira & Combes (1996), the fast =1 modes might reflect the action of the modal amplification mechanism described by Shu et al. (1990). The modes are excited by a slight off-centering of the stars and gas in the galaxy nucleus and develop mainly in the gas disk between corotation and OLR. In summary, the inner =1 perturbations identified in the gas disk of NGC 4826 could be tentatively explained by this scenario if the pattern speed of the perturbation is tuned to high enough values. As shown in Fig. 17, a value of 1500 km s-1 kpc-1 would push corotation well inside the disk, accounting for the spatial extent of Arm I in NGC 4826.
7.1 A possible scenario for the evolution of the inner kiloparsec of NGC 4826
While it appears that counter-rotation is not driving modes in the inner 1.5 kpc disk of NGC 4826 at present, a past gas accretion episode must be invoked to explain the decoupling of HI in the outer disk. Furthermore, the formation of compact/truncated star forming disks in counter-rotators, such as the one we see in NGC 4826, could represent the final stage of a process involving large-scale collisions between the accreted gas and the primary gas of the accretor (Rubin 1994, Thakar et al 1997, García-Burillo et al 2000). In general, the two components may have opposite angular momenta, implying substantial dissipation when they mix and, eventually, transformation from atomic to molecular phase in shocks. Large amounts of gas may fall towards the nucleus and form a circumnuclear gas disk, whose final size will depend on the ratio of initial angular momenta of the two components. In close agreement with this picture, the kinematics of ionized gas reveal an orderly infall of gas from R=2 kpc to 800 pc in NGC 4826 (Rubin 1994). Moreover, the measured [NII]/H ratio is close to 1 in this transition region, strongly suggesting shock excitation (Rubin 1994). In the course of this process, massive star formation is triggered along the “ridge” and in the nuclear disk. The time-scale for gas infall may be short and similar to the dynamical time, i.e., 107-8yr. This estimate is consistent with the age of the stellar clusters inferred from their colors.
The stellar velocities measured in the nucleus of NGC 4826 also imply a recent large mass infall episode. Kormendy (1993) has discussed NGC 4826 as an example of an early-type spiral with an anomalously low stellar velocity dispersion for its bulge luminosity (=905 km s-1, later confirmed by Rix et al 1995). The expected value of for NGC 4826 predicted by the Faber-Jackson relation would be 160 km s-1. As argued by Kormendy (1993), this indicates that the central brightness is dominated by a cold disky component. The formation of this cold central disk, in contrast to standard hot bulges, might be related to secular evolutionary processes involving large mass accretion.
Once the gas has settled in the nuclear disk, normal secular evolution can proceed. The onset of =1 instabilities of the type described in NGC 4826 may be a consequence of secular evolution in disks with large gas masses. Detailed numerical simulations to be presented in a forthcoming paper (García-Burillo et al. 2003 in prep) will study the onset and evolution of asymmetric modes for a case similar to NGC 4826, where the role of self-gravity of the gas may be essential.
Acknowledgements.
We acknowledge the IRAM staff from the Plateau de Bure and from Grenoble for carrying out the observations and help provided during the data reduction. This paper has been partially funded by the Spanish MCyT under projects DGES/AYA2000-927, ESP2001-4519-PE and ESP2002-01693, and European FEDER funds.References
- (1) Bacon R., Emsellem E., Combes F., Copin Y., Monnet G., & Martin P. 2001, A&A, 371, 409
- (2) Bekki, K., & Couch, W. J. 2001, ApJ, 557, L19
- (3) Bertola, F., & Corsini, E. M. 1999 in Proceedings of IAU Symposium 186: Galaxy Interactions at Low and High Redshift, ed. J. E. Barnes, & D. B. Sanders, 149
- (4) Bettoni, D., Galletta, G., García-Burillo, S., & Rodríguez-Franco, A. 2001, A&A, 374, 421
- (5) Billett, O. H., Hunter, D. A., & Elmegreen, B. G. 2002, AJ, 123, 1454
- (6) Block, D. L., Witt, A. N., Grosbol, P., Stockton, A., & Moneti, A. 1994, A&A, 288, 383
- (7) Bohlin, R. C., Savage, B. D., & Drake, J. F. 1978, ApJ, 224, 132
- (8) Böker, T., Calzetti, D., Sparks, W., Axon, D., Bergeron, L. E. et al. 1999, ApJS, 124, 95
- (9) Braine, J., Combes, F., Casoli, F. et al 1993, A&AS, 97, 887
- (10) Braun, R., Walterbos, R. A. M., & Kennicutt, R. C. 1992, Nature, 360, 442
- (11) Braun, R., Walterbos, R. A. M., Kennicutt, R. C., & Tacconi, L. J. 1994, ApJ, 420, 558
- (12) Buta R., & Combes F. 1996, Fundamental of Cosmic Physics, 17, 95
- (13) Casoli, F., & Gerin, M. 1993, A&A, 279, L41
- (14) Casoli, F., Dickey, J., Kazes, I. et al. 1996, A&AS, 116, 193
- (15) Combes, F. 1988, in Galactic and Extragalactic Star Formation, ed. R.E. Pudritz & M. Fich, Kluwer, 475
- (16) Combes, F. 2001, in World Scientific, Advanced Lectures on the Starburst-AGN Connection, ed. by I. Aretxaga, D. Kunth, & R. Mújica, 223
- (17) Comins, N. F., Lovelace, R. V. E., Zeltwanger, T., & Shorey, P. 1997, ApJ, 484, L33
- (18) de Jong, R. S. 1996, A&A, 313, 377
- (19) Elmegreen, B. G., Elmegreen, D. M., Brinks, E. et al. 1998, ApJ, 503, L119
- (20) Englmaier, P., & Shlosman, I. 2000, ApJ, 528, 677
- (21) Friedli, D., & Martinet, L. 1993, A&A, 277, 27
- (22) García-Burillo, S., Guélin, M., Cernicharo, J. 1993, A&A, 274, 123
- (23) García-Burillo, S., Sempere, M. J., & Bettoni, D. 1998, ApJ, 502, 235
- (24) García-Burillo, S., Sempere, M. J., Combes, F., Hunt, L. K., & Neri, R. 2000, A&A, 363, 869
- (25) García-Burillo, S., Combes, F., Eckart, A. et al. 2003, in ASP Conf. Ser., Active Galactic Nuclei: from Central Engine to Host Galaxy, ed. S. Collin, F. Combes,& I. Shlosman, 423.
- (26) Guilloteau, S., Delannoy, J., Downes, D. et al. 1992, A&A, 262, 624
- (27) Guilloteau, S., & Lucas, R. 2000, in ASP Conf. Ser.: Imaging at Radio through Submillimeter Wavelengths, ed. J. G. Mangum & S. J. E. Radford, vol. 299
- (28) Heckman, T. M., Smith, E. P., Baum, S. A. et al. 1986, ApJ, 311, 526
- (29) Heckman, T. M., Blitz, L., Wilson, A. S., Armus, L., & Miley, G. K. 1989, ApJ, 342, 735
- (30) Helfer, T. T., & Blitz, L. 1997, ApJ, 478, 162
- (31) Helfer, T. T., Thornley, M. D., Regan , M. W. et al. 2003, ApJS, in press
- (32) Heller, C. H., Shlosman, I 1994, ApJ, 424, 84
- (33) Ho, L. C., Filippenko, A. V., & Sargent, W. L. W. 1997, ApJS, 112, 315
- (34) Holtzman, J. A., Burrows, C. J., Casertano, S., Hester, J., Trauger, J. T., Watson, A. M., & Worthey, G. 1995, PASP, 107, 1065
- (35) Jog, C. J. 1997, ApJ, 488, 642
- (36) Jogee, S., Baker, A. J., Sakamoto, S., Scoville, N. Z., & Kenney, J. D. P. 2001, in ASP Conf. Ser., The Central Kiloparsec of Starbursts and AGN, ed. by J. H. Knapen, J. E. Beckman, I. Shlosman, & T. J. Mahoney, vol. 249, 612
- (37) Junqueira, S., & Combes, F. 1996, A&A, 312, 703
- (38) Kenney, J.D., & Young, J.S. 1988, ApJS, 66, 261
- (39) Kormendy, J. in Proceedings of IAU Symposium 153: Galactic Bulges, ed. H. Dejonghe & H. J. Habing 1993, 209
- (40) Kormendy, J., & Bender R. 1999, ApJ, 522, 772
- (41) Leitherer, C. 1990, ApJS, 73, 1
- (42) Leitherer, C., Schaerer, D., Goldader, J. D. et al. 1999, ApJS, 123, 3
- (43) Lequeux, J. 1983, A&A, 125, 394
- (44) Lovelace, R. V. E., Jore, K. P., & Haynes, M. P. 1997, ApJ, 475, 83
- (45) Lovelace, R. V. E., Zhang, L., Kornreich, D. A., & Haynes, M. P. 1999, ApJ, 524, 634
- (46) Martini, P., & Pogge, R. W. 1999, AJ, 118, 2646
- (47) Miller, R. H., & Smith, B. F. 1992, ApJ, 393, 508
- (48) O’Connell, R. W., Gallagher, J. S. III, Hunter, D. A., & Colley, W. N. 1995, ApJ, 446, L1
- (49) Osterbrock, D. W. 1989, Astrophysics of Gaseous Nebulae and Active Galactic Nuclei, University Science Books, Mill Valley, CA (USA)
- (50) Pierini, D., Majeed, A., Boroson, T. A., & Witt, A. N. 2002, ApJ, 569, 184
- (51) Piner, B. G., Stone, J. M., & Teuben, P. J. 1995, ApJ, 449, 508
- (52) Pringle, J. 1996, MNRAS, 281, 357
- (53) Regan, M. W., & Mulchaey, J. S. 1999, AJ, 117, 2676
- (54) Regan, M. W., Thornley, M. D., Helfer, T. T., et al. 2001, ApJ, 561, 218
- (55) Richter, O.-G., & Sancisi, R. 1994, A&A, 290, L9
- (56) Rix, H.-W. R, Kennicutt, R. C., Braun, R., & Walterbos, R. A. M. 1995, ApJ, 438, 155
- (57) Rubin, V. 1994, AJ, 107, 173
- sak (99) Sakamoto, K., Okumura, S. K., Ishizuki, S., & Scoville, N. Z. 1999, ApJS, 124, 403
- (59) Schinnerer, E., Eckart, A., & Tacconi, L. J. 2000a, ApJ, 533, 826
- (60) Schinnerer, E., Eckart, A., Tacconi, L. J. et al. 2000b, ApJ, 533, 850
- (61) Shlosman, I., Frank, J., & Begelman, M. C. 1989, Nature, 338, 45
- (62) Shu, F. H., Milione, V., & Roberts, W. W. Jr. 1973, ApJ, 183, 819
- (63) Shu, F. H., Tremaine, S., Adams, F. C., & Ruden, S. P. 1990, ApJ, 358, 49
- (64) Solomon, P. M., & Barrett, J. W. 1991, in Proceedings of the 146th Symposium of the IAU, Dynamics of Galaxies and Their Molecular Cloud Distributions, ed. F. Combes & F. Casoli (Kluwer Academic Publishers, Dordrecht), 235
- (65) Taga, M., & Iye, M. 1998, MNRAS, 299, 111
- (66) Thakar, A. R., Ryden, B. S., Jore, K. P., & Broeils, A. H. 1997, ApJ, 479, 702
- (67) Toomre, A. 1964, ApJ, 139, 1217
- (68) Tully, B. 1988, Nearby Galaxies Catalog (Cambridge University Press, Cambridge and New York)
- (69) Turner, J. L., & Ho, P. T. P. 1994, ApJ, 421, 122
- (70) Vila-Vilaró, B., Taniguchi , Y., & Nakai, N. 1998, AJ, 116, 1553
- (71) Walterbos, R. A. M., Braun, R., & Kennicutt, R. C. 1994, ApJ, 107, 184
- (72) Weinberg, M. D. 1994, ApJ, 421, 481
- (73) Whitmore, B. C., Miller, B. W., Schweizer, F., & Fall, S. M. 1997, AJ, 114, 1797
- (74) Witt, A. N., Lindell, R. S., Block, D. L., & Evans, R. 1994, ApJ, 427, 227
- (75) Young, J. S., Xie, S., Tacconi, L. et al. 1995, ApJS, 98,219