COBE Observations of the Cosmic Infrared Background
Abstract
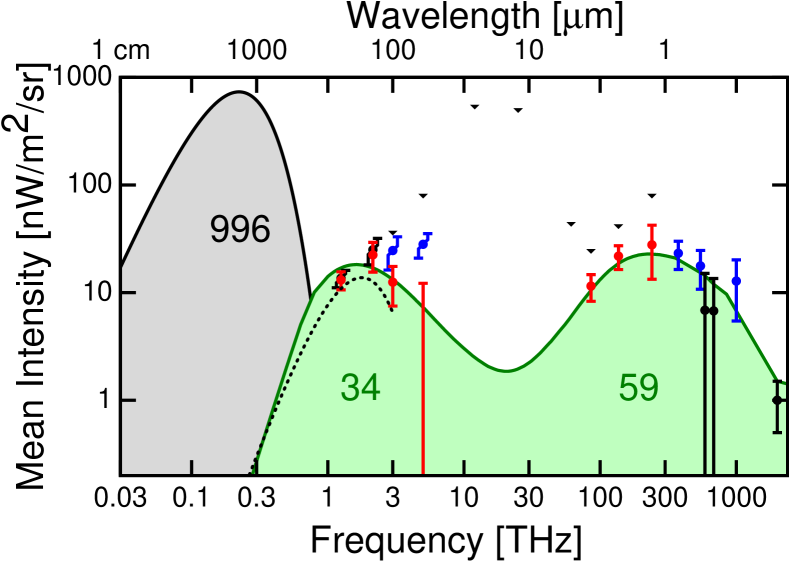
The Diffuse InfraRed Background Experiment (DIRBE) on the COsmic Background Explorer (COBE) measured the total infrared signal seen from space at a distance of 1 astronomical unit from the Sun. Using time variations as the Earth orbits the Sun, it is possible to remove most of the foreground signal produced by the interplanetary dust cloud [zodiacal light]. By correlating the DIRBE signal with the column density of atomic hydrogen measured using the 21 cm line, it is possible to remove most of the foreground signal produced by interstellar dust, although one must still be concerned by dust associated with H2 (molecular gas) and H II (the warm ionized medium). DIRBE was not able to determine the Cosmic InfraRed Background (CIRB) in the 5-60 m wavelength range, but did detect both a far infrared background and a near infrared background. The far infrared background has an integrated intensity of about 34 nW/m2/sr, while the near infrared and optical extragalactic background has about 59 nW/m2/sr. The Far InfraRed Absolute Spectrophotometer (FIRAS) on COBE has been used to constrain the long wavelength tail of the far infrared background but a wide range of intensities at 850 m are compatible with the FIRAS data. Thus the fraction of the CIRB produced by SCUBA sources has large uncertainties in both the numerator and the denominator.
keywords:
cosmic background;infrared1 Introduction
The Diffuse InfraRed Background Experiment (DIRBE) on the COsmic Background Explorer(COBE) satellite was designed to measure the Cosmic Infrared Background (CIRB). The results from the DIRBE team’s analysis of the DIRBE data are described in hauser/etal:1998 . These depend in a very fundamental way on the model for the zodiacal or interplanetary dust cloud that was fit to the variation of the DIRBE signal as a function of solar elongation kelsall/etal:1998 . But this zodiacal model leaves a large residual intensity at 25 m which must be due to underestimating the zodiacal background, at least at 25 m. New models wright:1998 ; gorjian/wright/chary:2000 which address this problem are used here to derive new lower values for the CIRB.
Other approaches finkbeiner/davis/schlegel:2000 that use only a small fraction of the DIRBE data to derive a zodiacal model have given higher values for the CIRB. These results are unlikely to be true, but the dominant systematic uncertainty in deriving the CIRB from observations taken 1 AU from the Sun remains the uncertainty in fitting the zodiacal light.
| m] | |||
| This paper | FDS | Hauser et al. | |
| 1.25 | – | ||
| 2.2 | – | ||
| 3.5 | – | ||
| 60 | |||
| 100 | |||
| 140 | – | ||
| 240 | – | ||
| m] | ||
|---|---|---|
| 1.25 | 4.10 | 1.71 |
| 2.2 | 3.23 | 2.37 |
| 3.5 | 1.34 | 1.56 |
| 4.9 | 0.55 | 0.90 |
| 12 | 0.63 | 2.53 |
| 25 | 0.41 | 3.43 |
| 60 | 1.43 | 28.6 |
| 100 | 2.64 | 87.9 |
| 140 | 3.39 | 158. |
| 240 | 1.14 | 90.9 |
2 The CIRB
The DIRBE team zodiacal light model kelsall/etal:1998 leaves nearly 2 MJy/sr at 25 m in dark regions of the sky. This is about 6% of the zodiacal signal, and gives a reasonable estimate of the uncertainty in the zodiacal modeling. This residual intensity corresponds to about 1 photon/cm3/octave. The lack of a huge -ray absorption at 10 TeV energy implies that most of this residual intensity is in fact due to errors in modeling the zodiacal light. If I add a requirement that the mean high galactic latitude residual intensity should be zero to the standard DIRBE zodiacal light modeling, then I get a model gorjian/wright/chary:2000 with a different geometrical shape for the zodiacal cloud which gives different estimates for the zodiacal light in all DIRBE bands, not just the 25 m band. Using these new estimates for the zodiacal light, the value of the estimated CIRB at 100 m changes from , which was only quoted as an upper limit in hauser/etal:1998 , to the lower values given in Table 1 and shown on Figure 1. This change has a moderate effect on the estimated 140 m CIRB as well, but very little effect at 240 m.
Using a statistical argument wright/reese:2000 or ground-based observations gorjian/wright/chary:2000 ; wright/johnson:2001 to remove the galactic foreground stars allows one to derive estimates instead of upper limits in the short wavelength bands. The net result is a CIRB with nearly twice as much energy in the near infrared and optical bump as in the far infrared bump. The very common statement that the far infrared CIRB is larger than the near infrared and optical CIRB is an error caused by using the lower limits given by source counts as actual intensities. Optical work bernstein/freedman/madore:2002 shows the same effect: the measured background is about twice the lower limit derived from source counts. This is presumably due to the faint fuzzy edges of galaxies being missed in total flux calculations wright:2001 .
3 Milky Way Flux
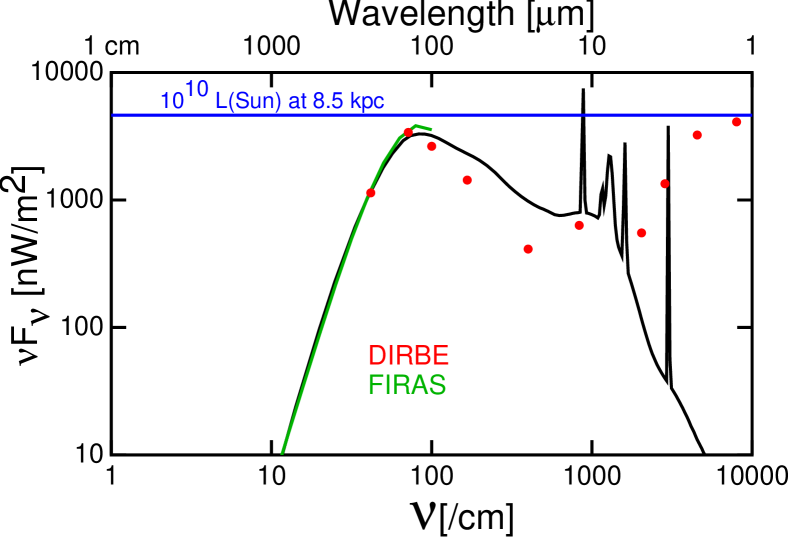
One quantity easily derivable from the DIRBE and FIRAS maps is the flux of the Milky Way. There is some ambiguity due to the fact that we are located inside the Milky Way, but the definition of the flux is easy to compute:
| (1) |
This is tabulated in Table 2 and plotted in Figure 2. Note that the power in the near infrared is slightly larger than in the far infrared. This is significant since the exactly edge-on orientation of the Milky Way in our sky strongly suppresses the near infrared flux. Thus the Milky Way has a much larger luminosity in the near infrared than the far infrared. Galaxies near such as the Milky Way should dominate the integrated extragalactic background light, so the fact that the near infrared bump in the CIRB is larger than the far infrared bump is easily understood.

| m]) | m]) | |||
|---|---|---|---|---|
| -7.921 | -1.921 | 1.154 | 0.269 | |
| -4.523 | -1.046 | 1.270 | 0.298 | |
| -0.824 | 0.176 | 1.445 | 0.446 | |
| -0.451 | 0.985 | 1.980 | 1.102 | |
| -0.287 | 1.164 | 2.150 | 1.231 | |
| -0.076 | 1.321 | 2.265 | 1.261 | |
| 0.107 | 1.358 | 2.384 | 1.227 | |
| 0.234 | 1.336 | 2.476 | 1.151 | |
| 0.375 | 1.239 | 2.576 | 1.003 | |
| 0.525 | 1.052 | 2.676 | 0.704 | |
| 0.891 | 0.474 | 3.376 | -2.122 | |
| 1.037 | 0.317 | 5.276 | -10.250 |
4 FIRAS Limits on the sub-mm Background
The final analysis fixsen/etal:1996 of the FIRAS low frequency channel data on the Cosmic Microwave Background (CMB) showed a spectrum with rms residuals from a blackbody of 50 ppm of the peak, or 20 kJy/sr. How is this result compatible with SCUBA results that claim to see an integrated intensity from source counts of 86 kJy/sr smail/etal:1998 ? One explanation is that later more extensive observations borys/etal:2003 give lower source counts and kJy/sr for mJy. A second explanation is that the FIRAS analysis for CMB distortions was designed to be insensitive to any foreground that had the spectral shape of the Milky Way. Thus the CIRB at 850 m can be quite large if the CIRB spectrum is similar to the Milky Way spectrum.
Equation (3) from fixsen/etal:1996 gives this model for small deviations of the CMB from a blackbody:
| (2) |
where describes some distortion. In order to see how compatible different models for the cosmic sub-mm background are with the FIRAS low frequency channel data, I compute the following:
| (3) |
with being the covariance matrix, and let be the sub-mm background intensity at 850 m, while gives the shape of the spectrum. Thus is the spectrum normalized to the 850 m value. Figure 3 shows the vs. curves for four different models of the sub-mm background. The two models with the high values of have the best and the worst , while the models with lower intensities at 850 m have marginal ’s. The model with the highest is the analytic fit from fixsen/etal:1998 , but this model was designed to fit the peak of the CIRB near 200 m, and not the faint low SNR region near 850 m. Table 3 gives the values of vs. for the model with the best in Figure 3. I designed the shape of this model near 850 m to make it compatible with the FIRAS limits. This is also the curve shown in Figure 1. Clearly more work is needed to determine , and this requires a better indicator of the total galactic column density including all types of matter: H I, H II, and H2.
5 Discussion
I have presented here results from the DIRBE and FIRAS observations of the CIRB and the Milky Way. Both the Milky Way and the CIRB show a bigger peak in the near infrared than in the far infrared. The total intensity is nearly 10% of the power in the CMB blackbody. While the CIRB is probably the integrated light from many unresolved galaxies, there is a discrepancy between galaxy photometry and the near infrared and optical CIRB, with the directly measured CIRB being about two times brighter than the intensity from source counts. The most probable explanation of this discrepancy is undercounting the faint outer parts of galaxies.
References
- (1) Bernstein, R., Freedman, W. & Madore, B., Astrophysical Journal 571, (2002) 56.
- (2) Borys, C., Chapman, S., Halpern, M. & Scott, D., MNRAS in press, astro-ph/0305444.
- (3) Dube, R. R., Wicks, W. C. & Wilkinson, D. T., Astrophysical Journal Letters 215 (1977) L51.
- (4) Dwek, E., Arendt, R. G., Hauser, M. G., Fixsen, D., Kelsall, T., Leisawitz, D., Pei, Y. C., Wright, E. L., Mather, J. C., Moseley, S. H., Odegard, N., Shafer, R., Silverberg, R. F. & Weiland, J. L., Astrophysical Journal 508 (1998) 106.
- (5) Finkbeiner, D., Davis, M. & Schlegel, D., Astrophysical Journal 544 (2000) 81.
- (6) Fixsen, D. J., Cheng, E. S., Gales, J. M., Mather, J. C., Shafer, R. A. & Wright, E. L., Astrophysical Journal 473 (1996) 576.
- (7) Fixsen, D., Dwek, E., Mather, J. Bennett, C. & Shafer, R., Astrophysical Journal 508 (1998) 123.
- (8) Gorjian, V., Wright, E. & Chary, R., Astrophysical Journal 536 (2000) 550.
- (9) Hauser, M. G., Arendt, R. G., Kelsall, T., Dwek, E., Odegard, N., Weiland, J. L., Freudenreich, H. T., Reach, W. T., Silverberg, R. F., Moseley, S. H., Pei, Y. C., Lubin, P., Mather, J. C., Shafer, R. A., Smoot, G. F., Weiss, R., Wilkinson, D. T. & Wright, E. L., Astrophysical Journal 508 (1998) 25.
- (10) Hurwitz, M., Bowyer, S. & Martin, C., Astrophysical Journal 372 (1991) 167.
- (11) Kelsall, T., Weiland, J. L., Franz, B. A., Reach, W. T., Arendt, R. G., Dwek, E., Freudenreich, H. T., Hauser, M. G., Moseley, S. H., Odegard, N. P., Silverberg, R. F. & Wright, E. L., Astrophysical Journal 508 (1998) 44.
- (12) Lagache, G., Abergel, A., Boulanger, F., Desert, F. X. & Puget, J. L., Astronomy & Astrophysics, 344 (1999) 322.
- (13) Primack, J., Bullock, J., Somerville, R. & MacMinn, D., Astroparticle Physics 11 (1999) 93.
- (14) Puget, J.-L., Abergel, A., Bernard, J.-P., Boulanger, F., Burton, W., Désert, F.-X. & Hartmann, D., Astron. Astrophys. 308 (1996) 5.
- (15) Smail, I., Ivison, R., Blain, A. & Kneib, J.-P., astro-ph/9810281 (1998).
- (16) Toller, G. N., Astrophysical Journal Letters 266 (1983) L79.
- (17) Wright, E. L., Astrophysical Journal 496 (1998) 1.
- (18) Wright, E. & Reese, E., Astrophysical Journal 545 (2000) 43.
- (19) Wright, E. & Johnson, B. astro-ph/0107205 (2001).
- (20) Wright, E. L., Astrophysical Journal Letters 556 (2001) L17.