X-ray observations of the compact central object in supernova remnant G347.3–0.5
Abstract
We present Chandra, XMM-Newton and RXTE observations of 1WGA J1713.4–3949, a compact source at the center of the galactic supernova remnant (SNR) G347.3–0.5. The X-ray spectrum of the source is well-fitted by the sum of a blackbody component with a temperature of keV plus a power law component with photon index . We found no pulsations down to 4% in the 0.01–0.16 Hz range and down to 25% in the 0.01-128 Hz range. This source resembles other compact central objects (CCOs) in SNRs, and we suggest that 1WGA J1713.4–3949 is the associated neutron star for G347.3–0.5. We also measured the properties of the adjacent radio pulsar PSR J1713–3945 with a 392 ms period and show that it is not associated with 1WGA J1713.4–3949 nor, most probably, with SNR G347.3–0.5 as well.
1 INTRODUCTION
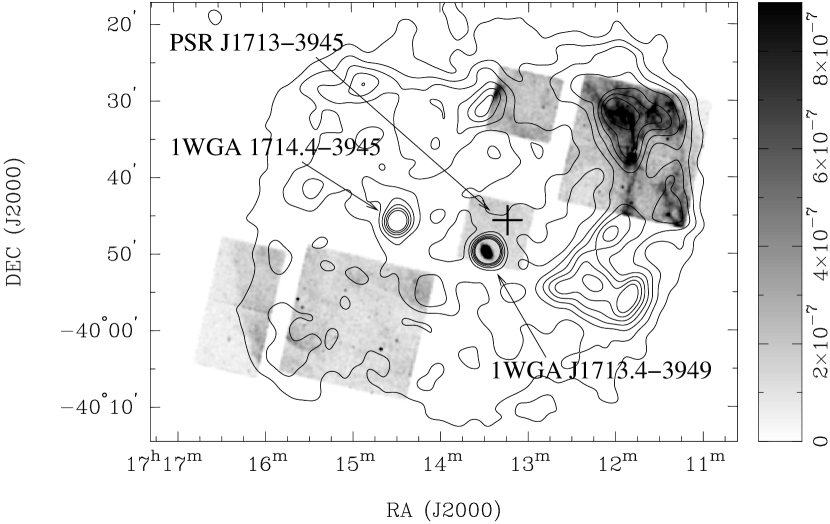
For many years it has been well known that pulsars — compact remains of supernova explosions — are rapidly rotating, highly magnetized neutron stars (NSs). However, sources discovered in recent years have shown that NSs also appear to come in other varieties: even more highly magnetized objects with slow spins, such as anomalous X-ray pulsars (AXPs) and soft gamma-ray repeaters (SGRs) (e.g., Mereghetti, 1998; Thompson, 2000), and more poorly understood objects near the centers of SNRs with detectable X-ray flux, but no optical/radio counterparts or signs of rotation, so-called compact central objects (CCOs; Pavlov et al., 2002). Their spectra are very soft, with blackbody temperatures keV, often requiring additional power law component with photon indices of (Pavlov et al., 2002). In this article we address the nature of 1WGA J1713.4–3949, a compact source located at the center of the SNR G347.3-0.5 (RX J1713.73946). Early ROSAT observations identified two point sources within the boundaries of the SNR shell (Pfeffermann & Aschenbach, 1996, ; see also Figure 1). The source further away from the center of the remnant, 1WGA J1714.43945, was determined to be of stellar origin (Pfeffermann & Aschenbach, 1996). For the other source, 1WGA J1713.43949, located at the geometrical center of the SNR, no optical counterpart has been found within 10″ of the ROSAT position (Slane et al., 1999), and the source has correspondingly been suggested to be a candidate for an associated neutron star. While ASCA observations were not able to provide useful limits to the pulsations in the X-ray band (Slane et al., 1999), radio pulsations were detected with a 392 ms period within a 7′ radius region towards this source (PSR J1713–3945 Crawford et al., 2002).
1WGA J1713.4–3949 has been observed with the Chandra X-ray Observatory as a part of a project to study nonthermal radio and X-ray emission from the SNR shell (Lazendic et al., 2003). In this paper we present a detailed spectral and timing analysis of 1WGA J1713.4–3949 using our Chandra data, as well as archival data from the XMM-Newton and RXTE satellites. We also present properties of the radio pulsar PSR J1713–3945, which imply it is not related to 1WGA J1713.4–3949 or SNR G347.3–0.5.
2 OBSERVATIONS
Two fields towards G347.30.5 were observed on 2000 July 25 with the Advanced CCD Imaging Spectrometer (ACIS) detector on board the Chandra X-ray Observatory (ObsID 736 and 737). The ACIS-I detector for ObsID 736 was positioned at the bright northwestern rim of the SNR and the roll angle was such that 1WGA J1713.4–3949 fell on the S1 chip (see Figure 1). Data were taken in timed exposure mode with an integration time of 3.2 s per frame. The fully processed Level 2 data were reduced using standard threads in the CIAO software package version 2.2.1. The effective exposure time after data processing was 29.6 ks. The exposure-corrected Chandra image of the SNR and the compact source 1WGA J1713.4–3949 is shown in Figure 1, with the ROSAT contours overlaid. The image was binned in pixels and smoothed with a Gaussian filter with a FWHM of 2″. The image of the compact source is elongated because its location is well off-axis ( 23′) from the aim point.
We obtained archival XMM data of 1WGA J1713.4–3949 carried out on 2001 March 2 with a 15 ks exposure (ObsID 0093670501; see also Cassam-Chenai et al., 2003). The European Photon Imaging Camera (EPIC)-pn camera was operated in Extended Full Frame mode with time resolution of 199 ms, while the two EPIC-MOS cameras were operated in Full Frame mode with a time resolution of 2.6 s. The EPIC data reduction was performed using the SAS software package version 5.4.1. The event files used for analysis were created from observational data files (ODFs) using the SAS tasks epchain and emchain. The net exposure time after filtering event files for good time intervals was 9.2 ks in the pn camera and 14.1 ks in each MOS camera.
We used archival data of SNR G347.3–0.5 (Pannuti et al., 2003) from the Proportional Counter Array (PCA) aboard the RXTE satellite, which is sensitive to X-ray photons in the energy band 2–60 keV and has a field of view with radius °. While the PCA has no imaging capability, it has a large effective area (6000 cm2) which makes it suitable for searching for faint X-ray pulsations. Observations of G347.3–0.5 were made in 7 separate intervals between 1999 June 14–24, with a total exposure time of 100 ks. Analysis of the RXTE data was carried out using LHEASOFT software version 5.2.
A 392-ms radio pulsar, PSR J17133945, was discovered in a 20 cm targeted search for pulsations in SNR G347.3–0.5 using the Parkes telescope and multibeam receiver. The details of the search and discovery are outlined in Crawford et al. (2002). The pulsar was subsequently timed with the multibeam receiver at Parkes to obtain astrometric and spin parameters and to determine whether the pulsar was associated with 1WGA J1713.4–3949.
3 ANALYSIS AND RESULTS
3.1 Spectral Analysis
For the spectral analysis of the Chandra data, we extracted the source counts from a elliptical region around the compact source, and for the background region we used a elliptical region north of the source. We obtained background-subtracted counts for the source and the spectrum was grouped to contain at least 25 counts per bin. Residuals from fitting standard continuum models to the source spectrum (blackbody, bremsstrahlung and power law) revealed an apparent change in the gain calibration on chip S1 that results in a spurious absorption feature around 2 keV. We extracted data from the on-board calibration source taken before and after our observation, and these show that there is indeed a gain shift for this CCD of %. However, we found that the fit parameters did not change significantly when the gain was frozen at this 3.5% value or when it was left as a free parameter. We thus allowed gain to vary in our models (see Table 1).
For spectral analysis of the XMM data, we obtained background-subtracted counts from the pn camera, and 5 () in the MOS1 (MOS2) camera. In the pn camera, the counts were extracted from a 27″ radius circular region around the source, and for the background extraction we used a box north from the source position inside the same CCD chip. Similarly, in the MOS1 (MOS2) camera we used 22″ (19″) radius circular region for the source and (22) radius circular region on the same chip for the background. The spectra were also grouped to contain at least 25 counts per bin. We performed a joint spectral analysis of the three EPIC data sets, allowing only the relative normalization to vary. The results obtained were consistent with those obtained from the Chandra spectrum. We therefore proceeded with a joint spectral analysis of Chandra and XMM spectra.
The results from fitting a few typical neutron star models are summarized in Table 1 and a fit example is given in Figure 2. Fits with the bremsstrahlung and blackbody models gave equally acceptable results, while the power law model gave a somewhat higher reduced . The steep photon index of excludes the possibility that 1WGA J1713.4–3949 is a background active galactic nucleus (AGN), which typically have photon indices of 1.2–2.2 (Turner & Pounds, 1986). The best-fit column density () in the power law model of cm-2 is also somewhat higher than the value of cm-2 found towards the SNR (Lazendic et al., 2003). On the other hand, a blackbody model yields cm-2, which is a lower value than found towards the SNR. The blackbody fit is improved by adding a power law component, which also results in an value consistent with that found towards the SNR. In this composite spectrum the unabsorbed source luminosity is erg s-1, adopting a distance of kpc to the SNR (Slane et al., 1999). The blackbody normalization yields a relatively small emitting area with radius km, which is significantly smaller than the canonical value for the NS radius of 10 km. This could imply that most of the thermal emission originates from the polar caps on the NS surface, while the thermal component from the rest of the NS surface is too faint to be detected.
The small inferred radius may be due, at least partly, to oversimplification of the thermal emission from the NS by the blackbody model. More appropriate models that take into account the NS atmosphere (NSA) yield lower NS temperatures, which in turn correspond to larger NS radii (e.g., Zavlin, Pavlov, & Shibanov, 1996). To investigate this, we fit our spectra with two NSA models. The NSA model by Gänsicke, Braje, & Romani (2002) is calculated for weakly magnetic NS ( G) and considers hydrogen, solar or iron compositions of the atmosphere. The NSA model by Pavlov et al. (1995) assumes the standard magnetic field strength ( G) and hydrogen atmosphere. Both models assume a standard NS mass of 1.4. Both hydrogen models gave acceptable residuals and yielded emitting region sizes close to 10 km, with corresponding reductions in the NS temperature. For either model, however, the derived temperature is above the expected surface temperature for a cooling neutron star more than several hundred years old. Model atmospheres with solar abundance or iron composition gave unacceptable fits predicting broad absorption features not present in the spectra.
3.2 Timing Analysis
We used a Fast-Fourier Transform (FFT) to search the X-ray data for pulsations from 1WGA J1713.4–3949, but found no pulsed signal; we list upper limits on the pulsed fraction and the search parameters in Table 2. The upper limit from RXTE data is least constraining because 1WGA J1713.4–3949 only accounts for 0.6% of the total flux in the RXTE’s large field of view.
To derive the timing properties of the radio pulsar PSR J1713-3945 the TEMPO timing package111http://pulsar.princeton.edu/tempo was used on a total of 27 times-of-arrival (TOAs) with the JPL DE200 planetary ephemeris (Standish, 1990). The TEMPO package converts each TOA to the solar system barycenter then refines the timing parameters by minimizing residuals between observed and model TOAs over the observation span. The resulting timing parameters are presented in Table 3. The pulsar’s dispersion measure (DM) of 337 pc cm-3 yields an estimated distance of 4.3 kpc using the revised DM-distance model of Cordes & Lazio (2002).
4 DISCUSSION
The position of the 1WGA J1713.4–3949 determined from the XMM data is R.A (J2000) , Decl. (J2000) (with an uncertainty of ). Using our 20 cm radio data of SNR G347.3–0.5 obtained with Australia Telescope Compact Array (Lazendic et al., 2003), we found no radio counterpart for 1WGA J1713.4–3949, and derive a 5 upper limit for a point source flux of 3 mJy. This is similar to the limit derived towards the CCO in Puppis A (Gaensler, Bock, & Stappers, 2000). There is no apparent optical emission at the location of 1WGA J1713.4–3949 in the Digitized Sky Survey222DSS was produced at the Space Telescope Science Institute under U.S. Government grant NAG W-2166. image, which has an upper limit of mag.
While the distance to the radio pulsar PSR J1713–3945 is broadly consistent with the SNR distance of kpc estimated by Slane et al. (1999), the pulsar is likely to be quite old ( Myr, compared to kyr for SNR G347.3–0.5) and does not have sufficient spin-down luminosity ( erg s-1) to power the observed X-ray flux from 1WGA J1713.4–3949 ( erg s-1). The newly determined radio timing position of the pulsar is in declination away from the position of 1WGA J1713.4–3949 (see Figure 1). PSR J17133945 is therefore spatially coincident with SNR G347.3–0.5 by chance, and there is likely no physical association between the two systems. We detected no X-ray source at the position of PSR J1713–3945 in Chandra or XMM data. Adopting cm-3 (by scaling the value for the SNR to the 4.3 kpc distance of this pulsar), we derive an upper limit on the luminosity in the 0.5–10.0 keV band of erg s-1 for nonthermal emission with a photon index , and an upper limit on the temperature of 82 eV for blackbody emission from a 10-km radius NS.
The lack of radio and optical counterparts for 1WGA J1713.4–3949, the absence of X-ray pulsations with the current sensitivity and time resolution, the two-component spectrum and its associated luminosity are properties consistent with CCOs (Pavlov et al., 2002).
If this CCO is an accretion powered NS, we can consider two scenarios: accretion from a fallback disk or a low-mass companion. The fallback disk has been suggested to form from residual material after the SNR explosion (e.g., Chevalier, 1989) and has been used to explain and unify the properties of various types of NSs (Alpar, 2001). However, limits derived from optical and infrared observations seem to disfavor this model, at least for some types of NSs (e.g., Kaplan et al., 2002). X-ray monitoring, in conjunction with optical and infrared limits, can be used to establish if the NS is variable and thus likely to be accreting from a low-mass companion. Indeed, variability and a period of 6.4 h has been reported for one of the CCOs, J1617–5102 in SNR RCW 103, on which basis this CCO is claimed to be a binary (Sanwal et al., 2002). Comparing the unabsorbed X-ray flux of 1WGA J1713.4–3949 obtained from Chandra and XMM data for a blackbody fit with that of ASCA data ( erg cm-2 s-1; Slane et al., 1999), we find no long-term ( yr) variability in 1WGA J1713.4–3949.
Interpretations of the emission from CCOs as thermal radiation from the surface of a NS run into problems due to high surface temperatures and small emitting areas derived from the blackbody model fits. The temperature we derived from the blackbody model of 0.4 keV is much higher that the temperature predicted by the standard cooling model (Page & Sarmiento, 1996), while the temperature derived from the NSA models (0.2 keV) would imply an NS age of 100–1000 yr, which is less than the estimated 20–40 kyr age of the SNR (Slane et al., 1999).
In the case that CCOs are rotation powered NSs, the non-detection of radio pulsations can be explained by unfavorable beaming orientation. One of the objects, 1E 1207.4–5209 in SNR G296.5+10.0, that was originally identified as a CCO, has been found to have a period of 424 ms with faint pulsed fraction (7.6%; Zavlin et al., 2000). Our limits on pulsed fraction from 1WGA J1713.4–3949 are consistent with those derived towards other CCOs (7–15%; e.g., Pavlov et al., 2002). Our limits indicate that 1WGA J1713.4–3949 is probably not an AXP, which are generally found to have spin periods between 6–12 s and pulse fractions of 10–70% (e.g., Mereghetti, 1998).
In summary, the nature of the compact central object in SNR G347.3–0.5 remains uncertain. Future observations are planned to help determine the exact nature of this source. Pointed Chandra observations are needed to provide a more accurate position and to enable a search for an optical counterpart, while deeper timing observations can search for periods substantially shorter than available from the current data.
References
- Alpar (2001) Alpar, M. A. 2001, ApJ, 554, 1245
- Cassam-Chenai et al. (2003) Cassam-Chenai, G., Decourchelle, A., Ballet, J., Sauvageot, J.-L., Dubner, G., 2003, A&A, in preparation
- Chevalier (1989) Chevalier, R. A. 1989, ApJ, 346, 847
- Cordes & Lazio (2002) Cordes, J. M. & Lazio, T. J. M. 2002, preprint, astro-ph/0207156
- Crawford et al. (2002) Crawford, F., Pivovaroff, M. J., Kaspi, V. M., & Manchester, R. N. 2002, ASP Conf. Ser. 271: Neutron Stars in Supernova Remnants, eds. P. O. Slane & B. M. Gaenlser, 37
- Gaensler, Bock, & Stappers (2000) Gaensler, B. M., Bock, D. C.-J., & Stappers, B. W. 2000, ApJ, 537, L35
- Gänsicke, Braje, & Romani (2002) Gänsicke, B. T., Braje, T. M., & Romani, R. W. 2002, A&A, 386, 1001
- Gotthelf, Petre, & Vasisht (1999) Gotthelf, E. V., Petre, R., & Vasisht, G. 1999, ApJ, 514, L107
- Kaplan et al. (2002) Kaplan, D. L., Kulkarni, S. R., Frail, D. A., & van Kerkwijk, M. H. 2002, ApJ, 566, 378
- Lazendic et al. (2003) Lazendic, J., Slane, P., Gaensler, B., Plucinsky, P., Hughes, J. & Reynolds, S., 2003, ApJ, submitted
- Mereghetti (1998) Mereghetti, S. 1998, Memorie della Societa Astronomica Italiana, 69, 819
- Pannuti et al. (2003) Pannuti, T., Allen, G., Houck, J., Sturner, S. 2003, ApJ, 593, in press
- Page & Sarmiento (1996) Page, D. & Sarmiento, A. 1996, ApJ, 473, 1067
- Pavlov et al. (1995) Pavlov, G. G., Shibanov, Y. A., Zavlin, V. E., & Meyer, R. D. 1995, in: The Lives of the Neutron Stars, eds. M. A. Alpar, U. Kiziloglu, & J. van Paradijs (Kluwer: Dordrecht) p.71.
- Pavlov et al. (2002) Pavlov, G. G., Sanwal, D., Garmire, G. P., & Zavlin, V. E. 2002, ASP Conf. Ser. 271: Neutron Stars in Supernova Remnants, eds. P. O. Slane & B. M. Gaenlser, 247
- Pfeffermann & Aschenbach (1996) Pfeffermann, E. & Aschenbach, B. 1996, Röntgenstrahlung from the Universe, eds. Zimmermann, H.U., Trümper, J., and Yorke, H., MPE Report 263, 267
- Sanwal et al. (2002) Sanwal, D., Garmire, G. P., Garmire, A., Pavlov, G. G., & Mignani, R. 2002, American Astronomical Society Meeting, 200, #72.01
- Standish (1990) Standish, E. M. 1990, A&A, 233, 252
- Slane et al. (1999) Slane, P., Gaensler, B. M., Dame, T. M., Hughes, J. P., Plucinsky, P. P., & Green, A. 1999, ApJ, 525, 35
- Thompson (2000) Thompson, C. 2000, ASP Conf. Ser. 202: IAU Colloq. 177: Pulsar Astronomy - 2000 and Beyond, 669
- Turner & Pounds (1986) Turner, T. J. & Pounds, K. A. 1986, MNRAS, 240, 833
- Vaughan et al. (1994) Vaughan, B. A. et al. 1994, ApJ, 435, 362
- Zavlin, Pavlov, & Shibanov (1996) Zavlin, V. E., Pavlov, G. G., & Shibanov, Y. A. 1996, A&A, 315, 141
- Zavlin et al. (2000) Zavlin, V. E., Pavlov, G. G., Sanwal, D., & Trümper, J. 2000, ApJ, 540, L25
| Model | /dof | Gainbba linear gain shift included for fitting the Chandra data | |||||
|---|---|---|---|---|---|---|---|
| ( cm-2) | (keV) | (km) | (%) | ( erg cm-2 s-1) | |||
| BREMSS | 7.0 | 0.92 | – | – | 1.07/675 | 5.1 | 9.4 |
| POW | 10.7 | – | 4.2 | – | 1.44/675 | 4.6 | 3.2 |
| BB | 3.6 | 0.40 | – | 2.5 | 1.25/675 | 6.0 | 4.5 |
| POW+BB | 8.0 | 0.38 | 3.9 | 2.4 | 1.05/670 | 7.1 | 1.4(0.3) |
| POW+NSA(G)ddNSA model by Gänsicke, Braje, & Romani (2002) for weak magnetic field of G | 7.3 | 0.18 | 3.7 | 13.0 | 1.07/670 | 5.5 | 1.1(0.4) |
| POW+NSA(Z)eeNSA model by Pavlov et al. (1995) for standard magnetic field of G | 8.1 | 0.26 | 3.8 | 15.8 | 1.22/667 | 5.1 | 1.5(0.3) |
| Detector | Time | Frequency range | limitaafractional pulsation upper limit to 99% confidence level calculated according to Vaughan et al. (1994) |
|---|---|---|---|
| resolution | searched | ||
| ACIS-S1 | 3.2 s | 0.01–0.16 Hz | 12% |
| EPIC-MOSbbfrom combined MOS1 and MOS2 data | 2.6 s | 0.01–0.19 Hz | 12% |
| EPIC-pn | 199 ms | 0.01–2.5 Hz | 4% |
| PCAcccalculated from FFT of two separate intervals of days of data with gaps | 4 ms | 0.01–128 Hz | 25% |
| Parameter | ValueaaValues in parentheses represent the 1 uncertainty in the least significant digit quoted. |
|---|---|
| R.A. (J2000) | |
| Decl. (J2000) | |
| Period, (ms) | 392.451769234(8) |
| Period derivative, () | 5.7380(5) |
| Dispersion Measure, DM (pc cm-3) | 337(3) |
| Epoch of period (MJD) | 52165.0 |
| rms residual (ms) | 1.1 |
| Number of TOAs | 27 |
| Timing span (Days) | 1200 |
| Characteristic agebb, (Myr) | 1.08 |
| Surface magnetic fieldcc G, where is in seconds, ( G) | 1.52 |
| Spin-down luminositydd, with g cm2 assumed, (erg s-1) | 3.74 |