The Effects of UV Continuum and Lyman Radiation on the Chemical Equilibrium of T Tauri Disks
Abstract
We show in this Letter that the spectral details of the FUV radiation fields have a large impact on the chemistry of protoplanetary disks surrounding T Tauri stars. We show that the strength of a realistic stellar FUV field is significantly lower than typically assumed in chemical calculations and that the radiation field is dominated by strong line emission, most notably Lyman radiation. The effects of the strong Lyman emission on the chemical equilibrium in protoplanetary disks has previously been unrecognized. We discuss the impact of this radiation on molecular observations in the context of a radiative transfer model that includes both direct attenuation and scattering. In particular, Lyman radiation will directly dissociate water vapor and may contribute to the observed enhancements of CN/HCN in disks.
1 Introduction
Over the past few years it has become evident that the protoplanetary disks surrounding newly formed stars contain a rich evolving chemistry, which is a vital ingredient in the overall structure and dynamics of the disk. Because the dominant molecule (H2) is unexcited at the cold temperatures (T 10 – 70 K) characteristic of most of the disk mass, trace species provide cooling for upper layers that are unable to radiate via H2 emission. Moreover, the most promising process for the required angular momentum transport is via the magnetorotational instability (Balbus & Hawley 1991). This process is critically tied to the abundance of charged particles that is set by the penetration of energetic radiation and chemical reactions (Gammie 1996, Stone et al. 2000).
At present, emission from CO has been detected in many systems (Dutrey et al., 1996; Koerner, 1997), while emission from other less abundant and more complex molecular species has only been detected in a handful of sources (Kastner, Zuckerman, Weintraub, & Forveille, 1997; Dutrey, Guilloteau, & Guelin, 1997; Goldsmith, Langer, & Velusamy, 1999; Qi, 2001). Analysis of the observations reveals that the molecular emission is arising primarily from the disk surface and that chemistry controlled by energetic ultraviolet (UV) and X-ray radiation (which dissociates molecules and is active on surfaces) must contribute to the observed abundances (Aikawa & Herbst, 1999; Willacy & Langer, 2000; van Zadelhoff et al., 2001).
Chemical models of these systems have been developed to examine the impact of stellar and interstellar (ISRF) FUV radiation on the chemistry at the disk surface (Aikawa & Herbst, 1999; Willacy & Langer, 2000; Aikawa et al., 2002; van Zadelhoff et al., 2002). These models typically assume that the stellar FUV field has the same wavelength dependence as the ISRF, and it is stronger than the ISRF at 100 AU. However, in this paper we argue that the strength of the FUV radiation field from a typical accreting T Tauri star (TTS) is much weaker than previously assumed and show that the observed stellar spectra do not have the same wavelength dependence as the ISRF.
In addition, the presence of strong line radiation, especially Lyman , has yet to be recognized in chemical models and may have important effects. For instance, nearly all T Tauri disks detected so far appear to have large ratios of CN relative to HCN (Dutrey et al. 1997; Kastner et al. 1997; Qi 2001). These two species are linked to Lyman radiation because the main dissociative photoabsorption channels for CN are shortward of 1150 Å (Nee & Lee 1985); in contrast, HCN will be subject to photodissociation by Lyman photons near 1216 Å (Nuth & Glicker 1982). The high CN/HCN ratio has been attributed to the photodissociation by continuum FUV radiation from the star or the interstellar medium (Aikawa et al. 1999; Willacy & Langer 2000; van Zadelhoff et al. 2002). However, strong Lyman fluxes may also contribute to elevate the CN/HCN ratio and to the preferential destruction of other species including water vapor.
In this Letter we use FUV data of TTS to construct a FUV radiation field which is representative of low mass T Tauri stars with average accretion properties. Using this field, we examine its effect on the chemical equilibrium on the proto-planetary disk surface.
2 The FUV spectrum of Classical T Tauri stars
In most calculations of chemical equilibrium in TTS disk to date it has been assumed that the stellar FUV flux is times higher than the ISRF at R = 100 AU (Willacy & Langer 2000; Aikawa et al. 2001). This value is taken from Herbig & Goodrich (1986) IUE observations of T Tau and RY Tau. The FUV spectra below 2000 Å of these two stars is similar with Å-1, yielding a flux at = 100 AU integrated over 1000 Å of Habing (1 Habing ; Tielens & Hollenbach 1985). However, there are reasons to expect that these spectra do not represent the typical FUV flux of TTS. For one thing, T Tau and RY Tau have larger masses and radii than typical TTS, and thus are not representative of the class (Kenyon & Hartmann, 1995). In addition, the mass accretion rate in their disks is (Calvet et al. 2003, in preparation), higher than the mean TTS mass accretion rate, (Hartmann et al., 1998). This is important, because the luminosity in the FUV scales with accretion luminosity (Calvet et al. 2003).
We now have a much better knowledge of the FUV fields characteristic to TTS. Figure 1 shows the FUV spectrum of BP Tau, a TTS with mass, radius, , and age (0.5, 2 , , and 2 Myr; Gullbring et al. 1998) typical of the class. The observations were obtained in HST program GO9081 and are reported elsewhere (Calvet et al. 2003b, in preparation). The low resolution (G140L) spectrum has been scaled to 100 AU, using 140 pc as the distance of Taurus (Kenyon, Dobrzycka, & Hartmann, 1994), and corrected for reddening using the interstellar law and = 0.5 (Gullbring et al. 1998).
We also show in Figure 1 the spectrum of the 10 Myr old star TW Hya, from Herczeg et al. (2002). This star has a mass of 0.8 , a radius of 1 (Webb et al. 1999) and a mass accretion rate (Alencar & Batalha 2002). The flux from TW Hya suffers little or no reddening, but has been scaled by 3.5 to match the continuum of BP Tau.111This is consistent with the ratio of their mass accretion rates, allowing for intrinsic variability and uncertainties of the mass accretion rate determination. Comparison between the spectra of BP Tau and TW Hya indicates that the shape of the continuum is roughly similar. More differences can be seen in the strength of the emission lines which permeate the spectra. These are lines of highly ionized metals, He, and Hydrogen Lyman series (Valenti, Johns-Krull, & Linsky, 2000; Ardila et al., 2002). The largest difference can be seen in Lyman , shown in the right inset in Figure 1. The core of the line is lost to absorption in the line of sight to BP Tau. We also show the Lyman profile of CY Tau, a star with similar parameters to BP Tau (Gullbring et al. 1998), but a lower reddening, = 0.3, so more of the Lyman core can be seen. Still, the flux in Lyman is much lower than that of TW Hya. This comparison indicates variations of more than a factor of 10 are expected in the flux of the Lyman line among T Tauri stars.
With this information, we have constructed a composite FUV spectrum that is representative of the low mass T Tauri stars, which constitute the largest fraction of the newly born young stars. The adopted spectrum is equal to that of BP Tau between 1150 and 2000 Å, and to the scaled TW Hya FUSE spectrum down to 950 Å. Below 950 Å, we assume a linear extension with the same slope as the continuum. For the chemical calculations in §5, we integrate the adopted spectrum in 10 Å bins.
We show in Figure 1 the ISRF scaled by 540 to match the total luminosity of the adopted spectrum between 900 and 1700 Å.222To make this comparison, we have used the expression for the interstellar field energy density from Draine (1978) as given by Eq. (23) of Draine & Bertoldi (1996), with . In addition we have adopted the scaling , which matches the interstellar field as estimated by Habing (1968). This field is lower by a factor of 1.71 than the one given by , with from van Dishoeck (1987). We have then used , with the solid angle, to compare with the observed flux. The overall strength of the representative TTS FUV continuum spectrum at 100 AU is of the order of a few hundred Habing, significantly lower than generally assumed. In addition, Figure 1 shows that the representative FUV spectra differs from the interstellar field in several ways: (1) the shape of the continuum is different in the sense that the TTS spectra rises as wavelength increases; (2) the TTS spectra is dominated by emission lines, which carry at minimum 35 % of the flux.333 For BP Tau and TW Hya lines carry, respectively, at least 35% and 85% of the luminosity between 1100–1700 Å. These percentages are lower limits because of interstellar and wind absorption of Lyman photons.
3 Disk Model
For the calculations in this paper, we adopt a disk model which fits the median spectral energy distribution (SED) for classical (accreting) T Tauri stars (TTS) in the Taurus clouds (D’Alessio, Calvet, & Hartmann, 2001). Typical stellar parameters are adopted, , and K (Gullbring et al., 1998; Hartmann et al., 1998), and the mass accretion rate used, , is near the average in Taurus (Hartmann et al., 1998). Dust grains were assumed to be segregate spheres of compounds with abundances as in Pollack et al. (1994), and with a size distribution given by , where the grain radius varies between m and 1 mm. The disk outer radius is 350 AU; with this, and 0.05, the mass of the disk is 0.03 .
We self-consistently solve the complete set of vertical structure equations, including irradiation and viscous heating, resulting in detailed profiles of temperature and density with vertical height and disk radius. Figure 2 shows the vertical profiles of temperature and column density for the adopted disk model at a radius = 100 AU, which will be used in the discussions of the following sections.
4 Transfer of FUV radiation
We follow the transport of FUV radiation through the disk using an analytical approximation that allows for the inclusion of scattering in addition to pure absorption (see also van Zadelhoff et al., 2002). We assume that stellar radiation at an ultraviolet wavelength comes in a single beam which makes an angle to the local surface , defined by the condition , where is the radial optical depth. We follow standard procedures for solving the transfer equations in the plane-parallel approximation444 This is justified because of the small geometrical thickness of the disk (cf. D’Alessio et al. 1999).. We assume that there is no local emission at . Along the original beam, defined by 555At R = 100 AU Å) = 0.07., the mean intensity decreases as , where is the vertical optical depth. A nearly isotropic diffuse field is created by photons scattered out of the beam. Following Mihalas (1978), we solve the transfer equations for symmetric and antisymmetric averages of the specific intensity and , from which we can derive with usual boundary conditions the depth dependence of the mean intensity as
| (1) |
where
| (2) |
and is the albedo. The first term in Eq. (1) corresponds to the direct incoming beam that is rapidly attenuated due to the oblique angle of incidence. The second term is the diffuse scattered radiation field which penetrates deeper than the direct radiation. The mean intensity at = 1500 Å, normalized to the stellar intensity at the same wavelength, is shown in Figure 3a, where each contribution is shown separately. Similarly to the models of van Zadelhoff et al. (2002), the scattered field penetrates much closer to the midplane than the direct attenuated stellar component. This holds true to within a few hundred AU of the star.
The stellar specific intensity in Eq. (1) can be estimated assuming that the beam carries a flux equal to the observed flux , so . Figure 3b shows the mean intensity at = 1500 Å and = 100 AU from Figure 3a, scaled by calculated from the continuum flux at 1500 Å in Figure 1. We also plot for comparison the mean intensity corresponding to the ISRF (1 Habing) impinging on the disk surface with in Eq.(1). It can be seen that the stellar field dominates in the upper 30 AU in the disk, while it becomes comparable or smaller than the interstellar field closer to the midplane (Willacy & Langer, 2000; van Zadelhoff et al., 2002). However, TTS in Taurus have a mean extinction along the line of sight (Kenyon & Hartmann, 1995), which corresponds to an attenuation 16 in the UV; the corresponding mean intensity is shown in Figure 3b. Moreover, radiation in the lines can be much higher than in the continuum (cf. Figure 1). Therefore, the stellar field is expected to be the dominant contributor to the FUV field illuminating the disk (see Aikawa & Herbst, 2001).
5 Lyman and Molecular Photodissociation
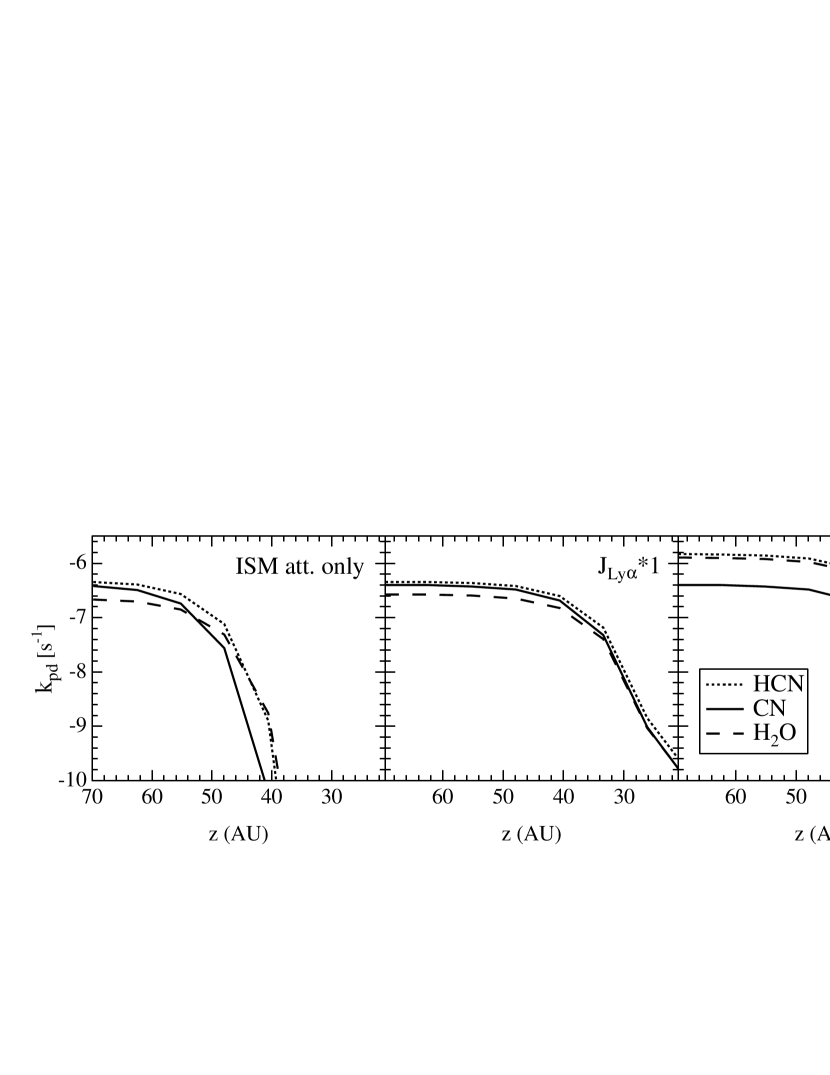
Using the observed radiation field in Figure 1 we can examine the effects of Lyman on the photodissociation of CN, HCN, and H2O. To calculate the photodissociation rate we use the following expression
| (3) |
For the radiative transfer we use the procedure of §4 and the disk model in §3. In this calculation the Lyman flux is initially assumed to be a constant value between the peaks of the red and blue damping wings of the CY Tau profile (Figure 1 right, §2). As this is a lower limit, in one case we increase the flux of the Lyman feature between 1205 - 1230 Å by a factor of 10. This increases the total UV flux by a factor of three. For comparison we provide the corresponding photodissociation rate from a scaled interstellar FUV field that is attenuated only (i.e. without a scattered contribution, similar to Willacy & Langer 2000).
Our results are given in Figure 4. Two main factors are noticed in this plot. (1) For all species the inclusion of scattering allows for greater FUV penetration than in models which simply attenuate a parameterized ISRF (van Zadelhoff et al. 2002). (2) For HCN and H2O the presence of an enhanced Lyman radiation field can increase photodissociation. Because of the difference in photodissociation channels, CN will exist over a larger range of vertical distances within the disk than either HCN or H2O.
6 Discussion
While the primary photoabsorption bands for CO and H2 lie short of 1100 Å numerous other molecules will be subject to photodissociation by Lyman radiation (e.g. OH, CH4, NH3; Lepp & Dalgarno, 1996). Thus, the presence of Lyman photons can impact the chemistry on the disk surface beyond the CN/HCN ratio. Indeed FUV radiation will be of increasing importance in disk planet forming regions and Lyman emission may be an important factor in limiting the abundance of water vapor. Young stars are also show evidence for significant emission from X-rays, which can ionize and dissociate H2 molecules. This process results in the creation of an in situ Lyman radiation field that can further alter the chemistry (Lepp & Dalgarno, 1996).666 Several effects can moderate the importance of Lyman radiation. The presence of a large column of hydrogen atoms will predominantly scatter Lyman photons. This will result in the destruction of some photons through dust absorption. Using the calculations of Bonilha et al. (1979) we estimate that NH cm-2 is required to significantly attenuate the emission. In the inner disk, a water column of cm-2 will be sufficient to extinguish the Lyman line core radiation; larger columns are needed to absorb both line core and wing emission. This will not happen in the outer disk, where water is frozen on grains. Finally, H2 atoms can also absorb Lyman photons resulting in fluorescence emission.
Furthermore the FUV radiation field representative of low mass T Tauri stars with an average mass accretion rate is weaker than generally assumed in chemical calculations. The origin of the excess FUV flux is still under investigation, but in the study of a sample of HST/STIS spectra, the luminosity in the FUV is found to scale with the accretion luminosity (Calvet et al. 2003, in preparation). Since the mass accretion rates of the objects with the majority of molecular detections, DM Tau and LkCa15, are comparable and below that of BP Tau, respectively (Hartmann et al., 1998), this suggests that the FUV radiation field in these objects may be similar or weaker than BP Tau. With the stronger FUV field current models are capable of reproducing observed abundances of species such as CN and HCN in DM Tau (Aikawa et al. 2002); assuming a weaker FUV field may make it difficult to continue to match observations, but strong Lyman radiation can provide an additional source of photodissociation to power the chemistry.
References
- Aikawa et al. (2002) Aikawa, Y., van Zadelhoff, G. J., van Dishoeck, E. F., & Herbst, E. 2002, A&A, 386, 622
- Aikawa & Herbst (2001) Aikawa, Y. & Herbst, E. 2001, A&A, 371, 1107
- Aikawa & Herbst (1999) Aikawa, Y. & Herbst, E. 1999, A&A, 351, 233
- Alencar & Batalha (2002) Alencar, S. H. P. & Batalha, C. 2002, ApJ, 571, 378
- Ardila et al. (2002) Ardila, D. R., Basri, G., Walter, F. M., Valenti, J. A., & Johns-Krull, C. M. 2002, ApJ, 566, 1100
- Balbus & Hawley (1991) Balbus, S. A. & Hawley, J. F. 1991, ApJ, 376, 214
- Bonilha et al. (1979) Bonilha, J. R. M., Ferch, R., Salpeter, E. E., Slater, G., & Noerdlinger, P. D. 1979, ApJ, 233, 649
- Chan et al. (1993) Chan, W.F., Cooper, G., & Brion, C.E. 1993, Chem. Phys. 178, 387
- D’Alessio et al. (1999) D’Alessio, P., Calvet, N., Hartmann, L., Lizano, S. and Cantó, J. 1999, ApJ, 527, 893
- D’Alessio, Calvet, & Hartmann (2001) D’Alessio, P., Calvet, N., & Hartmann, L. 2001, ApJ, 553, 321
- Draine & Bertoldi (1996) Draine, B. T. & Bertoldi, F. 1996, ApJ, 468, 269
- Draine (1978) Draine, B. T. 1978, ApJS, 36, 595
- Dutrey, Guilloteau, & Guelin (1997) Dutrey, A., Guilloteau, S., & Guelin, M. 1997, A&A, 317, L55
- Dutrey et al. (1996) Dutrey, A., Guilloteau, S., Duvert, G., Prato, L., Simon, M., Schuster, K., & Menard, F. 1996, A&A, 309, 493
- Gammie (1996) Gammie, C. F. 1996, ApJ, 457, 355
- Goldsmith, Langer, & Velusamy (1999) Goldsmith, P. F., Langer, W. D., & Velusamy, T. 1999, ApJ, 519, L173
- Gullbring et al. (1998) Gullbring, E., Hartmann, L., Briceño, C, & Calvet, N. 1998, ApJ, 492, 323
- Hartmann et al. (1998) Hartmann, L., Calvet, N., Gullbring, E., & D’Alessio, P. 1998, ApJ, 495, 385
- Habing (1968) Habing, H. J. 1968, Bull. Astron. Inst. Netherlands, 19, 421
- Herbig & Goodrich (1986) Herbig, G. H. & Goodrich, R. W. 1986, ApJ, 309, 294
- Herczeg et al. (2002) Herczeg, G. J., Linsky, J. L., Valenti, J. A., Johns-Krull, C. M., & Wood, B. E. 2002, ApJ, 572, 310
- Kastner, Zuckerman, Weintraub, & Forveille (1997) Kastner, J. H., Zuckerman, B., Weintraub, D. A., & Forveille, T. 1997, Science, 277, 67
- Kenyon & Hartmann (1995) Kenyon, S.J.,& Hartmann, L. 1995, ApJS, 101,117
- Kenyon, Dobrzycka, & Hartmann (1994) Kenyon, S. J., Dobrzycka, D., & Hartmann, L. 1994, AJ, 108, 1872
- Koerner (1997) Koerner, D. W. 1997, Origins of Life and Evolution of the Biosphere, 27, 157
- Lavendy, Gandara, & Robbe (1984) Lavendy, H., Gandara, G, & Robbe, J.M. (1984), J. Mol. Spec., 106, 395
- Lepp & Dalgarno (1996) Lepp, S. & Dalgarno, A. 1996, A&A, 306, L21
- Mihalas (1978) Mihalas, D. 1978, Stellar Atmospheres (San Francisco:Freeman)
- Millar, Farquhar, & Willacy (2000) Millar, T. J., Farquhar, P. R. A., & Willacy, K. 2000, VizieR Online Data Catalog, 412, 10139
- Nee & Lee (1985) Nee, J. B. & Lee, L. C. 1985, ApJ, 291, 202
- Nuth & Glicker (1982) Nuth, J. A. & Glicker, S. 1982, Journal of Quantitative Spectroscopy and Radiative Transfer, 28, 223
- Pollack, et al. (1994) Pollack, J. B., Hollenbach, D., Beckwith, S., Simonelli, D. P., Roush, T. & Fong, W. 1994, ApJ, 421, 615 (P94)
- Qi (2001) Qi, C. 2001, Ph.D. Thesis, Caltech
- Stone et al. (2000) Stone, J. M., Gammie, C. F., Balbus, S. A., & Hawley, J. F. 2000, Protostars and Planets IV, 589
- Tielens & Hollenbach (1985) Tielens, A. G. G. M. & Hollenbach, D. 1985, ApJ, 291, 722
- Valenti, Johns-Krull, & Linsky (2000) Valenti, J. A., Johns-Krull, C. M., & Linsky, J. L. 2000, ApJS, 129, 399 bibitem[van Dishoeck(1987)]1987IAUS..120…51V van Dishoeck, E. F. 1987, IAU Symp. 120: Astrochemistry, 120, 51
- van Zadelhoff et al. (2001) van Zadelhoff, G.-J., van Dishoeck, E. F., Thi, W.-F., & Blake, G. A. 2001, A&A, 377, 566
- van Zadelhoff et al. (2002) van Zadelhoff, G.-J., Aikawa, Y., Hogerheijde, M.R., & van Dishoeck, E.F., (2002), A&A, in press
- Webb et al. (1999) Webb, R. A., Zuckerman, B., Platais, I., Patience, J., White, R. J., Schwartz, M. J., & McCarthy, C. 1999, ApJ, 512, L63
- Willacy & Langer (2000) Willacy, K. & Langer, W. D. 2000, ApJ, 544, 903
- Yoshino et al. (1996) Yoshino, K., Esmond, J.R., Parkinson, W.H., Ito, J., & Matsui, T. 1996, Chem. Phys., 211, 387