The X-ray afterglow of GRB030329
We report on XMM-Newton and Rossi-XTE observations of the bright (fluence 10-4 erg cm-2) and nearby (z=0.1685) Gamma-Ray Burst GRB030329 associated to SN2003dh. The first Rossi-XTE observation, 5 hours after the burst, shows a flux decreasing with time as a power law with index 0.90.3. Such a decay law is only marginally consistent with a further Rossi-XTE measurement (at t-t30 hr). Late time observations of this bright afterglow at X–ray wavelengths have the advantage, compared to optical observations, of not being affected by contributions from the supernova and host galaxy. A first XMM-Newton observation, at t-t37 days, shows a flux of 4 erg cm-2 s-1 (0.2-10 keV). The spectrum is a power law with photon index =1.9 and absorption 2.5 cm-2, consistent with the Galactic value. A further XMM-Newton pointing at t-t61 days shows a flux fainter by a factor 2. The combined Rossi-XTE and XMM-Newton measurements require a break at t0.5 days in the afterglow decay, with a power law index increasing from 0.9 to 1.9, similar to what is observed in the early part of the optical afterglow. The extrapolation of the XMM-Newton spectra to optical frequencies lies a factor of below simultaneous measurements. This is likely due to the presence of SN2003dh.
Key Words.:
Gamma Rays : bursts1 Introduction
A very bright Gamma-Ray Burst (GRB) has been recorded by several satellites on March 29, 2003. The accurate localization obtained with HETE-2 after about 1 hour (Vanderspek et al. (2003); Ricker (2003)) prompted rapid observations that revealed a bright optical transient with R magnitude about 13 (Peterson & Price (2003); Torii (2003)). A redshift of z=0.1685 has been measured for the GRB030329 host galaxy (Greiner et al. (2003); Caldwell et al. (2003)). This is the second smallest redshift determined for a GRB (the smallest one is that of GRB980425, likely associated with SN1998bw at z=0.0085 (Galama et al. (1998)) as supported by recent observations (Pian et al. (2003))). Although the intrinsic luminosity of GRB030329 was in the low end of the distribution for GRBs (see below), its proximity led to a very high fluence for the prompt emission (1.2 erg cm-2, 30-400 keV, Ricker (2003)) and to a bright afterglow which can be studied with unprecedented detail at all wavelengths and over long timescales after the burst explosion. Among the most interesting results reported so far, is the finding of clear spectroscopic signatures of an underlying supernova (Stanek et al. (2003a), Hjorth et al. (2003)), which provides strong evidence for the association between long GRBs and core collapse supernovae.
The early phases of the X–ray afterglow of GRB030329 were observed with two Rossi-XTE pointings obtained 5 hours and 1.24 days after the burst (Marshall & Swank (2003); Marshall et al. (2003)). Unfortunately, no further X–ray data could be collected during the following month. At the beginning of May the GRB position became compatible with the visibility constraints of the XMM-Newton satellite, which performed two observations 37 days and 61 days after the burst. The brightness of GRB030329 , coupled with the large collecting area of XMM-Newton , allow us to study in detail for the first time an X–ray afterglow at such long times after the prompt emission. This is particularly interesting since at these wavelengths we do not expect significant contamination from the underlying supernova and/or host galaxy.
2 Data analysis and results
2.1 RossiXTE
The first Rossi-XTE observation, consisting of two time intervals of duration 1500 s and 500 s, respectively, was done on March 29, about 5 hours after the GRB. The Proportional Counter Array instrument (PCA, Jahoda et al. 1996) aboard Rossi-XTE consists of five Proportional Counter Units (PCU). Only three (n. 0,2 and 3) and two (n.0 and 2) of them were on during the first and second time interval, respectively. Since the instrumental gain is known to vary between PCUs, we separately extracted the spectra from the two time intervals. In order to increase the signal to noise ratio, only the top layer anodes were used in the analysis. The corresponding response matrices were generated using PCARSP V8.0 and the background spectra were estimated with the faint-source model as input to PCABACKEST V3.0. All the errors quoted below are at the 90% confidence level.
Since the source spectral shape did not vary between the two intervals (except for the normalization), we fitted them together, obtaining a best fit with a power law model with photon index =2.17 and absorption N5 cm-2. The average flux in the first interval was Fx=(1.38) erg cm-2 s-1 (2-10 keV). During this observation the flux decreased with time as a power law with index =0.90.3 (see Fig. 1).
A second observation was performed 30 hours after the GRB, on March 30 from 17:30 to 19 UT, with a net observing time of 3500 s. Due to the lower flux, the derived spectral parameters are less constrained. A power law fit yields =1.8, N3.7 cm-2, and Fx=(1 erg cm-2 s-1 (2-10 keV). This flux is smaller than the extrapolation of the power law decay found in the first observation, suggesting the presence of a break in the light curve. A single power law fit to all the Rossi-XTE data gives only a marginally acceptable fit for a slope 1.5 (=7.6 for 3 degrees of freedom (dof)).
Finally, we analyzed an observation carried out on April 6. The afterglow was not detected, with a flux upper limit of 2.6 erg cm-2 s-1 (3).

2.2 XMM-Newton
XMM-Newton observed the position of GRB030329 starting on May 5, 2003 at 12:30 UT, for an observation length of 12 hours. The last part of the observation was affected by high particle background and was therefore excluded from our analysis, resulting in net exposure times of 29 and 32 ks, respectively in the PN and MOS cameras of the EPIC instrument (Strüder et al. (2001); Turner et al. (2001)). All the cameras operated in Full Frame mode and with the thin optical blocking filter. The data were processed using SAS version 5.4.1.
A source with a PN net count rate of 0.018 counts s-1 was detected at R.A. = 10h 44m 49.9s, Dec. = +21∘ 31′ 15′′ (J2000, error radius of 4′′), consistent with the position of GRB030329 . Its flux during the observation is consistent with a constant value (see Fig. 2). A second source of similar intensity (0.022 PN counts s-1) is present at a distance of 30′′ to the NW. Its spectrum (a power law with photon index =1.70.2 and NH=(52) cm-2) and its positional coincidence with a galaxy at z=0.136 (Krisciunas et al. (2003)) indicate that this source is an AGN.
To measure the afterglow spectrum we used an extraction radius of 15′′ in order to minimize the contamination from the AGN. For the extraction of the background spectrum we chose a circular region (radius 15′′) at the same distance from the AGN as the afterglow. This was done to take into account the small contamination from the AGN to the spectrum (we estimate that at most 20% of the counts in the source extraction region could be due to the AGN). The spectra, over the 0.2–10 keV energy range, were rebinned in order to have at least 30 counts per channel. After checking that consistent results were obtained in the three cameras, we fitted jointly the MOS and PN data.
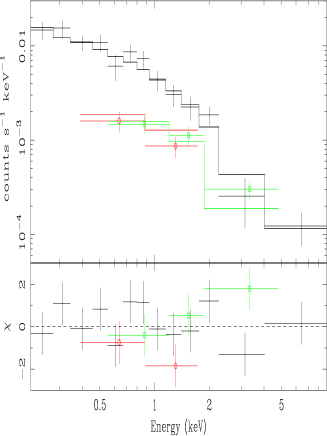
The best fit (=16.5/15, see Fig. 3) was obtained with an absorbed power law with photon index = 1.92, N2.5 cm-2, and flux Fx=(4.20.5) erg cm-2 s-1 (0.2-10 keV). The Galactic absorption in this direction is NH=21020 cm-2 (Dickey & Lockman (1990)). Other simple models, e.g. blackbody, thermal bremsstrahlung, thermal plasma (MEKAL) gave unacceptable fits (the respective values of /dof being 73.5/15, 26.3/15 and 36.8/15).

A second XMM-Newton pointing started on May 28, 2003 at 21:00 UT. It lasted about one day, but it was severely affected by periods of high particle background, which were excluded in our analysis, resulting in about 40 ks of useful data. The analysis was performed as described above for the first observation. The source at the GRB030329 position fainted to Fx=(2.2) erg cm-2 s-1 (0.2-10 keV), thus confirming that it is indeed the GRB afterglow. Its spectrum could be fit by an absorbed power law with = 2.1 and N4.5 cm-2 (/dof=4.5/13). Also in this case a thermal model gave a worse fit (/dof=21.3/13 for a MEKAL).
3 Discussion
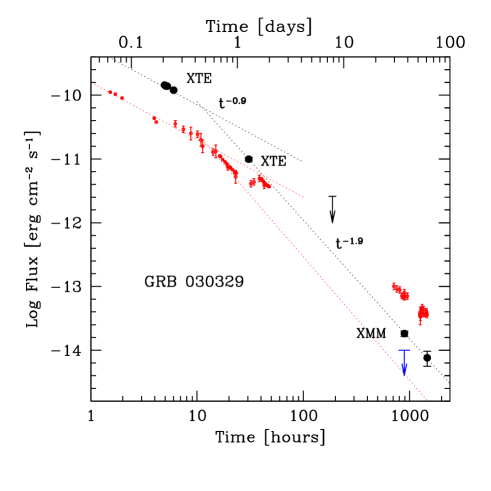
All our measurements of the X–ray afterglow of GRB030329 for the 2-10 keV range are plotted in Fig. 4, where one can see that the break in the afterglow decay suggested by the second Rossi-XTE observation is clearly confirmed by XMM-Newton . While a power law index =0.9 was found during the first Rossi-XTE observation, a fit to the following points gives a slope =1.860.06. We estimate that the break occurred in the time interval 0.3 - 0.8 days, with a most likely value of tbreak=0.45 days. This value is consistent with the time of the break in the optical afterglow (tbreak=0.48 days, Price et al. 2003).
This achromatic break can be readily explained as a “jet–break”, due to the decreasing bulk Lorentz factor , making equal to the jet opening angle (see Rhoads 1999). Following Frail et al. (2001) it is then possible to estimate the opening angle of the jet (), corresponding to at the time of the break. With this opening angle, the “true” energy radiated by the burst in –rays turns out to be erg (see Frail et al. 2001 for the relevant uncertainties concerning these estimates). This value is at the very low end of the distribution found by Frail et al. (2001), making GRB030329 an atypically weak burst. Note also that the optical light curve shows several achromatic “rebrightnenings” and breaks (Granot et al. 2003, and references therein), which weaken the association of the first break with the jet–break. The paucity of the X–ray data does not allow us to infer if the X–ray follows the optical during the several rebrightenings occurring in the optical band, which could help to investigate the origin of such rebrightenings (Lazzati et al. 2002; Granot et al. 2003).
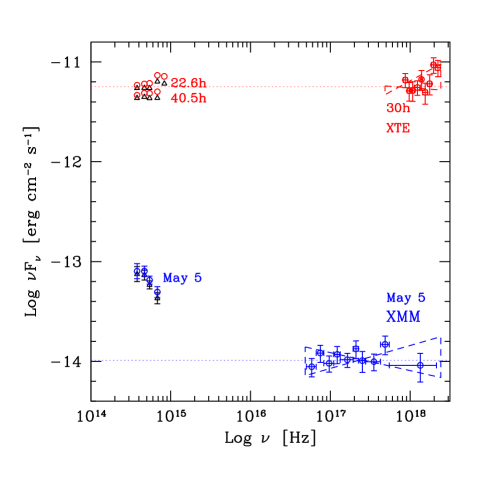
In Fig. 5 we show the simultaneous optical and X–ray spectra corresponding to the second Rossi-XTE and to the first XMM-Newton observation epochs. Since we did not find an exactly simultaneous spectrum at hours after the trigger, we show in Fig. 5 the optical points taken immediately before (22 hours) and after (40 hours) the Rossi-XTE observations. As can be seen, at this epoch the extrapolation of the optical spectrum joins very smoothly the X–ray data, and fits both their normalization and slope. Optical and X–ray fluxes therefore belong to the same spectral segment characterized by (i.e. a flat spectrum in ). This shape can be explained by the standard synchrotron–external shock model (e.g. Sari et al. 1998) as due to a population of relativistic electrons injected in the emitting region with an energy distribution with , with both the optical and X–ray frequencies laying (at 30 hr) above the cooling frequency (this is the frequency produced by those electrons that have just cooled in a dynamical time).
The optical and X–ray decay slopes before and immediately after the break at days are the same (i.e. and ). The first decay slope is consistent with what expected in the case of , slow cooling regime and the cooling frequency below the optical (Panaitescu & Kumar, 2000). In this case the decay index is independent on the density profile. The second decay slope is instead consistent with what expected after the jet break () if the jet matter expands laterally at a velocity close to the speed of light (Rhoads 1999).
The evolution of the high-energy spectrum depends on the behavior in time of the cooling frequency, which in turn depends on the circumburst density profile and on the jet dynamics. Therefore, after 30 hours, there are two possibilities. If the circumburst medium is homogeneous, the cooling frequency decreases as (before the jet break) or remains constant (after the jet break with sideway expansion), leaving the optical to X–ray slope unaltered. Instead, in the case of a wind density profile, the corresponding behaviours are and =const. Only in the wind case before the jet break possibly overtakes the optical band (see e.g. Panaitescu & Kumar 2000). This gives a spectral break between the optical and the X–ray bands, accompanied by a flattening of the optical light curve (due to the appearance of the harder spectral slope in the optical band). We conclude that the optical to X–ray flux ratio of the synchrotron–external shock component either remains fixed or decreases in time.
The optical data of May 5th define a steep (spectral index ) spectrum and lay above the extrapolation of the X–ray spectrum. We interpret this as evidence for a significant contribution, in the optical, of SN2003dh. The X–ray flux can be used to estimate an upper limit to the flux of the optical synchrotron–external shock component (indicated by the dotted line in Fig. 5): erg cm-2 s-1. It is an upper limit if ; in the case of homogeneous circumburst density this becomes the actual value. We conclude that the optical lightcurve, around May 5th, is dominated by the light from the supernova SN2003dh, by at least two magnitudes (see also Fig. 4).
Similar considerations apply to the data at t-tGRB= 61 days, although with larger uncertainties owing to the less constrained XMM-Newton spectral slope.
4 Summary
Thanks to the high sensitivity of XMM-Newton we could study the optical–X–ray SED of the afterglow of GRB030329 and its time evolution up to late times. This is particularly important for this burst due to its association with the supernova 2003dh, which, at late times, contributes to the optical flux (Stanek et al. (2003a), Hjorth et al. (2003)). The early and late time X–ray data, combined with the simultaneous optical detections, have been used to estimate the contributions of the (non–thermal) afterglow and supernova components at optical frequencies.
Our main results are the following:
-
•
The first epoch Rossi-XTE data define an X–ray light curve decaying in time as . This decay index is consistent with the one of the optical flux.
-
•
The two XMM-Newton observations at late epochs yield spectra well fit by a power law with photon index 2,
-
•
The Rossi-XTE and XMM-Newton data, taken together, are consistent with a break in the light curve occurring at 0.5 days, simultaneously with the optical break. After this break the afterglow decays as .
-
•
The optical to X–ray SED at 30 hours strongly indicates that both spectral bands lay on the same branch, above the cooling frequency.
-
•
The optical to X–ray SED on May 5th (and possibly also on May 28th) indicates instead an optical excess that we interpret as due to SN 2003dh, which should dominate (by a factor 10) the non–thermal optical emission.
Acknowledgements.
Based on observations obtained with XMM-Newton, an ESA science mission with instruments and contributions directly funded by ESA Member States and NASA. We are grateful to the XMM-Newton Project Scientist Fred Jansen for granting time to observe this source. This research has made use of the data and resources obtained through the HEASARC on-line service, provided by NASA Goddard Space Flight Center. This work has been supported by the Italian Space Agency. ER thanks the Brera Observatory for hospitality during the completion of this work. GG acknowledges the MIUR for the COFIN grant.References
- (1) Burenin, R., Denissenko, D., Pavlinsky, M. et al. 2003a, GRB Coordinates Network Circular (GCN Circ.) 2001
- (2) Burenin, R., Sunyaev, R., Pavlinsky, M. 2003b, GCN Circ. 2260
- Caldwell et al. (2003) Caldwell, N., Garnavich, P., Holland, S., Matheson, T., & Stanek, K. Z. 2003, GCN Circ. 2053
- Dickey & Lockman (1990) Dickey, J.M. & Lockman, F.J. 1990, ARAA 28, 215
- (5) Fitzgerald, J.B. & Orosz, J.A. 2003, GCN Circ. 2056
- (6) Frail, D.A., Kulkarni, S. R., Sari, R. et al. 2001, ApJ, 562, L55
- Galama et al. (1998) Galama, T.J., Vreeswijk, P. M., van Paradijs, J. et al. 1998, Nature 395, 670
- Granot, Nakar & Piran (2003) Granot, J., Nakar, E., & Piran, T. 2003, submitted to ApJ Letters, astro-ph/0304563
- Greiner et al. (2003) Greiner, J., Peimbert, M., Estabanet, C. et al. 2003, GCN Circ. 2020
- Hjorth et al. (2003) Hjorth, J., Sollerman, J., Meller, P. et al. 2003, Nature 423, 847
- (11) Ibrahimov, M.A., Asfandiyarov, I.M., Kahharov, B.B., et al. 2003, GCN Circ. 2219
- (12) Jahoda, K., Swank, J. H., Giles, A. B. et al. 1996, Proc. SPIE, 2808, 59
- Krisciunas et al. (2003) Krisciunas, K., Matheson, T., Stanek, K. Z., & Garnavichet, P. 2003, GCN Circ. 2093
- (14) Lazzati, D., Rossi, E.M., Covino, S., Ghisellini, G., & Malesani, D. 2002, A&A, 396, L5
- Marshall & Swank (2003) Marshall, F.E. & Swank, J.H. 2003, GCN Circ. 1966
- Marshall et al. (2003) Marshall, F.E., Markwardt, C., & Swank, J.H. 2003, GCN Circ. 2052
- (17) Panaitescu, A. & Kumar, P. 2000, ApJ, 543, 66
- Peterson & Price (2003) Peterson, B.A. & Price, P.A. 2003, GCN Circ. 1985
- Pian et al. (2003) Pian, E., Giommi, P., Amati, L. et al. 2003, Adv. Space Res. in press, astro-ph/0304521
- (20) Price, A. & Mattei, J. 2003, GCN Circ. 2071
- (21) Price, A. 2003, GCN Circ. 2058
- (22) Price, P.A., Fox, D.W., Kulkarni, S.R. et al. 2003, Nature 423, 844
- (23) Rhoads, J.E. 1999, ApJ, 525, 737
- Ricker (2003) Ricker, G.R. 2003, IAU Circ. 8101
- (25) Rykoff, E.S. & Smith, D.A. 2003, GCN Circ. 1995
- (26) Sari, R., Piran, T., & Narayan, R. 1998, ApJ, 497, L17
- Stanek et al. (2003) Stanek, K.Z., Matheson, T., Garnavich, P. M. et al. 2003a, ApJ 591, L17
- (28) Stanek, K.Z., Latham, D.W., & Everett, M.E. 2003b, GCN Circ. 2244
- (29) Stanek, K.Z., Bersier, D., Calkins, M., Freedman, D.L., & Spahr, T. 2003c, GCN Circ. 2259
- Strüder et al. (2001) Strüder, L., Briel, U., Dennerl, K. et al. 2001, A&A 365, L18
- Tiengo et al. (2003) Tiengo, A., Mereghetti, S., & Schartel, N. 2003, GCN Circ. 2241
- Torii (2003) Torii, K. 2003, GCN Circ. 1986
- Turner et al. (2001) Turner, M.J.L., Abbey, A., Arnaud, M. et al. 2001, A&A 365, L27.
- Vanderspek et al. (2003) Vanderspek, R., Crew, G., Doty, J. et al. 2003, GCN Circ. 1997
- (35) Zharikov, S., Benitez, E., Torrealba, J., & Stepanian, J. 2003, GCN Circ. 2022