The Revised Flat Galaxy Catalogue
Abstract
We present a new improved and completed version of the Flat Galaxy Catalogue (FGC) named the Revised Flat Galaxy Catalogue (RFGC) containing 4236 thin edge-on spiral galaxies and covering the whole sky. The Catalogue is intended to study large-scale cosmic streamings as well as other problems of observational cosmology. The dipole moment of distribution of the RFGC galaxies () lies within statistical errors () in the direction of the Local Group motion towards the Microwave Background Radiation (MBR).
Key words: galaxies: spiral — galaxies: catalogues — galaxies: large-scale motions in the Universe
1 Introduction
The Catalogue of flat spiral edge-on galaxies FGC (Karachentsev et al., 1993a) represents a rather specific sample of 4455 galaxies satisfying two simple conditions:
-
•
the axial ratio for the blue image ;
-
•
the angular diameter (blue major axis of galaxy) corresponds to .
Due to this selection criterion, the Catalogue is morphologically homogeneous and contains more than 75% of Sc and later spiral types.
As argued by Karachentsev (1989), such thin edge-on spirals are an appropriate tool to study the large-scale motions in the Universe because of : a) the HI 21 cm and line detection rate of these galaxies is nearly 100%; b) the flat galaxies avoid volumes occupied by groups and clusters so that their structure remains undisturbed and they are not affected by large virial motions.
Selection of objects and determination of their characteristics were carried out by systematic visual inspection of all prints of the Palomar Observatory Sky Survey (POSS-I) and the ESO/SERC sky survey in the blue and red colours. In accordance with the original photografic material, the Catalogue consists of two parts: FGC (N=2573) and its southern extension, FGCE (N=1882). The first part is based on the POSS-I and covers the sky region with declinations between and . The second one is based on the ESO/SERC and covers the rest of the sky area up to the DEC=. Besides, 291 galaxies selected in the preliminary survey were rejected then from the main Catalogue due to the violation of the criterion. They were included in Addendum.
General properties of flat galaxies have been studied in detail in a series of our papers (Karachentsev et al., 1993b; 1996; 1997a; 1998; Kudrya et al., 1994; 1997a,b; Parnovsky et al., 1994; Karachentsev, 1999).
To obtain the distances of flat galaxies independently of their radial velocities, extensive HI observations with the 305-m radiotelescope of the Arecibo observatory (Giovanelli et al., 1997) as well as the observations with the SAO 6 m telescope (Makarov et al., 1997a,b) have been performed. These observations added by the literature data allowed peculiar velocities for about 900 flat galaxies to be calculated and the apex of their coherent motion relative to the MBR frame to be determined (Karachentsev et al., 1995).
At present, the FGC is the deepest, morphologically homogeneous and complete sample of field galaxies suitable for investigation of different problems of extragalactic astronomy and observational cosmology.
2 New version of FGC
The main reasons for the preparation of a new improved and supplemented Catalogue version were as follows:
-
•
possibility of remeasuring the coordinates of flat galaxies with an accuracy , higher than in the FGC, using the Digital Sky Survey;
-
•
inclusion of data about “red” galaxy diameters lacking in the FGC;
-
•
reduction of the diameters measured on the J and R films of the ESO/SERC to the diameter system of the POSS-I (close to system), which decreased the difference in photometric depth between the two parts of the Catalogue (Kudrya et al., 1997a);
-
•
calculation of total apparent magnitudes (with a standard error 0.25 mag) for all flat galaxies, basing on angular diameters, surface brightnesses, and other parameters (Kudrya et al., 1997b);
-
•
possibility of determining the values of galactic extinction towards each flat galaxy, using the new IR data (Schlegel et al., 1998).
-
•
necessity for removing some faults noticed during the work with the FGC data.
The differences in structure between the new and old Catalogue versions are the following:
-
•
both parts, FGC and FGCE, have been joined in the RFGC (Revised Flat Galaxy Catalogue) where the galaxies are ranged according to their right ascensions for the epoch J2000.0;
-
•
the Addendum has been omitted;
-
•
the Notes describing specific galaxy characteristics have been included in the main body of the Catalogue (some details omitted);
-
•
the lists of identification of the FGC and the FGCE galaxies have been omitted because these data are now accessible from different galaxy databases (NED, LEDA etc).
As a result, the RFGC Catalogue contains the following data:
column 1: new (RFGC) galaxy number. The galaxies having the reduced diameters, , less than 0.6 arcmin are left in the Catalogue without the new RFGC number;
column 2: old Catalogue number; the letter “E” is added for FGCE galaxies;
column 3: PGC (Paturel et al., 1989) galaxy number;
columns 4,5: Right Ascension and Declination for the epoch J2000.0;
columns 6,7: Right Ascension and Declination for the epoch J1950.0;
columns 8,9: galactic longitude and latitude determined from RA, DEC with the North Galactic pole at RA= and DEC=;
column 10: positional angle of the galaxy major axis measured north — east in deg.;
columns 11,12: — major and minor blue diameters in arcmin in the POSS-I diameter system. For FGCE galaxies a conversion from the ESO/SERC diameter system (J) to the POSS-I one (O) was done according to the relations: ;
columns 13,14: — major and minor red diameters in arcmin in the POSS-I diameter system. The conversion formulae for the FGCE galaxies are ;
column 15: — total apparent magnitude calculated using the data on blue angular diameters, morphological type, surface brightness, and “colour index”, , according to the relation:
where
and SB is the surface brightness index, T — galaxy type (see below);
column 16: value of galactic extinction in the B band;
column 17: morphological type of the spiral according to the Hubble classification. Note that Sb = 3, Sc = 5 etc;
column 18: index of apparent asymmetry of the galaxy shape (0 means poorly defined, 2 — pronounced);
column 19: index of the mean surface brightness (I — high, IV — very low);
column 20: number of significant neighbours with an angular diameter in the range from to in a circle of , where is the blue major axis of the galaxy considered;
column 21: notes describing the galaxy morphological peculiarities and/or the galaxy environment. The galaxy diameters and mutual distances are expressed in arcmin.
3 Some statistics and data description
The distribution of the numbers of the RFGC galaxies according to their Catalogue characteristics are presented in Tables 1–11.
The galaxies were divided into four angular diameter intervals: with , and . Based on the radial velocity and inverse angular diameter relation for about 1000 RFGC galaxies, the mean distances, in km/s, are equal to 3860, 5150, 7730, 12900 for , and , respectively.
We picked out also the galaxies of different flatness: from the axial ratio being near our selection limit, , to the flattest ones, with .
The results presented in the tables are clear and do not need special explanations. Comment briefly on some selection effects.
-
•
Near the limit of the RFGC angular diameter a deficit of very flat galaxies is seen — about 6% in comparison with that expected for a random distribution (Table 1). This selection may be caused by the emulsion resolution effect. For example, a galaxy with and has a minor axis value, , comparable with a typical 2′′ seeing.
-
•
The numbers of different galaxy types in different intervals according to their angular diameters are close to expected. Only small Sb type excess is found among large galaxies (Table 3).
-
•
A small deficit of high surface brightness galaxies among the smallest ones can be explained as an effect of finite resolution of the emulsion (Table 4).
-
•
The largest galaxies seem to be more isolated (a small excess of galaxies without significant neighbours) (Table 6). A similar effect was noted for isolated galaxies (Karachentseva, 1973).
-
•
The flattest galaxies demonstrate excess of very low surface brightness galaxies (Table 9), as well as excess of isolated ones (Table 11).
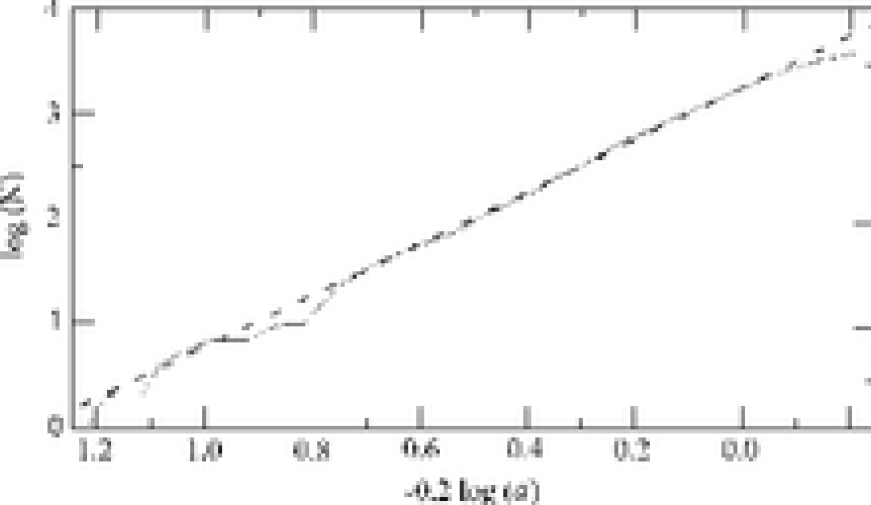
The integral distribution of the RFGC galaxies on their blue major diameters, vs. , is presented in Fig.1. The slope of the linear part is equal to 2.50 (for red diameters the slope is 2.53). As it is seen from Fig.1, the RFGC is complete to . There are no apparent signs of the Local Supercluster presence.
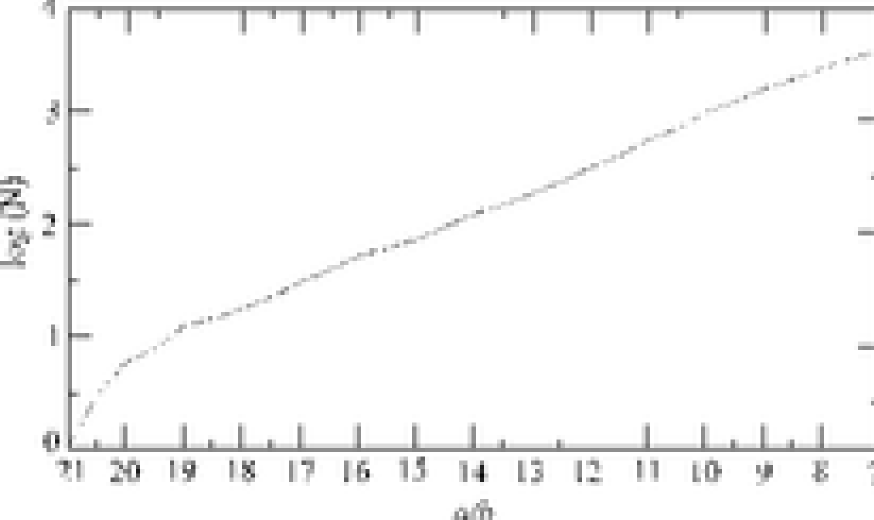
Fig.2 shows the integral distribution of the RFGC galaxies on their blue axial ratios, vs. . In the interval of from 7 to 19 the relation is exponential. The maximum axial ratio equals 21 (for red diameters is equal to 19).
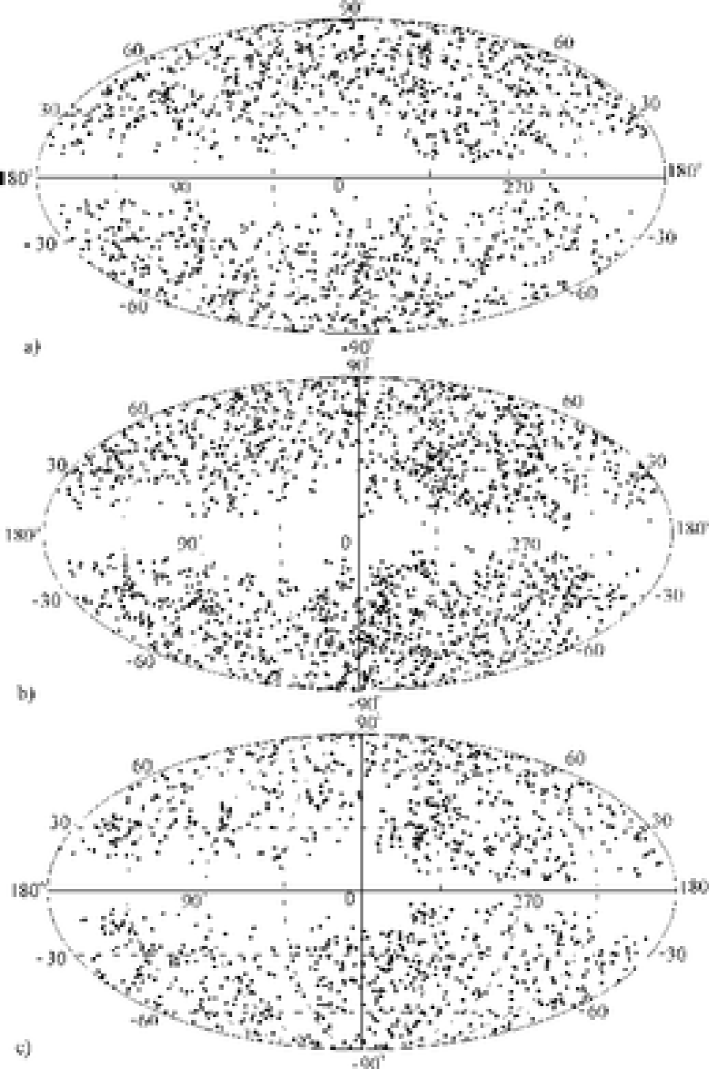
The all-sky distributions of the RFGC galaxies in the equatorial, galactic, and supergalactic coordinates are displayed in Fig.3 a–c. It is rather homogeneous, without a distinct difference in galaxy density between two parts of the sky, above and below DEC=. The RFGC galaxies do not exhibit density concentration towards the supergalactic equator in accordance with the data of Fig.1.
Comparing the galaxy distributions on their positional angles at different distances (Fig.4 a–d), we see that the anisotropy in these distributions increases from nearby to distant RGFC galaxies.
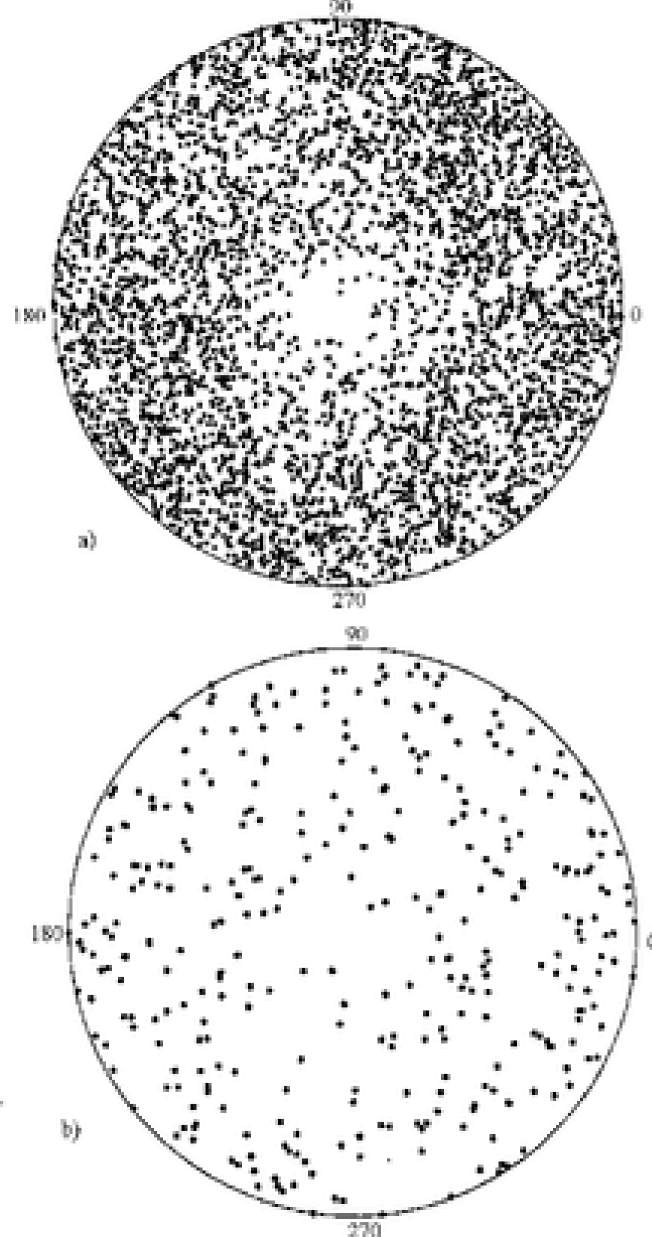
Fig. 5 a,b shows the distribution of the normals to flat galaxies using an equal-area projection in galactic coordinates , where the senses of the northern hemisphere have been chosen for each galaxy. The central void is produced by the Zone of Avoidance along the galactic equator. All RFGC galaxies exhibit an increase of pole concentration in a wide region around , but for the nearest galaxies their pole distribution looks homogeneous. Hence, the positional angle anisotropy has a scale larger than that of the Local Supercluster.
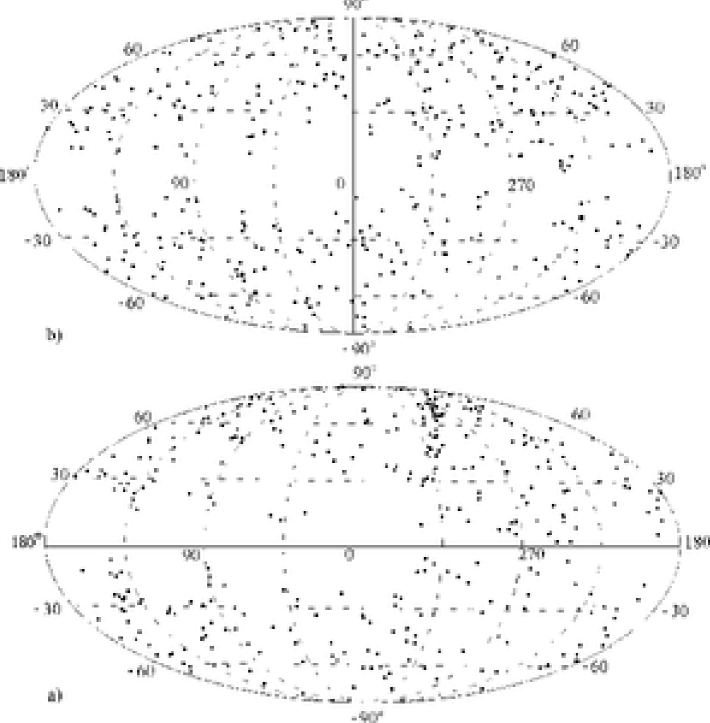
The distribution of the RFGC galaxies in galactic coordinates vs. their diameter (distance) intervals is exhibited in Fig.6 a–d.
The nearest galaxies are seen to be slightly concentrated in the Virgo region, while the most distant galaxies are concentrated in the region of the Hydra-Pavo-Indus supercluster. The RFGC galaxies lying at moderate distances are distributed homogeneously over the sky.
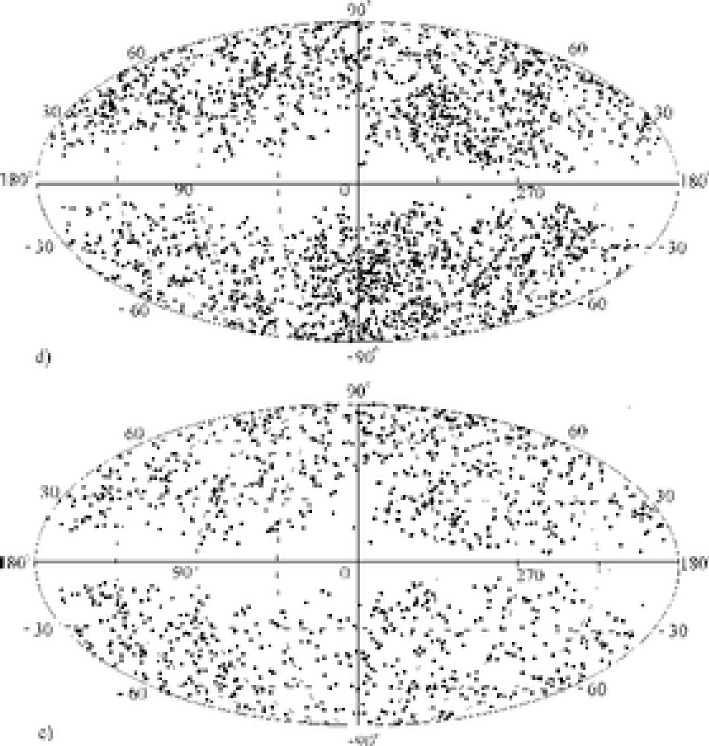
The distribution of the RFGC galaxies over the sky is different for galaxies of different flatness, Fig.7 a–c. The galaxies having near the selection limit are distributed quite homogeneously, while the galaxies with moderate axial ratios show a slight concentration towards the Hydra cluster region. The flattest galaxies show a pronounced clustering in accordance with our result obtained from the two-point angular correlation function for flat galaxies (Karachentsev et al., 1996).
4 Optical dipole
As it is well known, the dipole anisotropy of the MBR points out that the Local Group moves at a velocity of 600 km/s with respect to the MBR towards the apex with galactic coordinates (Kogut et al., 1993). The way to study the cause of this motion is to study the dipole moment of distribution of galaxies in the all-sky catalogue. This approach has been applied by Harmon et al. (1987) to the “IRAS Point Source Catalog” and by Lahav et al. (1988) to the combination of three optical catalogues: UGC+ESO+MCG (Nilson, 1973; Lauberts, 1982; Vorontsov-Velyaminov et al., 1962–64). According to these authors the resulting IRAS and optical “UGC+ESO+MCG” dipoles lie within about of the MBR dipole.
Based on the coordinates of the RFGC galaxies in different angular diameter intervals, we calculated their centroid position, when the galaxies were equally (not by flux) weighed. The results are presented in Table 12. Here X,Y, and Z indicate the average galactic Cartesian coordinates for the galaxy centroid together with their standard errors, and the corresponding coordinates show where the optical dipole vectors have a sense of the sky. As it is seen from these data the whole sample dipole () lies within of the MBR dipole. This alignment may indicate that the Local Group motion with respect to the MBR is produced mainly by matter distribution on a scale of 15000 km/s sampled by the RFGC.
-
Acknowledgements.
For measuring the coordinates we used the Digitized Sky Survey. The Digitized Sky Survey was produced at the Space Telescope Science Institute under U.S. Government grant NAG W-2166. The authors are greatly indepted to G.G. Korotkova for technical assistance in preparing the Catalogue. This work was supported by the grant of RFBR 98-02-16100.
References
- [1] Giovanelli R., Avera E., Karachentsev I.D., 1997, Astron. J., 114, 122
- [2] Harmon R.T., Lahav O., Meurs E.Y.A., 1987, Mon. Not. R. Astron. Soc., 228, 5
- [3] Karachentsev I.D., 1989, Astron. J., 97, 1566
- [4] Karachentsev I.D., 1999, Pis’ma Astron. Zh., 25, 376
- [5] Karachentsev I.D., Karachentseva V.E., Parnovsky S.L., 1993a, Astron. Nachr., 314, 97 (FGC)
- [6] Karachentsev I.D., Karachentseva V.E., Kudrya Yu.N., Parnovsky S.L., 1993b, Astron. Astrophys. Trans.,4, 143
- [7] Karachentsev I.D., Karachentseva V.E., Kudrya Yu.N., Parnovsky S.L., 1995, Astron. Nachr., 316, 369
- [8] Karachentsev I.D., Karachentseva V.E., Kudrya Yu.N., Parnovsky S.L., 1996, Pis’ma Astron. Zh., 22, 330
- [9] Karachentsev I.D., Karachentseva V.E., Kudrya Yu.N., Parnovsky S.L. 1997, Pis’ma Astron. Zh., 23, 652
- [10] Karachentsev I.D., Karachentseva V.E., Kudrya Yu.N., 1998, Pis’ma Astron. Zh., 24, 1
- [11] Karachentseva V.E., 1973, Soobshch. Spec. Astrofiz. Obs, 8, 3
- [12] Kogut A., Lineweaver C., Smoot G.F. et al., 1993, Astron. J., 419, 1
- [13] Kudrya Yu.N., Karachentsev I.D., Karachentseva V.E., Parnovsky S.L., 1994, Pis’ma Astron. Zh., 20, 13
- [14] Kudrya Yu.N., Karachentsev I.D., Karachentseva V.E., Parnovsky S.L., 1997a, Pis’ma Astron. Zh., 23, 15
- [15] Kudrya Yu.N., Karachentseva V.E., Karachentsev I.D., Parnovsky S.L., 1997b, Pis’ma Astron. Zh., 23, 730
- [16] Lahav O., Rowan-Robinson M., Lynden-Bell D., 1988, Mon. Not. R. Astron. Soc., 234, 677
- [17] Lauberts A., 1982, The ESO/Uppsala Survey of the ESO(B) Atlas, ESO, Munich (ESO)
- [18] Makarov D.I., Karachentsev I.D., Tyurina N.V., Kajsin S.S., 1997a, Pis’ma Astron. Zh., 23, 509
- [19] Makarov D.I., Karachentsev I.D., Burenkov A.N., Tyurina N.V., Korotkova G.G., 1997b, Pis’ma Astron. Zh., 23, 736
- [20] Nilson P., 1973, Uppsala General Catalogue of Galaxies, Uppsala Astron. Obs.Ann., Bd. 6 (UGC)
- [21] Parnovsky S.L., Karachentsev I.D., Karachentseva V.E., 1994, Mon. Not. R. Astron. Soc., 268, 665
- [22] Paturel G., Fouque P., Bottinelli L., Gouguenheim L., Catalogue of Principal Galaxies, Lyon, 1989, v. I–III (PGC)
- [23] Schlegel D.J., Finkbeiner D.P., Davis M., 1998, Astron. J., 500, 525
- [24] Vorontsov-Velyaminov B.A., Krasnogorskaja A.A., Arkhipova V.P., Morphological Catalogue of Galaxies,1962–64, v.I–III (MCG)
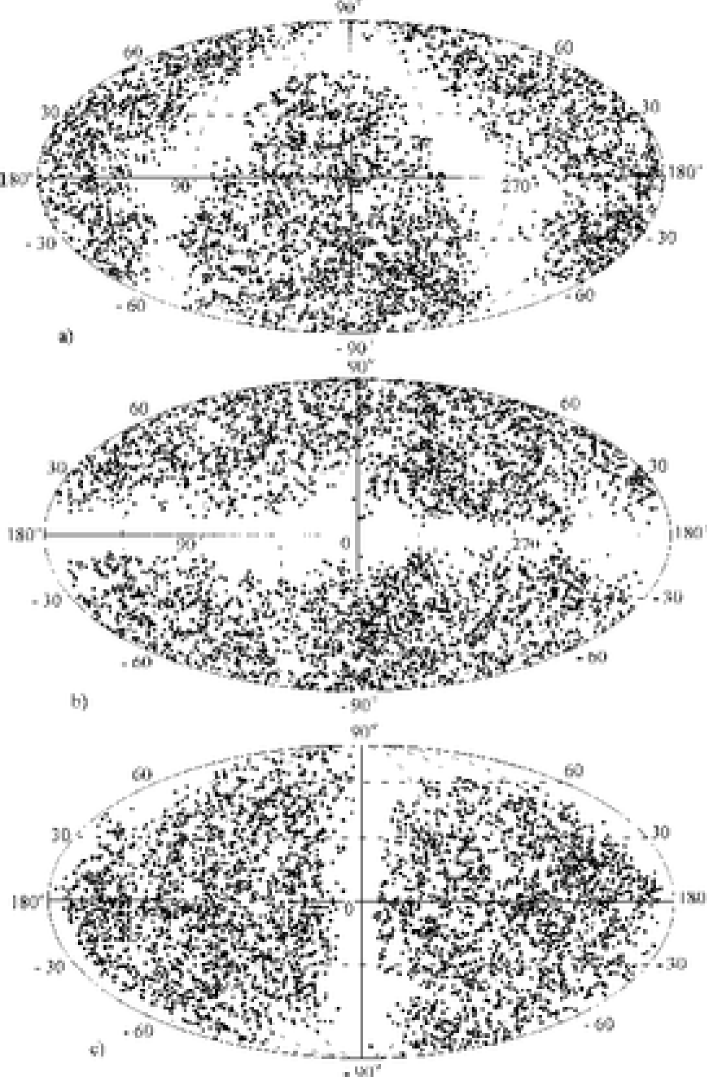
a) in equatorial coordinates, b) in galactic coordinates, c) in supergalactic coordinates.
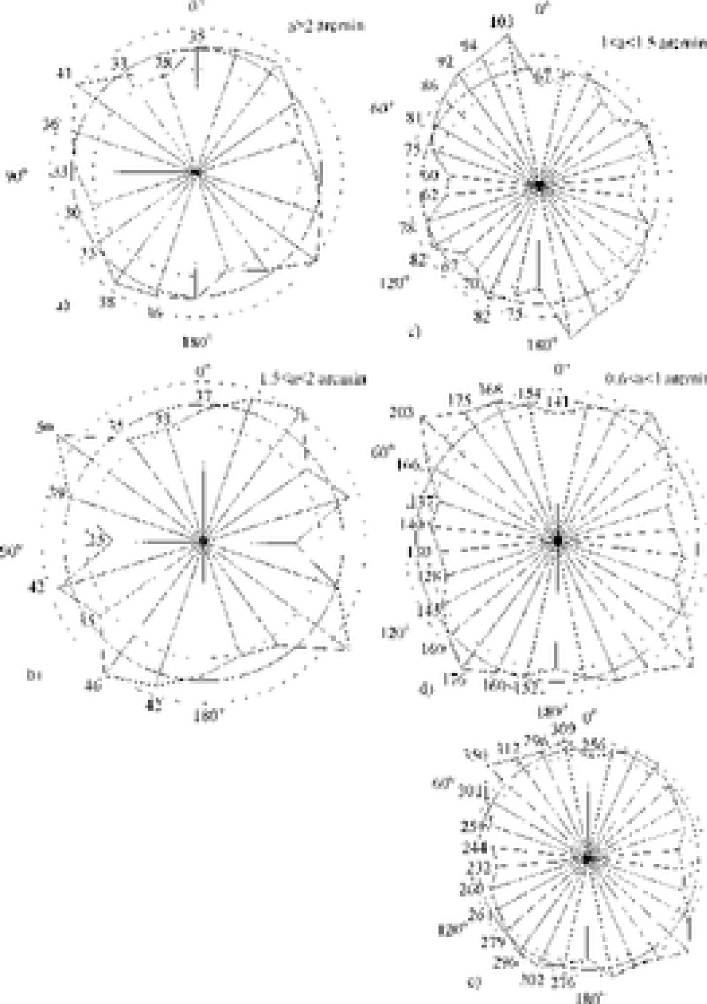
a) arcmin, b) 1.5 arcmin arcmin, c) 1.0 arcmin arcmin,
d) 0.6 arcmin arcmin, e) all galaxies.
a) all galaxies, b) the galaxies with arcmin.
a) arcmin, b) 1.5 arcmin arcmin.
c) 1.0 arcmin arcmin, d) 0.6 arcmin arcmin.
a) , b) , c) .
| Blue angular diameter, arcmin | |||||
| Axial ratio | 2.0 | 1.99-1.50 | 1.49-1.00 | 0.99-0.60 | All |
| 7.0 - 7.99 | 95 | 89 | 275 | 845 | 1304 |
| 8.0 - 9.99 | 124 | 152 | 407 | 1116 | 1799 |
| 10.0 | 124 | 143 | 492 | 374 | 1133 |
| All | 343 | 384 | 1174 | 2335 | 4236 |
| Angular diameter, arcmin | |||||
|---|---|---|---|---|---|
| Magnitude, | 2.0 | 1.99-1.50 | 1.49-1.00 | 0.99-0.60 | All |
| 12 | 0 | 0 | 0 | 12 | |
| 13.0 - 13.99 | 32 | 0 | 0 | 0 | 32 |
| 14.0 - 14.99 | 146 | 1 | 0 | 0 | 147 |
| 15.0 - 15.99 | 148 | 327 | 216 | 0 | 691 |
| 16.0 - 16.99 | 5 | 56 | 949 | 1407 | 2417 |
| 17.0 - 17.99 | 0 | 0 | 9 | 928 | 937 |
| All | 343 | 384 | 1174 | 2335 | 4236 |
| Angular diameter, arcmin | |||||
| Type | 2.0 | 1.99-1.50 | 1.49-1.00 | 0.99-0.60 | All |
| 4 | 0 | 4 | 2 | 10 | |
| 23 | 35 | 46 | 47 | 151 | |
| 60 | 76 | 175 | 262 | 573 | |
| 85 | 101 | 398 | 952 | 1536 | |
| 72 | 74 | 254 | 559 | 959 | |
| 65 | 62 | 214 | 377 | 718 | |
| 30 | 27 | 76 | 119 | 252 | |
| 4 | 9 | 7 | 17 | 37 | |
| All | 343 | 384 | 1174 | 2335 | 4236 |
| Angular diameter, arcmin | |||||
| S.B. | 2.0 | 1.99-1.50 | 1.49-1.00 | 0.99-0.60 | All |
| I | 56 | 39 | 79 | 68 | 242 |
| II | 210 | 231 | 671 | 1368 | 2480 |
| III | 63 | 105 | 391 | 810 | 1369 |
| IV | 14 | 9 | 33 | 89 | 145 |
| All | 343 | 384 | 1174 | 2335 | 4236 |
| Angular diameter, arcmin | |||||
| Asymmetry | 2.0 | 1.99-1.50 | 1.49-1.00 | 0.99-0.60 | All |
| 0 | 231 | 248 | 740 | 1611 | 2830 |
| 1 | 89 | 103 | 353 | 614 | 1159 |
| 2 | 23 | 33 | 81 | 110 | 247 |
| All | 343 | 384 | 1174 | 2335 | 4236 |
| Number of | Angular diameter, arcmin | ||||
|---|---|---|---|---|---|
| compan. | 2.0 | 1.99-1.50 | 1.49-1.00 | 0.99-0.60 | All |
| 0 | 205 | 209 | 539 | 966 | 1919 |
| 1 | 78 | 99 | 326 | 675 | 1178 |
| 2 | 37 | 37 | 167 | 377 | 618 |
| 3 | 11 | 22 | 84 | 185 | 302 |
| 12 | 17 | 58 | 132 | 219 | |
| All | 343 | 384 | 1174 | 2335 | 4236 |
| Axial ratio | ||||
|---|---|---|---|---|
| Magnitude, | 7.0-7.99 | 8.0-8.99 | All | |
| 4 | 7 | 1 | 12 | |
| 13.0 - 13.99 | 15 | 15 | 2 | 32 |
| 14.0 - 14.99 | 61 | 47 | 39 | 147 |
| 15.0 - 15.99 | 212 | 310 | 169 | 691 |
| 16.0 - 16.99 | 707 | 1008 | 702 | 2417 |
| 17.0 - 17.99 | 305 | 412 | 220 | 937 |
| All | 1304 | 1799 | 1133 | 4236 |
| Axial ratio | ||||
|---|---|---|---|---|
| Type | 7.0-7.99 | 8.0-8.99 | All | |
| 5 | 4 | 1 | 10 | |
| 77 | 55 | 19 | 151 | |
| 240 | 279 | 54 | 573 | |
| 477 | 649 | 410 | 1536 | |
| 253 | 438 | 268 | 959 | |
| 129 | 265 | 324 | 718 | |
| 98 | 101 | 53 | 252 | |
| 25 | 8 | 4 | 37 | |
| All | 1304 | 1799 | 1133 | 4236 |
| Axial ratio | ||||
|---|---|---|---|---|
| S.B. | 7.0-7.99 | 8.0-8.99 | All | |
| I | 99 | 114 | 29 | 242 |
| II | 750 | 1123 | 607 | 2480 |
| III | 407 | 514 | 448 | 1369 |
| IV | 48 | 48 | 49 | 145 |
| All | 1304 | 1799 | 1133 | 4236 |
| Axial ratio | ||||
|---|---|---|---|---|
| Asymm. | 7.0-7.99 | 8.0-8.99 | All | |
| 0 | 806 | 1210 | 814 | 2835 |
| 1 | 406 | 490 | 263 | 1154 |
| 2 | 92 | 99 | 56 | 247 |
| All | 1304 | 1799 | 1133 | 4236 |
| Number of | Axial ratio | |||
|---|---|---|---|---|
| compan. | 7.0-7.99 | 8.0-8.99 | All | |
| 0 | 557 | 787 | 575 | 1919 |
| 1 | 394 | 486 | 298 | 1178 |
| 2 | 192 | 289 | 137 | 618 |
| 3 | 92 | 135 | 75 | 302 |
| 69 | 102 | 48 | 219 | |
| All | 1304 | 1799 | 1133 | 4236 |
| Angular diameters | |||||
|---|---|---|---|---|---|
| arcmin | |||||
| 225 | |||||
| 1.99 - 1.50 | 201 | ||||
| 1.49 - 1.00 | 196 | ||||
| 0.99 - 0.60 | 297 | ||||
| All | 273 |