The line-of-sight warp of the spiral galaxy ESO 123-G23
We present 3-D modelling of the distribution and kinematics of the neutral hydrogen in the spiral galaxy ESO 123-G23. The optical appearance of this galaxy is an almost perfectly edge-on disk, while the neutral hydrogen is found to extend vertically out to about 15 kpc on either side of the galactic plane. The HI layer and the major features of the HI data cube can be successfully explained by a model dominated by a strong (about 30∘) line-of-sight warp. Other models were tried, including a flare model and a two-component model, but they clearly do not reproduce the data. This is the first unambiguous detection of a galactic warp that has the maximum deviation from the central plane almost along the line-of-sight. No evidence for the presence of any companion galaxy is found in the HI data cube. Line-of-sight warps in edge-on galaxies are probably frequent, but escape detection as they are too weak. Moreover they may easily be mistaken as flares or ’thick disks’. A 3-D modelling of the HI layer as the one presented here is needed in order to distinguish between these possibilities.
Key Words.:
Galaxies: individual (ESO 123-G23) – Galaxies: kinematics and dynamics – Galaxies: structure1 Introduction
The outer parts of the disks of spiral galaxies are frequently warped (Bosma bosma (1991), García-Ruiz et al. garcia-ruiz (2002)). Warps are best seen with HI observations, since the neutral hydrogen extends out to much larger radii than the optical disk. HI warps obey some general rules, one of them being that they usually start around R25 (Briggs briggs (1990)). The measured angle between the inner plane and the outermost observed HI ring spans a wide range of values, from a few degrees to a few tens in some exceptional cases. Of the various possible orientations that warps can have, one is considered as “unfavourable”, as the warp becomes less visible: this is when the largest deviation from the central plane occurs along the line-of-sight.
The origin of warps is still poorly understood. Different models have been proposed, for instance: the precession of a disk embedded in a flattened dark halo, misaligned with the disk itself (e.g. Toomre toomre (1983)), or the accretion of gas with angular momentum different from that of the disk (e.g. Ostriker & Binney ostriker (1989)), but none is completely satisfactory.
In an ongoing project to study the dark matter distribution of spiral galaxies a sample was culled from the list of Persic and Salucci (persic (1995)) selecting the best determined optical rotation curves; the selection criteria were: symmetry of the H rotation curve, high angular extent, high HI flux and low luminosity (Gentile et al., in prep.) The aim was to combine these optical data with HI measurements tracing the gravitational potentials much further out. One of these galaxies, the edge-on spiral ESO 123-G23, turned out to look remarkable in its HI distribution. Indeed the HI emission extends far away (up to about 15 kpc) from either side of the plane. Such a pattern can be produced by different phenomena including a flaring of the outer disk, a thick layer of gas or a warp along the line-of-sight. We have therefore modelled the HI layer of ESO 123-G23 considering these possibilities. Our analysis shows that the correct explanation is a warping of the disk along the line-of-sight. The other possibilities are clearly ruled out.
2 Observations
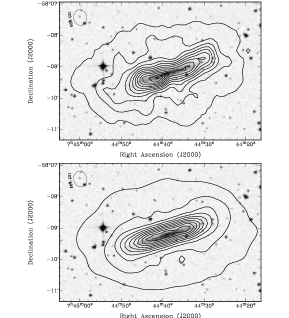
ESO 123-G23 is an edge-on spiral galaxy located at a distance of 38 Mpc (=75 km s-1 Mpc -1). Not much was known about this galaxy except that it exhibits a slight warp in the outer optical disk (Reshetnikov & Combes reshetnikov (1999)). We have observed ESO 123-G23 in the HI line for 2 12 hours using the Australia Telescope Compact Array (ATCA)111The Australia Telescope is funded by the Commonwealth of Australia for operation as a National Facility managed by CSIRO. and combining the data from two array configurations (750D and 1.5A), providing a beam of 306 250 and a velocity resolution (after Hanning smoothing) of 6.6 km s-1. In Fig. 1 (upper panel) we display an optical - HI overlay showing the peculiar morphology of this galaxy: while the optical image resembles an almost perfectly edge-on disk, the HI is much more extended perpendicularly to the major axis, displaying what looks like a very inclined central disk and diffuse emission at large (up to 15 kpc) projected distances from the optical disk; this diffuse emission accounts for about 40 % of the total HI mass. The left column of Fig. 2 shows some channel maps of the HI data cube. Every fourth channel is shown, so the displayed maps are spaced by about 26 km s-1. The central channel map, at a velocity of 2855.4 km s-1, is the one closer to the systemic velocity. The channel maps of ESO 123-G23 show the emission from a central edge-on disk, plus fainter emission from regions above and below the plane. Such an emission is more visible in the central channels, close to systemic velocity. This may indicate either a lower rotation velocity of the gas above the plane or a lower inclination angle (i.e. towards face-on) of the outer parts of the disk. A warp in position angle is visible, especially at v = 2723.5 and 2987.3 km s-1, and it is quite symmetric. ESO 123-G23 is reported to have no optical companion of size between Ropt/2 and 2 Ropt within a radius of 10 Ropt (Karachentsev karachentsev (1993)). An inspection of the HI data cube did not disclose any companion in HI either. The total size of the data cube is (dimensions of the primary beam) km s-1. The position-velocity diagram along the major axis is shown in Fig. 3 (upper panel), where the east side of the galaxy is slightly more extended but no clear kinematical lopsidedness is visible. On the p-v diagram is overlapped (dots) the rotation curve of the galaxy (see Section 3).

We considered three phenomena that might mimic the observed HI structure and kinematics: a) a line-of-sight warp; b) a large flare in the outer part of the disk; and c) a two-component structure, thin + thick (slowly rotating) disk, similar to that proposed for NGC 891 (Swaters et al. swaters (1997)) and NGC 2403 (Fraternali et al. fraternali (2001)). These phenomena have in common the fact of displaying emission away from the thin disk and are hard to disentangle except via detailed 3-D modelling of the HI layer.
3 Models
As mentioned above, we modelled the HI data cube in three different ways. All these models consist of a set of concentric circular rings (Rogstad et al. rogstad (1974)), each described by a set of geometrical and physical parameters, chosen such as to provide the best agreement with the observed HI data cube. Some parameters were kept fixed for the three models.
The parameters that the models had in common were: the radial surface density distribution, derived using the Lucy method (Warmels warmels (1988)); the HI velocity dispersion, chosen to go from 12 km s-1 in the inner parts to 7 km s-1 in the outer parts (Kamphuis kamphuis (1993)), in order to have values as realistic as possible; a constant value of 10 km s-1 would not have affected much the results, while values different from 10 km s-1 by more than 5 km s-1 would not give a good account of the observed data cube; the shape of the vertical distribution of the HI layer, chosen to be Gaussian with different scale-heights for the various models (the choice of other distribution shapes does not significantly change the results); the position angle as a function of radius, taken to slightly change counter-clockwise after = 807 (15 kpc), and then to significantly (10∘) change clockwise further out (see third panel of Fig. 5). By trying models with different values of the position angle we estimate an accuracy of about 2∘ (errorbars in Fig. 5), beyond which the disagreement with the observations is flagrant.

The rotation curve was derived with the WAMET (WArped Modified Envelope Tracing) method (Gentile et al. gentile (2002), Vergani et al. vergani (2002)), a modification of the Envelope Tracing method (Sofue & Rubin sofue (2001)); a detailed description of this method will be given in a forthcoming paper (Gentile et al., in prep.). Only small corrections ( 5 km s-1) were necessary to refine the rotation curve derived with our WAMET method. These corrections were made in order to give a better representation of the observed HI data cube. This method, however, like the methods that derive the rotation curve from the position-velocity diagram, provides the product . Therefore we have to account for the inclination, that can vary with radius within the same model. For the inner parts of the galaxy we used, in all the models, an inclination angle of 85∘, a value similar to optical estimates (e.g. the Lyon-Meudon Extragalactic Database, LEDA, gives an inclination of 82.3∘).
In the warp model the inclination angle was lowered by up to 30∘ beyond in order to fit the observations (see second panel in Fig.5). With the same procedure we used for the position angle, we estimated an error for the inclination angle of 5∘. The rotation curve was obtained with the WAMET method with the assumed values for the inclination angle. The FWHM of the Gaussian vertical distribution of the HI was chosen to be 300 pc.
The flare model differs from the warp model in having a constant inclination of 85∘ and a rotation curve obtained with such a constant value. The FWHM of the HI vertical distribution is 300 pc inside increasing to a value of 25 kpc at ″. Such an unrealistic value is necessary to reproduce the HI distribution (lower contours) visible in the total HI map (Fig. 1, upper panel).
Finally the two-component model is the sum of a thin and a thick disk in analogy to the previously cited models proposed for NGC 891 and NGC 2403. In this model the thin disk has a rotation velocity taken from the WAMET method with a constant inclination and a thickness of 300 pc (FWHM). For the thick disk (40% of the total HI mass) the rotation velocity was lowered by 30 km s-1 with respect to the thin disk and the thickness of the HI layer was taken to be 20 kpc (FWHM). Similarly to the flare model, this last unrealistic value is necessary to reproduce the total HI distribution. For both the flare and the two-component model a different choice of the inclination does not improve the agreement with the observed data cube.

4 Discussion and conclusions
In Fig. 2 we show some channel maps of the data cube compared with the channel maps of the line-of-sight warp model, the flare model, and the two-component model (from left to right). This figure illustrates why the flare model and the two-component model have to be rejected: apart from their somewhat unphysical choice of parameters (although necessary to produce the vertical HI distribution), they cannot reproduce the observed channel maps. For instance, the flare model cannot reproduce at the same time the large north-south extension in the central channels and the relatively small north-south extension visible in the extreme channels (v = 2723.5 and 2987.3 km s-1). The two-component model is not able to reproduce the ’elbow’ present at v = 2749.9 and 2802.6 km s-1, which is also indicated on the receding side, at v = 2908.2 and 2960.9 km s-1.
The data are indeed fitted best by the model of a warp that shows maximum deviation from the plane close to the line-of-sight; Fig. 2 shows that such a model reproduces in detail all the key features of the observed HI data cube. See the upper panel of Fig. 5 for the adopted rotation curve for this model; the errors are the difference between the approaching and the receding side, considering also a minimum error of km s-1. In the upper panel of Fig. 3 we show the derived rotation curve of ESO 123-G23 (separately for the two sides) projected onto the observed position-velocity diagram, and in the lower panel the adopted rotation curve (the average between the two sides) projected onto the position-velocity diagram of the line-of-sight warp model. It is remarkable that the de-warped rotation curve of this galaxy is in good agreement with the Universal Rotation Curve of Persic et al (persic2 (1996)) while the raw curve, instead, had a very unusual decrease of 30 km s-1 from 7 kpc to 15 kpc, never found in galaxies with the maximum circular velocity of ESO 123-G23. Fig. 4 shows the HI rings of the line-of-sight warp model as seen by the observer and Fig. 1 (lower panel) shows the total HI map obtained with this model. The overall HI distribution is well reproduced. We have also tried combinations of the various models, but the emission at projected distances of up to 15 kpc from the central disk can be explained only with the warp model, and combining the warp model with realistic values of an outer flare and a thick disk gives irrelevant changes to the model.
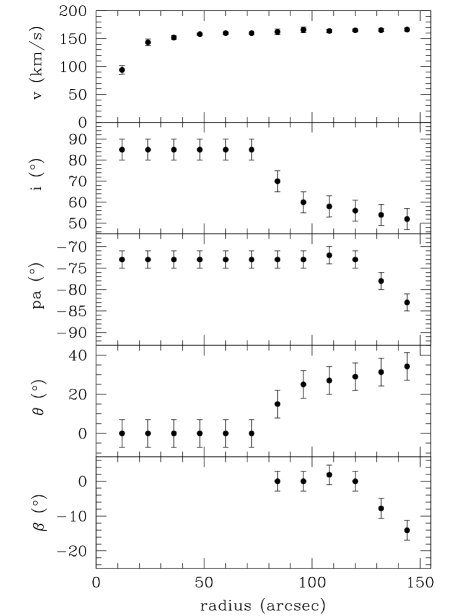
In order to describe the geometry of the warp, as previously done by Schwarz (schwarz (1985)), we define the angle between the plane of the inner disk and the plane of the warped ring, and the angle between the line of nodes (at the intersection of the plane of the ring and the plane of the inner disk) and the line of intersection between the plane of the sky and the plane of the inner disk. The uniqueness of this warp now shows up in Fig. 5, bottom panel: is always relatively close to zero, meaning that the maximum tilt of rings is almost exactly along the line-of-sight. We point out that a negative value of means a position angle varying clockwise and that in unwarped sections of a galaxy is of course not defined. The fourth panel from top of Fig. 5 shows the monotonically increasing warp angle as a function of radius.
There is, however, an ambiguity due to our assumption of a central inclination of 85∘ and the unknown true orientation of the disk: the inclination varies from 85∘ to about 55∘, which could mean a variation of 30∘ or 40∘, depending on the viewing angle. If we look at both the central disk and the outer rings “from above” or “from below”, the warp angle is about 30∘; if we look at one “from above” and the other “from below”, the warp angle is about 40∘. We plot the warp angles with the assumption of viewing the galaxy in such a way that the warp is as weak as possible (30∘); considering the uncertainties in position angle and inclination, we estimate that the minimum warp angle necessary to reproduce the data cube is about 25∘. Even with this assumption, this warp remains exceptional: the warp angle, measured at the last point, is very large. In fact it is larger for example than all the warp angles found in the systematic study of galaxy disks in HI by García-Ruiz et al. (garcia-ruiz (2002)). This is probably the reason why this warp is rendered visible: for smaller angles a warp oriented along the line-of-sight is almost invisible.
We have thus found very strong evidence for ESO 123-G23 to be an almost perfectly edge-on disk galaxy with a strong warp along the line-of-sight. This is demonstrated by the comparison of a series of models with the observations. We therefore report the first clear case of a galaxy with such a warp. We note that Becquaert & Combes (1997) interpreted the morphology and kinematics of the HI disk of NGC 891 in terms of a warp close to the line-of-sight. However, the fact that Swaters et al. (1997) interpreted their HI observations of NGC 891 predominantly in terms of a thin + (slowly rotating) thick disk shows that the case was not as evident as the present one. Statistically, the frequency of occurrence of line-of-sight warps should be much higher, while most of them remain undisclosed owing to their small warp angles. The only way to discriminate between different phenomena (warp, flare, etc.) is detailed modelling in the way described here.
Acknowledgements.
We thank the referee, Rob Swaters, for valuable comments that improved the quality of this paper. We are grateful to Renzo Sancisi for giving us the first hints for this work. GG wants to thank Christian Brüns and Daniela Vergani for performing the first run of the observations. GG is also grateful for financial support of the Deutsche Forschungsgemeinschaft under number GRK 118 “The Magellanic System, Galaxy Interaction and the Evolution of Dwarf Galaxies”.References
- (1) Becquaert, J.-F., Combes, F. 1997, A&A, 325, 41
- (2) Bosma, A. 1991, in Warped Disks and Inclined Disks around Galaxies, ed. S. Casertano, P. Sackett & F. H. Briggs (Cambridge: CUP), 181
- (3) Bottema, R. 1996, A&A, 306, 345
- (4) Briggs, F.H. 1990, ApJ, 352, 15
- (5) Fraternali, F., Oosterloo, T., Sancisi, R., van Moorsel, G. 2002, ApJ, 562, L47
- (6) García-Ruiz, I., Sancisi, R., Kuijken, K. 2002, A&A, 394, 769G
- (7) Gentile, G., Vergani, D., Salucci, P., Kalberla, P., Klein, U. 2002, astro-ph/0206477
- (8) Kamphuis, J. 1993, Ph.D. thesis, Univ. Groningen
- (9) Karachentsev, I. D., Karachentseva, V. E., Parnovsky, S. L. 1993, Astron. Nachr., 314, 97
- (10) Ostriker, E.C., Binney, J. 1989, MNRAS, 237, 785
- (11) Persic, M., Salucci, P. 1995, ApJS, 99, 501
- (12) Persic, M., Salucci, P., Stel, F. 1996, MNRAS, 281, 27P
- (13) Reshetnikov, V., Combes, F. 1999, A&AS, 138, 101
- (14) Rogstad, D.H., Lockhart, I.A., Wright, M.C.H. 1974, ApJ, 193, 309
- (15) Schwarz, U.J. 1985, A&A, 142, 273
- (16) Sofue, Y., Rubin, V. 2001, ARA&A, 39, 137
- (17) Swaters, R. A., Sancisi, R., van der Hulst, J. M. 1997, ApJ, 491, 140
- (18) Toomre, A. 1983, in IAU Symp. 100, Internal Kinematics and Dynamics of Galaxies, ed. E. Athanassoula (Dordrecht: Kluwer), 177
- (19) Vergani, D., Gentile, G., Dettmar, R.-J., Aronica, G., Klein, U.: 2002, astro-ph/0206481
- (20) Verheijen, M.A., Sancisi, R. 2001, A&A, 370, 765
- (21) Warmels, R.H. 1988, A&AS, 72, 427