Galaxy Alignments as a Probe of the Dynamical State of Clusters
Abstract
We present indications, based on a sample of 303 Abell clusters, for a relation between the dynamical state of clusters and the alignments of galaxy members with their parent cluster major axis orientation as well as with the large scale environment within which the clusters are embedded. The statistical results are complemented with a deep, wide-field case study of galaxy alignments in the cluster A521, which is characterised by multiple merging events (Maurogrdato et al 2000, Ferrari et al. 2003) and whose galaxy members show a strong alignment signal out to Mpc. Our results show that galaxy alignments appear to be stronger the more dynamically young is the cluster, especially when found in high-density environments. This relation complements the recently found “Cluster Substructure - Alignment Connection” (Plionis & Basilakos 2002) by which dynamically young clusters, found in high-density environments, show stronger cluster-cluster alignments.
1 Introduction
A well established alignment effect is that between the orientation of nearby clusters and between the orientation of the BCG (or cD) and that of their parent cluster (cf. Sastry 1968; Binggeli 1982; Carter & Metcalfe 1980; Struble 1990; West 1989; West 1994; Plionis 1994; Fuller, West & Bridges 1999; Kim et al. 2001; Chambers, Melott, Miller 2002). Furthermore, recent evidence has shown that substructures in clusters are aligned with the cluster orientation as well as along the large-scale filamentary structures within which they are embedded (cf. West, Jones & Forman 1995, Plionis & Basilakos 2002, Plionis 2001). Analytical (cf. Bond 1987) and numerical work (cf. West, Villumsen, Dekel 1991; van Haarlem & Van de Weygaert 1993, Tormen 1997, Onuora & Thomas 1999; Splinter et al. 1998; Falthebacher et al. 2002) show that cluster-cluster and substructure-cluster alignments occur naturally in hierarchical clustering models of structure formation, like the CDM. This fact has been explained as the result of an interesting property of Gaussian random fields that occurs for a wide range of initial conditions and which is the ”cross-talk” between density fluctuations on different scales. This property is apparently also the cause of the observed filamentariness observed not only in ”pancake” models but also in hierarchical models of structure formation; the strength of the effect, however, differs from model to model.
Recent observational evidences point also to the so called “Cluster Alignment - Substructure Connection” by which the dynamically young clusters show a stronger tendency to be aligned (Plionis & Basilakos 2002) while they are also located preferentially in high-density environments (Plionis & Basilakos 2002; Schüecker et al 2001). Such alignment effects could be imprinted also in smaller scales; the scales of individual galaxies. For example, if galaxies formed after the collapse of their parent cluster, then the anisotropic initial conditions could be imprinted in member galaxy orientations. In the hierarchical structure formation models, galaxy alignments could originate from a combination of different mechanisms, for example as a result of the parent cluster tidal field (cf. Salvador-Sole & Solanes 1993; Usami & Fujimoto 1997; but see also Barnes & Efstathiou 1987), a possibility supported also by the correlation found between disk galaxy spin axes and the local tidal shear field (Lee & Pen 2002), and/or if the galaxy-galaxy interactions occur in a preferred direction, for example along the primordial large-scale filamentary structure within which the protocluster is embedded. This anisotropic merger scenario of West (1994) has provided an interesting explanation of the observed strong alignment of the brightest cluster galaxy (BCG) not only with the cluster position angle but also with the near large-scale structures.
In clusters, any primordial galaxy alignments effect should be severely damped by violent relaxation, by the exchange of angular momentum in multiple galaxy encounters that occur in the dense cluster environment over a Hubble time (cf. Coutts 1996) and even by secondary infall (Quinn & Binney 1992). Therefore, other than the alignment of the BCG with its parent cluster that could be expected (cf. Struble 1990; West 1994; Kim et al. 2001), it seems secure to say that in highly relaxed clusters, where there has been sufficient time to mix the phases, one should not expect to observe any significant primordial galaxy alignment, even if they did originally exist. Therefore, the existence or not of galaxy alignments in and around clusters could be an indication of their dynamical state. The possible existence of such alignments, intrinsic in nature, is important also for their effect on measures of weak lensing, where ellipticity correlations of background galaxies are expected to arise from the lensing of foreground large mass inhomogeneities (cf. Bartelmann & Schneider 2001). Considerable effort has been devoted, recently, in attempts to quantify and disentangle these effects (cf. Catelan, Kamionkowski & Blandford 1996; King & Schneider 2003; Heymans & Heavens 2003).
Observational efforts to detect intrinsic galaxy alignments in clusters or superclusters has not reached a clear consensus. For example, Dekel (1985) using the UGC and ESO-Uppsala galaxy catalogues concluded that no significant galaxy alignments exist in clusters. However, earlier studies of Adams, Storm & Storm (1980) had found alignments, although not very significant, in A999 and A2197. Djorgovski (1983) found galaxy alignments in the Coma cluster, an effect more prominent for red galaxies, while van Kampen & Rhee (1990) and Trevese, Cirimele & Flin (1992) analysing the 10-20 brightest galaxies in a large number of Abell clusters (Abell 1958; Abell, Corwin & Olowin 1989) found no galaxy alignments other than between the BCG and its parent cluster orientation (see Djorgovski 1987; Cabanela & Aldering 1998 and references therein for reviews of early results).
One should be very careful in how to interpret such conflicting results. It should be noted that systematic biases, like PSF inhomogeneities (cf. Brown et al 2002), and projection effects can to mask any true alignment signal. For example, the projection of foreground galaxies along the line of sight of a cluster as well as the projection on the plane of the sky of member galaxies, always work in the direction of smearing alignments. On the other side, telescope tracking problems can create false alignments. Such problems, if not modeled adequately, could potentially introduce artificial galaxy-galaxy alignments, and thus hamper attempts to measure weak shear induced by gravitational lensing, but cannot create a false alignment between galaxies and their parent cluster orientation, since the later is estimated from the distribution of the galaxy member positions.
Therefore, the question whether galaxy alignments exist in clusters and if they do then under which circumstances do they appear, is still unanswered. In this paper we present a statistical analysis of galaxy alignments in 303 Abell clusters (Abell 1958; Abell, Corwin & Olowin 1989), based on their POSS scans and a SExtractor (Bertin & Arnouts 1996) identification of the galaxy distribution within a radius of 1 Mpc from the cluster centre. These statistical results are complemented with a deep, wide-field case study of galaxy alignments within Mpc of the cluster A521, which is a relatively distant (), richness class 1 Abell cluster with clear evidence of multiple merging events (Maurogordato et al. 2000; Arnaud et al. 2000; Ferrari et al. 2003).
2 Galaxy Alignments in Abell Clusters
We have analysed the POSS scans in the direction of 303 Abell clusters, all of which have an independent determination of their position angle (from Plionis 1994), while 168 also have velocity dispersion measurements (Struble & Rood 1999; De Propris et al. 2001). Our sample, which was defined on the basis of availability of position angle measurements in Plionis (1994), has and .
An area of radius spanning from to was used so as to correspond to Mpc at the distance of the clusters. In the cases of nearby clusters () the corresponding radius is Mpc. An interactive procedure was followed in which the parameters of the SExtractor identification were varied so as to maximise the number of detected objects, while not breaking-up the brightest galaxies into subcomponents. Although the SExtractor star-galaxy separation is quite efficient, it fails to correctly separate stars from galaxies for saturated objects and at the faint luminosity end. Bright stars were therefore excluded by hand. Similarly, satellite tracks and other noise signal were excluded after careful visual inspection of each field.
The total number of Sextracted galaxies is out of which the majority covers a very small surface area and thus have unreliable classification. In the presence of no systematic effects, related to the size of the galaxies, we expect that the mean ellipticity should be independent of the galaxy image size. In figure 1 we plot the derived galaxy ellipticity as a function of the number of pixels per galaxy. It is evident that for there is a systematic offset of the mean ellipticity to higher values. Therefore, in order to avoid biases, having to do with determining galaxy shape parameters using small number of pixels and the inefficiency of the star-galaxy separation at lower surface brightness, we choose to analyse only the higher 5% quantile of the galaxy size distribution (estimated independently in each field). The selection of this limit was based on a further trial and error approach in which the distribution of galaxy position angles was tested for homogeneity (see tests below) and it is such that always .
Furthermore, we have tested, for the above size limits, the ellipticities of the unsaturated stellar images in our fields, for which deviations from zero should reflect possible PSF anisotropies. We find that the stellar ellipticity frequency distribution peaks at and has an exponential drop thereafter (figure 2). We have verified by visual inspection of a random subset of our fields that the major contribution to the high- tail of the stellar ellipticity distribution comes from misclassified galaxies, double stars as well as background projections near the stellar images.
Therefore, from the above analysis and in order to avoid ill definitions of position angles (due to near sphericity) and possible PSF anisotropies while not throwing away too many galaxies, since a considerable fraction of ellipticals have relatively small ellipticities, we feel secure to use, in our study, galaxies that have ellipticities . In any case, we expect that any residual anisotropy that still remains in our sample will be identified in the Fourier-analysis test, presented below, but should bare no correlation with the parent cluster orientations and thus should not introduce any artificial alignments. These selection procedures reduce the total number of analysed galaxies to 15560, with no galaxies having an area smaller than (ie., ).
The statistical analysis of alignments between galaxy and cluster orientations depends on defining the relative orientation of the galaxies with respect to the cluster,
| (1) |
where and are the position angles of the galaxies and cluster, respectively. In an isotropic distribution we will have . A significant deviation from this value would be an indication of an anisotropic distribution which can be quantified by (Struble & Peebles 1985):
| (2) |
In an isotropic distribution we will have , while the standard deviation is given by . A negative value of would indicate alignment and a positive one misalignment.
2.1 Tests for systematics directional biases
Before we analyse the possible galaxy-cluster alignments, we test whether the galaxy position angles, , in our final galaxy sample, have any significant directional bias. We quantify possible deviations from isotropy by a variety of methods:
-
•
estimating the Fourier transform of the galaxy position angles (cf. Struble & Peebles 1985):
(3) If the ’s are uniformly distributed between and , then for large N both and have zero mean and unit standard deviation. This test measures the tendency of the position angles to cluster around some particular values. For example, the and components measure deviations in the , and , directions respectively. Indeed, if we find Fourier components with values this would imply systematic directional bias at a level.
-
•
applying three statistical tests on the distribution of ’s to test whether they could originate from an isotropic parent distribution of position angles. These are the classical (parametric), the Kolmogorov-Smirnov (non-parametric) and the Rayleigh tests (cf. Mardia 1972). The later estimates the parameter:
(4) For large N we have that for 2 degrees of freedom and the probability that a value of exceeds a critical value is given in Mardia (1972).
In figure 3 we present the distribution of galaxy position angles for our total sample as well as for the 10 largest galaxies (excluding the BCG) in each cluster field. The distribution appears flat with no directional bias, as quantified also by the different statistical tests, presented in table 1, where we also list the values of the first Fourier moments for the different galaxy samples. We do find , indicating the existence of no significant directional bias. However, had we imposed no galaxy size limit we would have found significant deviations from isotropy with very large values of the first moments due to inefficient star-galaxy separation (we deduce this from the fact that we find the same anisotropy pattern when we analyse the stars in our fields).
The above analysis is based in treating all galaxies together, irrespectively of the cluster field to which they belong. This does not exclude the possibility that some cluster fields maybe severely affected by biases, a possibility that could be hidden when treating all the galaxies together. To this end we calculate the Fourier moments independently in each field. If there is no bias then the distribution, over the 303 fields, of the individual Fourier moments should be a Gaussian with zero mean and unit standard deviation. In figure 4 we plot their distributions and the corresponding zero-mean Gaussians. We find , and , . A test shows that the distributions are statistically equivalent to zero-mean Gaussians at a significance level (we find similar results for the higher moments as well). Therefore it seems that the small excess of ’s at negative values is not very significant although it is responsible for the small negative shift of the and for the 20% excess of its variance. Indeed if we exclude the 7 cluster fields with we reduce the overall value of (see table 1) from -2.3 to -0.9 and the mean over the 296 cluster fields to . However, our alignment results, presented below, remain unchanged when excluding these fields.
2.2 Results
In order to maximise the alignment signal to noise ratio we have stacked all cluster images after rotating them so as to have a common orientation along their determined position angles. We then estimate the misalignment angle between every galaxy and the common cluster orientation. In order to identify where does the possible alignment signal come from, we apply our test to different subsamples of galaxies. One is only the Brightest Cluster galaxy (BCG), another is the next 10 largest galaxies (10LGs) and finally all the galaxies but the BCG and 10LGs. The alignment results for different subsamples are presented in table 2. We find that the over all 15560 galaxies in the 303 clusters, alignment signal is quite weak but significant (, ). Confining ourselves to the 10LGs we find a stronger alignment signal. Finally and as expected, we find a very strong and statistically significant alignment signal between the BCG’s and the clusters position angles.
2.2.1 Statistical quantification
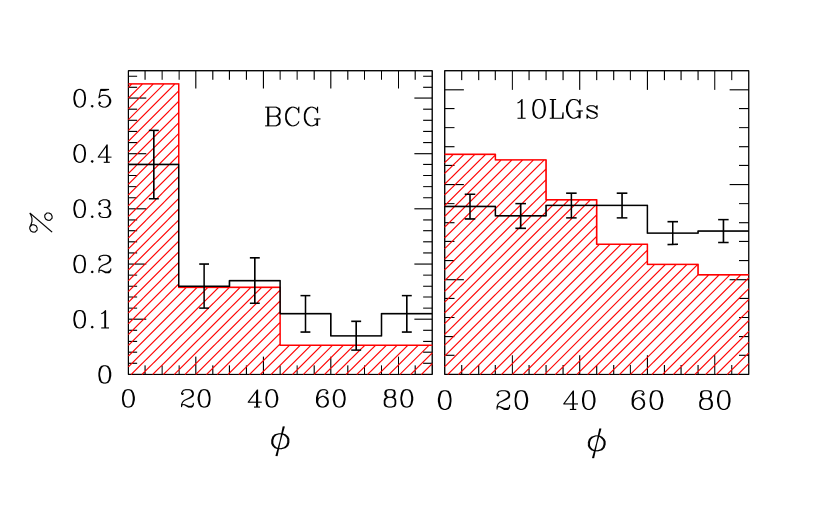
In figure 5 we present the distribution of misalignment angles, for the BCG and 10LGs case. We performed a test with 5 degrees of freedom to assess whether the observed distribution could be drawn from an isotropic one. Furthermore we also applied a non-parametric Kolmogorov-Smirnov (KS) test and compared the un-binned -values with the isotropic case. The results of these tests are presented in Table 2. There are significant deviations from isotropy for the sample containing all the galaxies as well as for the BCG and the 10LGs samples. Note however, that when excluding the BCG’s and 10LG’s no significant deviation from isotropy is found (last row in table 2). For fainter galaxies the combination of projection effects, which tend to smear out any existing alignment, and shape parameter uncertainties, could hide an existing alignment effect and thus we cannot derive any strong conclusion from our present analysis. Unfortunately, we do not have colour information in order to attempt to decontaminate the cluster fields by selecting the red-sequence galaxies, as we will do in our case study of A521.
Also note that the joint probability of the observing the alignments of the BCG and 10LGS samples should increase if one considers (a) the two samples as being independent of each other and (b) that the deviation from isotropy, in both, is toward the same (alignment) direction.
2.2.2 Dependence on environment
We investigate further whether there is any correlation of the alignment signal with the environment. It is already known that clusters in high-density environments show stronger cluster-cluster alignments and more substructure than in low-density ones, as would be expected if such clusters are still accreting matter along the large-scale filamentary structures in which they are embedded (cf. Plionis & Basilakos 2002; Schüecker et al. 2001). We have therefore found which of the clusters in the subsample analysed do belong to superclusters. To this end, we have performed a percolation analysis to identify superclusters in the whole Abell sample with a magnitude cut , corresponding to a volume limited sample out to . We do find a weak tendency of increasing galaxy-cluster alignment signal in clusters belonging to higher overdensity superclusters. For example using clusters in superclusters found with a percolation radius of 15 Mpc one finds (, and , ). This tendency, weak as it may be, suggests a correlation between the galaxy-cluster alignment signal and the cluster dynamical state, since in high density environments, clusters are expected to be dynamically active as discussed previously.
2.2.3 Dependence on cluster dynamical state
We want to test the alignment behaviour of the cluster high velocity dispersion tail, expected to correspond to highly virialised massive clusters, since the virialisation process should have mixed the orientation of galaxies members, and thus weak or no galaxy alignments are expected. For this purpose we have analysed for alignments a subsample of 132 clusters that have estimated with more than 10 galaxies per cluster.
For the 32 clusters in our sample with km/sec, we obtain , with a distribution of misalignment angles being consistent with the isotropic case at a significance level of and . Correspondingly for the remaining 100 clusters of our sample with km/sec we obtain a weak alignment signal , . These results show a clear correlation of the alignment effect with velocity dispersion, which is in the opposite direction expected if the high dispersion clusters were indeed highly relaxed clusters.
If we further confine our analysis in clusters belonging to dense superclusters (percolation radius of Mpc) and with km/sec (in total 19 clusters) we obtain an even stronger alignment signal: , , higher than in both cases taken separately. In figure 6 we present the distribution of misalignment angles for the latter case (red hatched histograms) and for the clusters with found in any environment. The excess alignment signal for the high- clusters in dense environment is evident. Their probability of consistency with an isotropic distribution is for both the BCG and 10LGs distributions.
At this point, the high density environment of these clusters makes us suspect that their high velocity dispersion does not reflect high mass virialised clusters but rather the result of subclustering effects, (for example, due to the large relative velocities of the different sub-clumps), so that these objects would be in reality dynamically young clusters. We have then been looking in the literature for each individual cluster if signatures of dynamical youth can be detected in their X-ray, optical or radio images. We have found that for 12 (A1228, A2061, A399/A401, A1736, A1775, A2065, A401, A426, A754, A2256 and A85) of the 19 clusters, at least one signature does exist, for a further 3 we have not found any relevant information while only 4 appear to be virialised objects.
In detail, A1228, A2061, A399/A401, A1736 and A1775 show a multi-peaked velocity distribution, A2065, A401, A426 and A754 show features in the X-Ray temperature maps, A2256 shows sub-clustering in the optical density map. Moreover, A1190, A2256 and A754 show radio halo and relics, which are thought to be related to merging events (cf. Feretti & Giovanninni 1996, Feretti 2001). Finally, A85 presents signatures of merging in optical (presence of a foreground group in the velocity distribution), X-ray (double configuration of the isointensity contour map, with a primary and a secondary cluster) and in radio bands (presence of a radio relic).
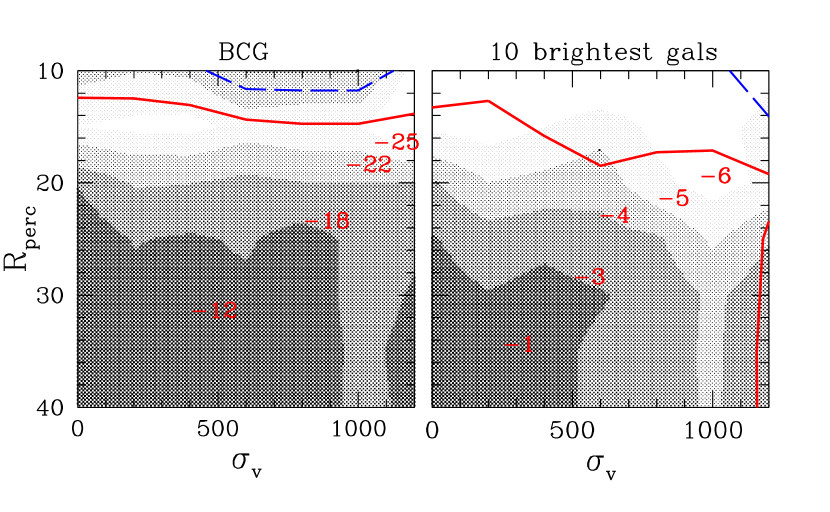
Since there is a triple correlation between alignments, velocity dispersion and superclustering, we present in figure 7 the alignment signal as a function of cluster velocity dispersion and percolation radius (for the 132 clusters of our sample that have measured and ). The alignment signal is represented as a grey scale, with increasing brightness meaning more alignments, as indicated by the printed values of , while the contour lines engulf regions of some significance level (the continuous and broken lines represent the 3 and 2.5 levels respectively). It is evident that for the 10LG case there is a significant trend of increasing alignment signal both with increasing and supercluster percolation radius. It is also interesting that for the BCG’s there seems to be a dependence of their alignment, with their parent cluster orientation, mostly to the environment, almost independent of their velocity dispersion. This could indicate a different (or “special”) formation process for the BCG, with respect to the other luminous cluster galaxies (cf. West 1994).
Our results indicate that cluster alignments are stronger in clusters located in a high density environment and characterised by a high-velocity dispersion. Since we already have independent indications that clusters in high-density environments show significantly more substructure (Plionis & Basilakos 2002; Schüecker et al. 2001), our results suggest that the strongest alignment effects have been detected in dynamically young clusters, ie., characterised by both a strong subclustering and a high-velocity dispersion.
3 A case study: the dynamical active Abell 521
The galaxy cluster A521 is a dynamically very active cluster with multiple evidences of merging both in optical and X-Ray data. In particular, its very high velocity dispersion of km/s (Maurogordato et al. 2000) has been explained as the result of various merging events (Ferrari et al. 2003). The main component of the cluster shows a clear North-West/South-East direction, both in X-ray and in optical, which is the main direction of the undergoing merger event, but also a high density ridge in the core region perpendicular to the main direction, suspected to result from an older merger. The cluster is embedded in a dense large-scale environment (Arnaud et al. 2000). At the light of the results of the previous section, this high velocity dispersion and highly substructured cluster embedded in high density environment should be an excellent target for detecting galaxy alignments.
Part of a larger program of a multi-wavelength follow up of merging clusters, Abell 521 has been covered with B- and I-band imaging obtained with the CFHT12k camera over a field of 4530 arcmin2 centred on the cluster. The galaxy catalogue (positions, magnitudes and shape parameters) was built with SExtractor. From the analysis of the I(B-I) colour-magnitude diagram we have extracted all the galaxies lying on the red sequence region allowing to select the most likely early type galaxies belonging to the cluster (see Ferrari et al. 2003). Such a filtering of the galaxy catalog is very important since foreground or background galaxies can significantly smear out any true alignment effect. The alignment analysis presented in the present paper has been performed using the shape parameters measured in the B-band image leading to a more precise measurement of the position angles than in the I-band where the light profiles of the galaxies are more peaked. In figure 8 we show the stellar ellipticity frequency distribution which peaks at and drops exponentially thereafter. Therefore, to avoid the gross effects of possible PSF inhomogeneities and to ensure a robust position angle determination (since it is ill defined for nearly spherical objects), we have imposed a minimum ellipticity of .
3.1 A521 Shape Parameters
The shape parameters of the cluster (ellipticity and position angle) were estimated using the familiar moments of inertia method applied on the smoothed or the discrete galaxy distribution (cf. Basilakos, Plionis & Maddox 2000 for such an application). First, all galaxies within an initial small radius around the cluster cD or X-ray centre (Arnaud et al. 2000) are used to define the initial value of the cluster shape parameters. Then, the next nearest galaxy is added to the initial group and the shape is recalculated and thus we obtain the cluster shape parameters as a function of cluster-centric distance. Within 1 Mpc of the central cD galaxy the cluster position angle and ellipticity have value of:
where the uncertainty is derived from the fluctuations around the mean by varying the limiting magnitude or by weighting each galaxy either by its or by unity.
3.2 Galaxy member orientations
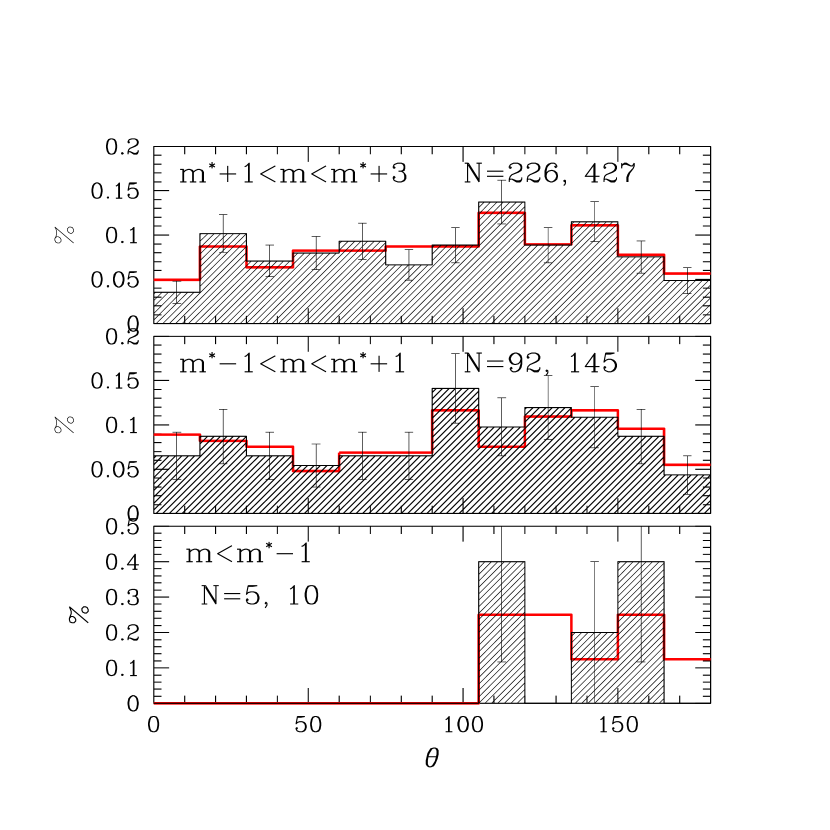
In figure 9 we present the galaxy position angles for different magnitude slices and for two limiting distances from the cluster centre, parametrised by which corresponds to the knee of the B-band optical galaxy luminosity function where and therefore . There is an evident concentration around in all magnitude bins, although at fainter magnitudes there is a slight shift toward the lower end of this range. This can be quantified by estimating the preferred galaxy orientation of the galaxy position angle distribution using the fundamental harmonics () of their Fourier transform (cf. Djorgovski 1983):
| (5) |
The values of for the different magnitude slices within 1.5 and 2.5 Mpc from the cluster centre, are reported in table 3 and it is evident that they are in good agreement with the cluster position angle which also coincides with the direction () to the nearest Abell cluster neighbour (Abell 517). These results are robust to changes of the limiting galaxy ellipticity as can be seen in table 3. Furthermore, it is extremely interesting that the same galaxy preferred orientation is evident within 1.5 and also within 2.5 Mpc from the cluster central cD galaxy. The fact that the preferred galaxy orientation, , coincides with the orientations of the cluster major axis, of the brightest cluster galaxies and with the direction to the nearest cluster neighbour is a strong indication that the anisotropic orientation distribution is not due to possible systematics and strongly supports the anisotropic merger structure formation scenario.
In table 3 we also present the outcome of the statistical tests used to assess the significance of our results. It is evident that the brightest and faintest slices present results significantly different from the Poisson expectations, while the intermediate slice shows low significant difference. This however could be because in this magnitude range, there appears to be an excess of galaxies with position angles at , which coincides with the direction of the ridge structure S1 of Arnaud et al. (2000) and which is mostly evident in this magnitude range. Note that if we use all the galaxy position angles down to all three tests show a significant difference from the Poisson expectation at a 99.999% level.
3.3 A521 groups orientation
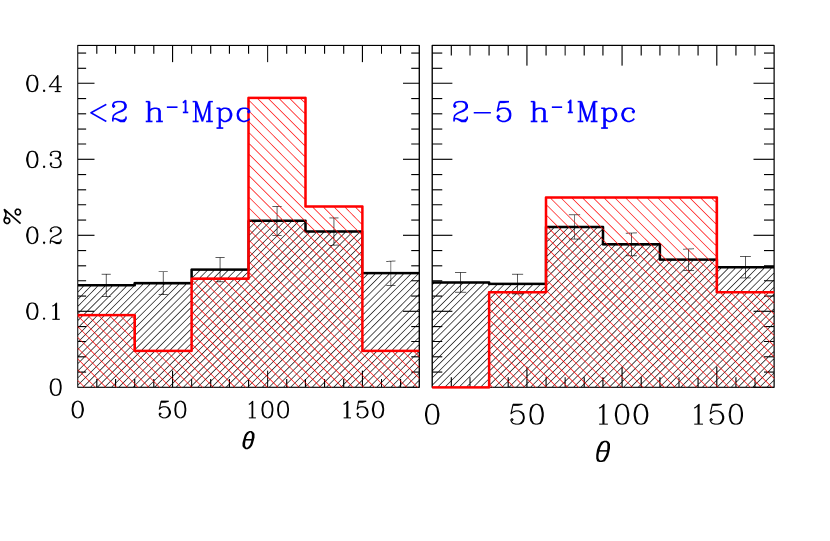
Since the matter distribution outside the cluster itself could be anisotropically distributed, not necessarily following the orientation indicated by the cluster major-axis, we have estimated the preferred orientation of the high-density regions as well as the galaxy major axis preferred orientation in independent shells of Mpc width each. To this end we estimate the major axis orientation of the projected high-density excursion set (which correspond to groups of galaxies and different substructures) by Gaussianly smoothing the projected galaxy distribution on a grid (with ranging from 300 to 400) and measuring the position angles of dense groups () containing more than 12 cells (surface area kpc2).
We find that the group orientation distribution closely follows that of the individual galaxies with an almost identical preferred orientation angle, . This is clearly seen in figure 10 were we present the histogram of the group and galaxies position angles (red and black histogram respectively), for two cluster-centric distances (one within the nominal radius of 2 Mpc and one between 2 and 5 Mpc; were the last group is found). Note that, in order to detect groups in the outer shell, we have reduced the density threshold to . In table 4 we present the preferred orientations of groups and of galaxies in the different shells, their misalignment angle and the probability that this misalignment angle is due to chance. The misalignment angle between the galaxy and group preferred orientations in the 3rd and 4th bin reduces to if we apply our analysis to a lower limiting magnitude (), since we do expect a higher fraction of projection contamination from apparently faint galaxies outside the dense cluster region.
3.4 Outcome
We therefore conclude that the dynamically very young and in the phase of merging Abell 521 shows significant red-sequence galaxy major-axis alignments, within the cluster but also in its nearby environment ( Mpc), with (a) the cluster major-axis orientation, (b) the groups/substructures preferred orientation and (c) with the direction of the nearest Abell cluster (A517).
4 Summary
We have set out to investigate whether galaxies in clusters show any alignment of their major axis with the cluster orientation and whether such an effect is related to the cluster environment and dynamical state. We tackle this question by using a statistical approach, analysing the POSS scans of 303 Abell clusters (, ) and a case study of a highly dynamically active cluster (A521) using multicolour, wide-field, deep imaging data.
In order not to contaminate our statistical results with the well-established BCG-cluster alignment we have excluded these galaxies from our analysis. We find that clusters indeed show significant bright galaxy major axis alignments with the cluster position angle but only in high-density environments (superclusters). Furthermore, the alignment signal is stronger in higher velocity dispersion clusters. Moreover, we have also found in our sample that the high velocity dispersion clusters, in high density environments, appear to be dynamically young, merging clusters, a fact which points strongly in the direction of galaxy alignments being correlated with their parent cluster dynamical youth.
Similarly, in our detailed analysis of the dynamically very active Abell 521 we have found significant red-sequence galaxy alignments out to Mpc from cluster core. The alignments are evident within the cluster as well in the outer environment and the preferred galaxy orientation is closely related to the mass distribution orientation, as well as with the direction of the nearest Abell cluster (A517).
These results provide evidence that significant galaxy alignments are present in dynamically young clusters belonging in superclusters, that also extend to the large-scale environment around clusters. Furthermore, these results lead also to the necessity of a possible revision of all those cluster weak lensing studies done in only one pass band, in which case it is impossible to separate background objects from the cluster members.
References
- (1) Abell, G.O., 1958, ApJS, 3, 211
- (2) Abell, G.O., Corwin, H.G., Jr., Olowin, R.P., 1989, ApJS, 70, 1
- (3) Adams, M.T., Strom, K.M., Strom, S.E., 1980, ApJ, 238, 445
- (4) Arnaud, M., Maurogordato,S., Slezak, E., Rho,J., 2000, A&A, 355, 461
- (5) Barnes, J. & Efstathiou, G., 1987, ApJ, 319, 575
- (6) Bartelmann, M., Schneider, P., 2001, Phys.Rep., 340, 291
- (7) Basilakos, S., Plionis, M., Maddox, S., 2000, MNRAS, 316, 779
- (8) Bertin, E.; Arnouts, A&AS, 1996, 117, 393
- (9) Bingelli B., 1982, AA, 250, 432
- (10) Brown, M.N., Taylor, A.N., Hambly, N.C., Dye, S., 2002, MNRAS, 333, 501
- (11) Carter, D. & Metcalfe, N., 1980, MNRAS, 191, 325
- (12) Catelan, P., Kamionkowski, M., Blandford, R.D., 2001, MNRAS, 320, L7
- (13) Chambers, S.W., Melott, A.L., Miller, C.J., 2002, ApJ, 565, 849
- (14) Bond, J.R., 1987, in Nearly Normal Galaxies, ed. Faber, S., (New York: Springer-Verlag), p.388 (Dordrecht: Reidel), p.255
- (15) Cabanela, J. E.; Aldering, G., 1998, AJ, 116, 1094
- (16) Coutts, A., 1996, MNRAS, 278, 87
- (17) Djorgovski, S., 1983, ApJ, 274, L7
- (18) Djorgovski, S., 1987, in Nearly Normal Galaxies, p.227, Springer-Verlag
- (19) Durret, F., Forman, W., Gerbal, D., Jones, C., Vikhlinin, A., 1998, A&A, 335, 41
- (20) Faltenbacher, A., Kerscher, M., Gottloeber,S., Mueller, M., 2002, A&A, 395, 1
- (21) Feretti, L., 2001, in IAU Symp. 199, The Universe at Low Radio Frequencies, ed. A. Pramesh Rao (San Francisco: ASP)
- (22) Feretti, L., & Giovannini, G., 1996, in IAU Symp. 175, Extragalactic Radio Sources, ed. R. Ekers, C. Fanti, & L. Padrielli (Dordrecht: Kluwer), 333
- (23) Ferrari, C., Maurogordato, S., Cappi, A., & Benoist, C., 2003, A&A, 399, 813
- (24) Fuller, T.M., West, M.J. & Bridges, T.J., 1999, ApJ, 519, 22
- (25) van Kampen, E., Rhee, G.F.R.N., 1990, A&A, 237, 283
- (26) Heymans, C., Heavens, A., 2003, MNRAS, 339, 711
- (27) Kim, R.S.J., et al. (SDSS collaboration), 2001, astro-ph/0110383
- (28) King, L.J., Schneider, P., 2003, A&A, 398, 23
- (29) Lee, J. & Pen, U., 2002, ApJ, 567, L111
- (30) Mardia, K.V., 1972, Statistics of Directional Data, (Academic, London)
- (31) Maurogordato, S., Proust, D., Beers, T., Arnaud, M.,Pello, R., Capp, A., Slezak, E., 2000, A&A, 355, 848
- (32) Onuora, L.I., Thomas, P.A, 2000, MNRAS, 319, 614
- (33) Plionis M., 1994, ApJS., 95, 401
- (34) Plionis M., 2001, in the proceedings of the Clusters and the High-Redshift Universe observed in X-rays, XXIth Moriond Astrophysics Meeting, eds. Neumann et al., in press
- (35) Plionis, M. & Basilakos, S., 2002, MNRAS, 329, L47
- (36) de Propris, R. et al., 2002, MNRAS, 329, 227
- (37) Quinn, T. & Binney, J., 1992, MNRAS, 255, 729
- (38) Salvador-Sole, E. & Solanes, J.M., 1993, ApJ, 417, 427
- (39) Sastry, G.N., 1968, PASP, 80, 252
- (40) Schüecker, P., Böhringer, H., Reiprich, T. H., Feretti, L., AA, 2001, 378, 408
- (41) Splinter, R.J., Melott, A.L., Linn, A.M., Buck, C., Tinker, J., 1997, ApJ, 479, 632
- (42) Struble, M.F., 1990, AJ, 99, 743
- (43) Struble, M.F., Peebles, P.J.E., 1985, AJ, 90, 582
- (44) Struble, M.F., Rood, H.J., 1999, ApJS, 125, 35
- (45) Usami, M. & Fujimoto, M., 1997, ApJ, 487, 489
- (46) Tormen, G., 1997, MNRAS, 290, 411
- (47) Trevese, D., Cirimele, G., Flin, P., 1992, AJ, 104, 935
- (48) van Haarlem, M., van de Weygaert, R., 1993, ApJ, 418, 544
- (49) West, M. J., 1989, ApJ, 347, 610
- (50) West, M. J., Villumsen, J.V., Dekel, A., 1991, ApJ, 369, 287
- (51) West, M. J., 1994, MNRAS, 268, 79
- e.g. West, Jones & Forman (1995) West, M.J., Jones, C., & Forman, W., 1995, ApJ, 451, L5


| sample | ||||||||
|---|---|---|---|---|---|---|---|---|
| all gal’s | 15560 | -2.3 | 0.1 | 1.6 | -0.8 | 0.08 | 0.31 | 0.78 |
| 10LG’s | 3030 | 0.9 | -0.3 | -1.1 | -0.2 | 0.72 | 0.83 | 0.46 |
| sample | ||||||
|---|---|---|---|---|---|---|
| all gal’s | 15560 | -0.9 | 0.2 | 4.5 | 0.035 | 0.005 |
| 10LGs | 3030 | -1.6 | 0.5 | 3.3 | 0.028 | 0.003 |
| BCG | 303 | -9.6 | 1.5 | 6.4 | ||
| all but BCG & 10LG’s | 12227 | -0.8 | 0.2 | 3.4 | 0.86 | 0.59 |
| mag. bin | |||||||
|---|---|---|---|---|---|---|---|
| and Mpc | |||||||
| 19.8 | 5 | 134∘ | -29.2 | 11.62 | |||
| 19.8 - 21.8 | 92 | 118∘ | -4.33 | 2.71 | |||
| 21.8 - 23.8 | 226 | 109∘ | -2.26 | 1.73 | |||
| 24.8 | 435 | 114∘ | -3.5 | 1.24 | |||
| and Mpc | |||||||
| 19.8 | 3 | 148∘ | -37.0 | 15 | |||
| 19.8 - 21.8 | 43 | 124∘ | -8.2 | 3.96 | |||
| 21.8 - 23.8 | 79 | 104∘ | -1.83 | 2.92 | |||
| 24.8 | 175 | 115∘ | -4.8 | 1.96 | |||
| and Mpc | |||||||
| 19.8 | 10 | 136∘ | -23.0 | 8.2 | |||
| 19.8 - 21.8 | 145 | 133∘ | -4.3 | 2.1 | |||
| 21.8 - 23.8 | 427 | 109∘ | -2.2 | 1.2 | |||
| 24.8 | 804 | 114∘ | -3 | 0.9 | |||
| shell ( Mpc) | ||||||
|---|---|---|---|---|---|---|
| 0 - 1 | 237 | 117∘ | 8 | 115∘ | 2∘ | 0.0003 |
| 1 - 2 | 369 | 113∘ | 7 | 118∘ | 5∘ | 0.0019 |
| 2 - 3 | 361 | 112∘ | 2 | 144∘ | 32∘ | 0.0760 |
| 3 - 4 | 442 | 81∘ | 7 | 130∘ | 49∘ | 0.1719 |
| 4 - 5 | 380 | 113∘ | 4 | 111∘ | 2∘ | 0.0003 |