Analysis of the Interaction Effects in the Southern Galaxy Pair Tol1238-364 and ESO381-G009111Based on data collected at the ESO-MPIA 2.2 m telescope in La Silla, Chile
Abstract
In the context of the connection among galaxy-galaxy interaction, starbursts and nuclear activity, we present and discuss a quantitative morphological analysis based on images and a detailed spectroscopic investigation of two interacting galaxies, the Seyfert 2 Tol1238-364 (IC 3639) and its companion ESO381-G009, forming a triple system with ESO381-G006. Broad-band optical photometry is complemented by H imaging, which provides information about the distribution of star forming regions across the galaxies. Long-slit spectroscopic data obtained at different position angles of the slit are employed to determine the physical conditions of circumnuclear and extranuclear regions. A mixture of thermal and non-thermal ionizing radiation is found in the surroundings of the nucleus of Tol1238-364 and the energy budget supports the presence of a circumnuclear starburst. Several regions in both the galaxies show anomalous line ratios: additional ionization by shock-heating and low ionization of some extranuclear H II regions are suggested as possible explanations. An analysis of the emission-line profiles reveals the presence of a broad H component in the nuclear region of Tol1238-364. Independent estimates of the star formation rates (SFR) were obtained through flux-calibrated H-images and FIR emission in the four IRAS bands. Overall SFR densities have been compared with the SFR densities derived from H emission in the individual regions of the galaxies sampled by long-slit spectra. In both the galaxies an enhancement of the star formation activity with respect to isolated galaxies is revealed. The prevalence of starburst or nuclear activity has been examined through FIR color indices. The interaction scenario is discussed on the basis of the observed galaxy properties.
1 INTRODUCTION
The importance of the role played by interaction in triggering nuclear bursts of star formation and activity in galaxies has been clearly pointed out in the last decades. N-body simulations have shown that interactions drive large gas flows toward the center of galaxies (e.g. Barnes & Hernquist 1991). Disk instabilities in colliding galaxies lead rapidly to the formation of strong bars and to gas inflows fueling early starbursts and/or AGN activity before the galaxy merging (Mihos & Hernquist, 1996; Barnes & Hernquist, 1996; Mihos, 1999). The role of the orbital geometry in triggering inflow and activity has been considered: prograde encounters favor bar instabilities (Barnes & Hernquist, 1996).
Other clues to the connection between interaction and starburst and AGN activity come from several statistical studies: an excess of both starburst and Seyfert galaxies among galaxy pairs and an excess of physical companions in samples of starburst galaxies (SBGs) and Seyferts have been observed (e.g. Keel & Van Soest, 1992; Rafanelli, Violato, & Baruffolo, 1995; Rafanelli, Temporin, & Baruffolo, 1997).
Detailed studies of interacting systems can provide a mean to evaluate the validity of this scenario (e.g. Rifatto et al., 2001). In this context we performed a photometric and spectroscopic analysis of the Seyfert 2 Tol1238-364 and of its companion ESO381-G009, as well as an evaluation of far-infrared (FIR) emission of each galaxy of the pair in order to determine the physical properties of circumnuclear and extranuclear regions and to obtain independent estimates of the star formation rates.
Tol1238-364 is a Seyfert 2 galaxy morphologically classified as SB(rs)bc; its near infrared bar is aligned at P. A. = 150∘ (Mulchaey, Regan, & Kundu, 1997; González Delgado et al., 1998). After the recent detection of a broad H component in polarized light (Heisler, Lumsden, & Bailey, 1997), the galaxy is listed among the Seyfert 2s hosting a hidden broad line region (HBLR). The column density, as measured by means of the photoelectric absorption cutoff in the hard X-ray spectrum, assumes values larger than 1025 cm-2 (Risaliti, Maiolino, & Salvati, 1999). It is also classified as Luminous Infrared Galaxy (LFIR = 4.36 L⊙, Lutz 1992) and is located in the “radio-bright” side of the FIR/radio correlation (Helou, Soifer, & Rowan-Robinson, 1985), as shown by Bransford et al. (1998). It forms a triple system along with the almost face-on SB(r?) ESO381-G009, located at 1′.8 arcmin North-East and an edge-on galaxy 2′.6 arcmin to North-West (e.g. Karachentseva & Karachentsev, 2000). Even if the optical images do not reveal strongly distorted morphologies, traces of plumes and bridges of neutral gas have been detected in the H I 21 cm line (Babic, Price, & Jones, 2000; Barnes & Webster, 2001). However, the neutral hydrogen appears still bound to the individual galaxies. Its mass, based on Australia Telescope Compact Array observations in the 21 cm line (Barnes & Webster, 2001), is of 3.6, 4.0, and 1.5 10 M⊙ for Tol1238-364, ESO381-G009, and ESO381-G006, respectively. The same data show that the radial velocities, listed in Table 1 together with the coordinates and B-band absolute magnitudes of the three galaxies, are concordant.
The Seyfert 2 and its NE-companion are characterized by strongly enhanced star formation also in the nuclear region. The starburst nature of Tol1238-364 is pointed out by UV (González Delgado et al., 1998; González Delgado & Heckman, 1999), FIR (Lutz, 1992) and radio (Bransford et al., 1998) observations. ROSAT HRI data show soft X-ray emission extended up to a radius of 6.8 kpc best fitted with a two-component model of a power law and thermal emission (Levenson, Weaver, & Heckman, 2001). ESO381-G009 presents enhanced FIR emission, even if its FIR luminosity is not sufficient to classify it as Infrared Luminous Galaxy (LFIR = 7.42 L⊙, Lutz 1992).
The present paper is organized as follows: Observations and data reduction are described in § 2. The main properties of the galaxies are derived through the analysis of the photometric and spectroscopic data and the comparison with photoionization models in § 3. Comments on the FIR emission of each of the two galaxies obtained applying Maximum Entropy procedures to the IRAS data, are given in § 4. The results are summarized and extensively discussed in § 5, where considerations on the environment of the galaxies and the evolutionary history of the triplet are expressed, as well.
2 OBSERVATIONS AND DATA REDUCTION
Our data were obtained under good seeing conditions ( 1′′) during an observing run in April 1995 at the ESO-MPIA 2.2 m telescope in La Silla, equipped with the Faint Object Spectrograph and Camera EFOSC2. The detector was a 1k1k CCD with a pixel size of 19 m and a scale of 0.336 arcsec/pixel. Two images were taken during the same nights in redshifted, narrow band H ( = 6651.7 Å, FWHM = 61.3 Å) and continuum ( = 6521.2 Å, FWHM = 74.3 Å) filters. The spectrophotometric standard star Kopff 27 was also observed with the same filters. Additionally broad-band images of both galaxies, together with standard star fields, were taken. Observation details concerning both imaging and spectroscopy, including exposure times, slit position angles (P.A.), and limit surface brightnesses and magnitudes are summarized in Table 2.
H images were reduced in a standard way: they were bias-subtracted, flat-fielded, cleaned from cosmic rays, and background subtracted. The tabulated spectrum of Kopff 27 was convoluted with the system (filter + CCD + telescope) transmission curve and normalized to the bandwidth of the H filter. From the comparison with the counts measured on the images, corrected for atmospheric extinction, we computed the zero points to be applied for flux calibration.
The flux calibrated images were corrected for atmospheric extinction. The continuum image was aligned to the H image using field stars close to the galaxy and then subtracted from it; a check that the scaling factor derived from the photometric calibration was correct was given by the disappearance of non saturated stars in the continuum-subtracted image. A further check consisted in comparing the H fluxes of the nucleus and the extranuclear regions extracted from the spectra (see below) with those of the relevant regions in the calibrated image. The fluxes were found in good agreement (they differ by less than 20%, which is within the errors of measurement).
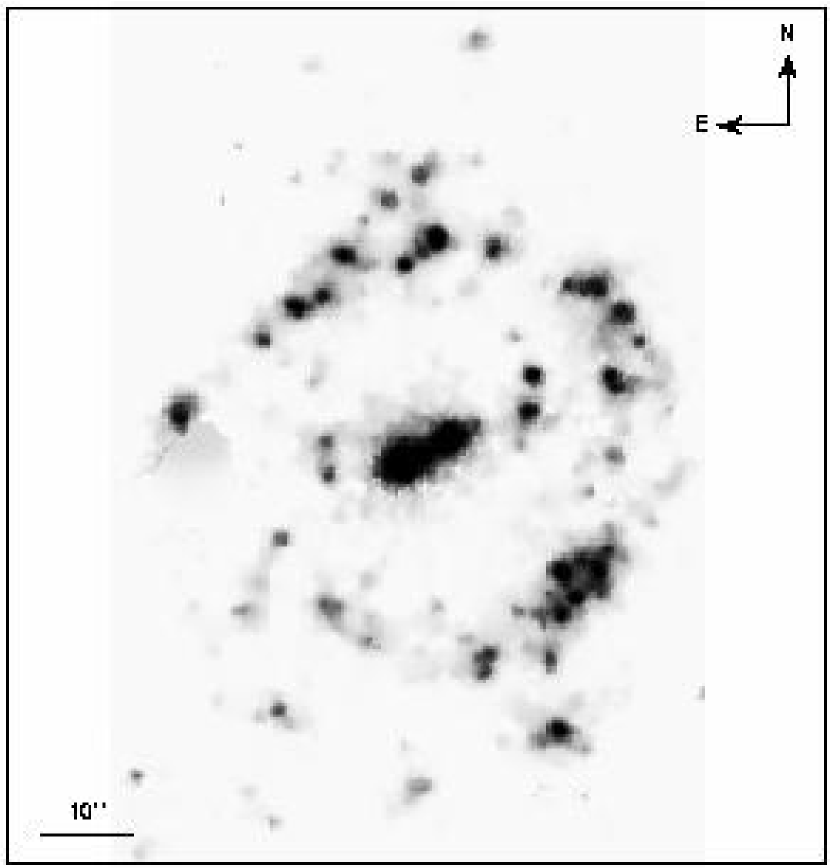
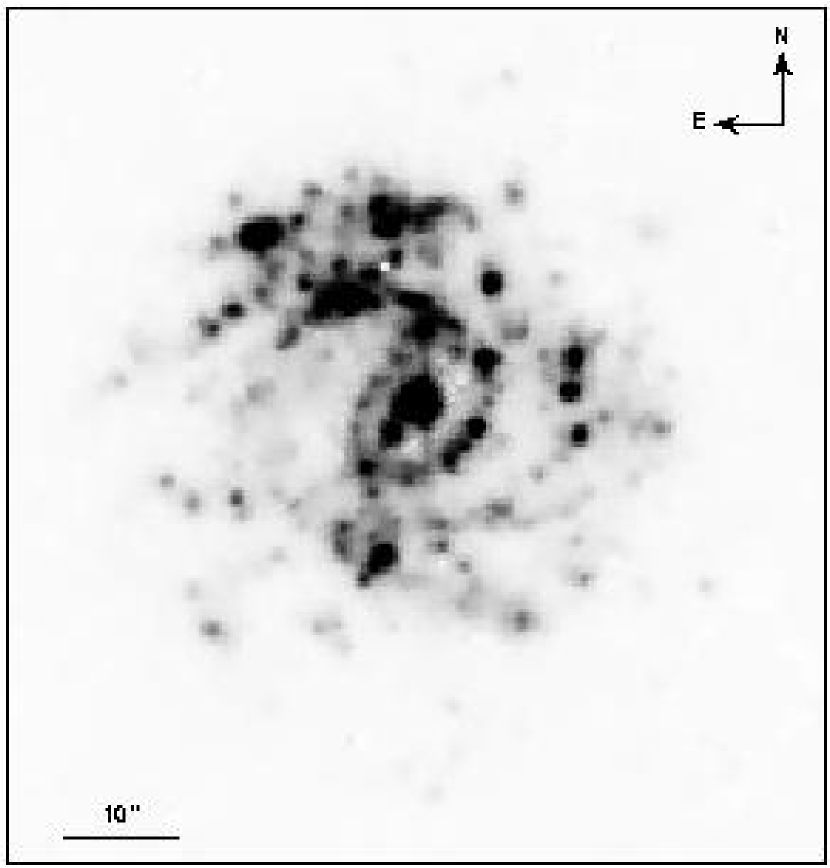
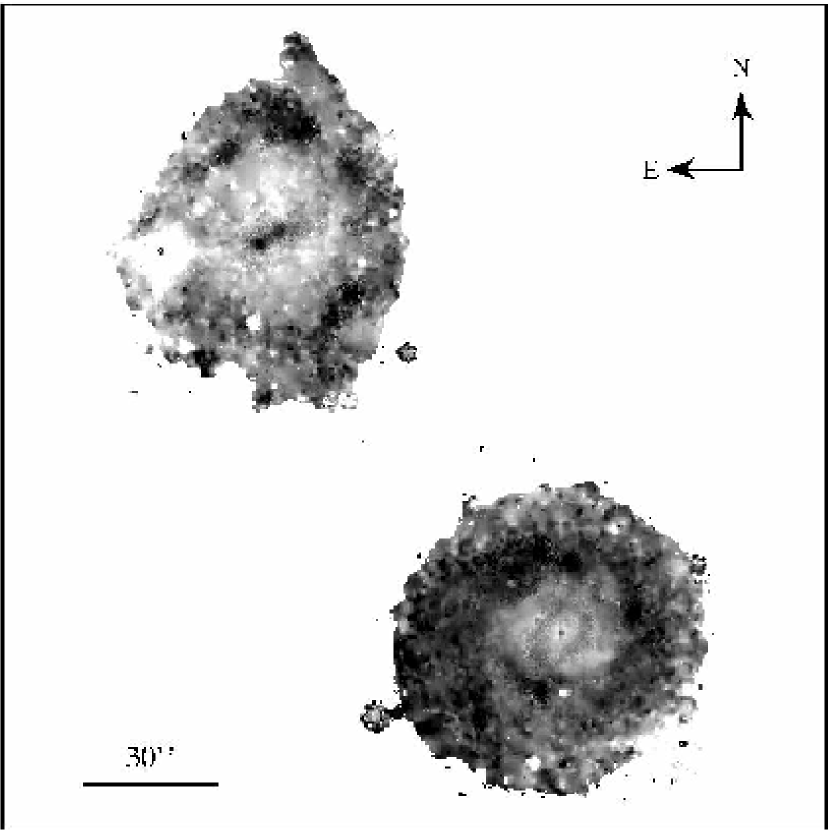
After the subtraction of the H-continuum component, the images were processed by means of an adaptive smooth filtering procedure developed at the Astrophysikalisches Institut Potsdam (Richter et al., 1991; Lorenz et al., 1993) in order to reduce the noise and enhance faint details of the internal structure of the galaxies (Fig. 1). images were also reduced in a standard way and registered. The non-saturated foreground stars were subtracted by fitting them with a model of the point spread function (PSF) obtained with IRAF222IRAF is distributed by the National Optical Astronomy Observatories, which are operated by the Association of Universities for Research in Astronomy, Inc., under cooperative agreement with the National Science Foundation/DAOPHOT routines. Saturated stars were masked with the task IMEDIT. The photometric calibration constants have been derived by use of the package PHOTCAL applied to the standard stars, with the usual transformation equations. A color map (Fig. 2) was obtained to analyze the color gradient across the galaxies and to have an insight into the spatial distribution of young and old stellar populations.
A 2′′-wide slit was used to obtain long-slit spectra covering the spectral ranges 3200–6030 Å (grism #3) and 3850–7950 Å (grism #6) with dispersions 1.9 Å pixel-1 and 2.6 Å pixel-1 respectively. The resulting spectral resolution estimated from the FWHM of faint comparison lines is of the order of 10 Å, while the scale along the slit is 0′′.336 pixel-1.
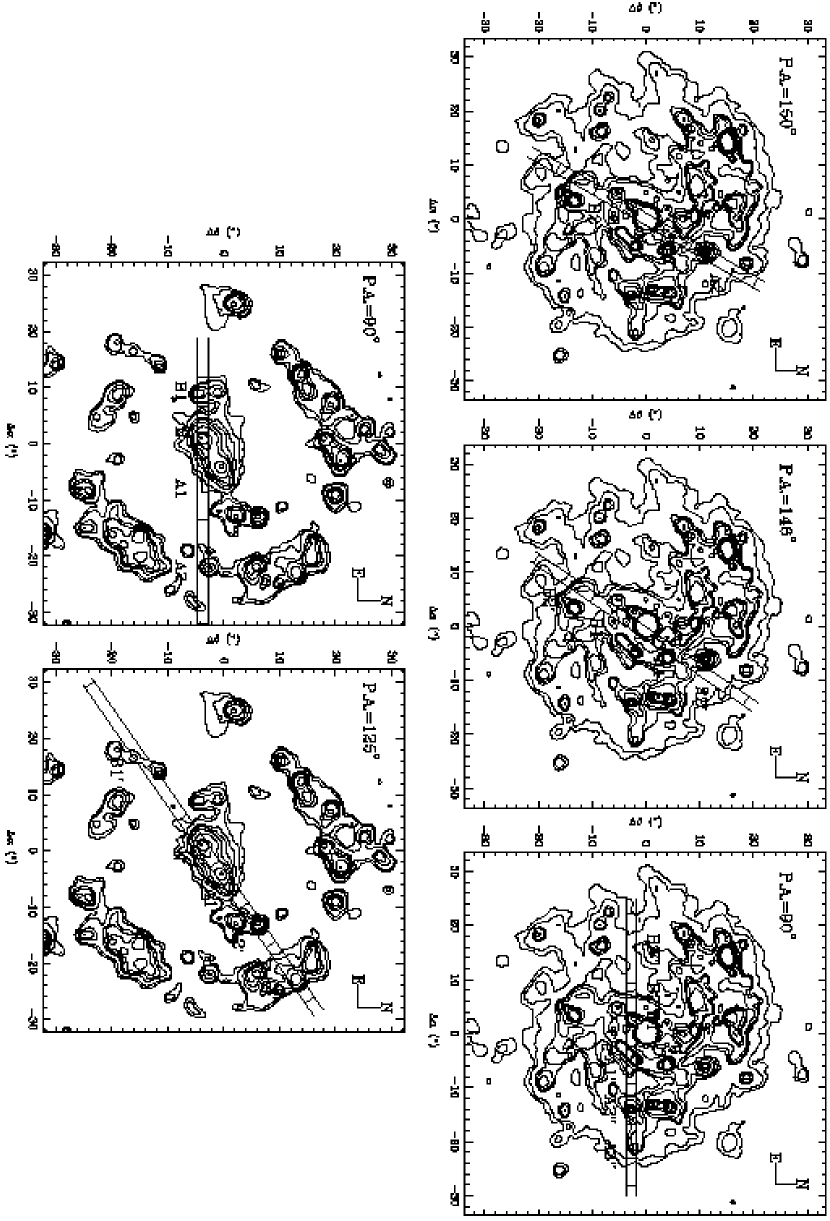
Tol1238-364 was observed at three different slit position angles: P.A. = 90∘, 146∘, and 150∘. The spectra at P.A. = 150∘ and 146∘ were taken across the center of the galaxy (the first one along the galaxy’s bar and centered on the nucleus), while the spectrum at P.A. = 90∘ covers the region 3′′ South of the nucleus, where many knots of emission are visible in the H image (Fig. 3, top). The spectra of ESO381-G009 were taken at P.A. 90∘ and 125∘ through the nucleus (Fig. 3, bottom). This last orientation of the slit allowed to observe both the nucleus and the emission knot on its NW side (see Fig. 3, bottom). Spectra of the standard stars Kopff 27 and Feige 56 were taken immediately before or after the spectra of the galaxies, to allow their flux calibration.
The two-dimensional spectra were reduced with standard IRAF packages: after bias subtraction, flat-fielding and a careful subtraction of cosmic rays, they were wavelength calibrated. The IRAF tasks IDENTIFY, REIDENTIFY, FITCOORDS, and TRANSFORM were used in sequence to determine the dispersion solution and linearize the two-dimensional spectra. An estimate of the wavelength calibration error was obtained by evaluating the of the mean difference between measured and predicted sky-line wavelengths. This value is 1.3 Å, equivalent to 80 km s-1 at = 5000 Å. The spectra were corrected for atmospheric extinction and calibrated (CALIBRATE) to a flux scale using sensitivity functions obtained with the tasks STANDARD and SENSFUNC applied to the observed spectrophotometric standard stars. Finally the sky-background was fitted by using two column samples at both sides of the galaxy spectrum and subtracted with the task BACKGROUND.
Contour maps of the extended H + [N II] 6548,6583 emission lines and continuum-subtracted H profiles along the slit were used to identify and extract the spectra of the nucleus and of several extranuclear emitting regions. Such regions are labeled on the slit images overlaid to the contour maps of the galaxies in Fig. 3: labels without apex are used for regions at P.A. = 150∘ in Tol1238-364 and P.A. = 90∘ in ESO381-G009, an apostrophe indicates the regions at P.A. = 146∘ in Tol1238-364 and P.A. = 125∘ in ESO381-G009, while a quotation mark indicates the regions at P.A. = 90∘ of Tol1238-364.
A comparison with the H images revealed a clear one-to-one correspondence among the so-selected emitting regions and the emission knots enhanced by the adaptive smooth filter (see Fig. 3). 1-D spectra of these regions (Figs. 4 and 5) were extracted and the corresponding blue and red parts were combined together. The central regions N and N’ of Tol1238-364 were further divided into 1.0′′-wide subregions (n1, n2, n3, n4, n5, n1’, n2’, n3’, n4’, n5’) in order to analyze the circumnuclear region in more detail. Their spectra are shown in Fig. 6. Regions n3 and n3’ are centered on the H emission peaks along the slit. The signal-to-noise ratio (SNR) of the spectra ranges from 5 to 15 in the blue ( 4000 Å) and from 35 to 55 in the red ( 6500 Å) in the central regions of Tol1238-364 (n1, …, n5, n1’, …, n5’, C”). In the outermost regions the SNR in the continuum is significantly lower, although it is still sufficiently good in the prominent emission lines. The regions with the lowest values are the outermost ones at P.A. = 150° and have SNR 2 in the blue, around 4000 Å, 5 around 5000 Å, and 15 in the red. For ESO381-G009 the SNR in the center is 8 in the blue and 40 in the red, while in the outer regions SNR 2 in the blue and 8 in the red.
A correction for Galactic extinction (AV = 0.17 mag, as derived from the AB value given by Burstein & Heiles (1982) following Cardelli, Clayton, & Mathis (1989) and assuming a visual selective extinction RV = 3.1) was applied333The use of the Galactic extinction value derived from the maps of Schlegel, Finkbeiner, & Davis (1998), AV = 0.229 mag, would imply a 5% difference in the measured fluxes..
Before measuring the emission-line fluxes, a template spectrum –conveniently diluted to match the absorption features following the method outlined by Ho, Filippenko, & Sargent (1993)– was used to correct the spectra for the effects of the underlying stellar population, particularly affecting H. The H absorption was detected in all but one of the extracted 1-D spectra of Tol1238-3634 and in the central regions of ESO381-G009.
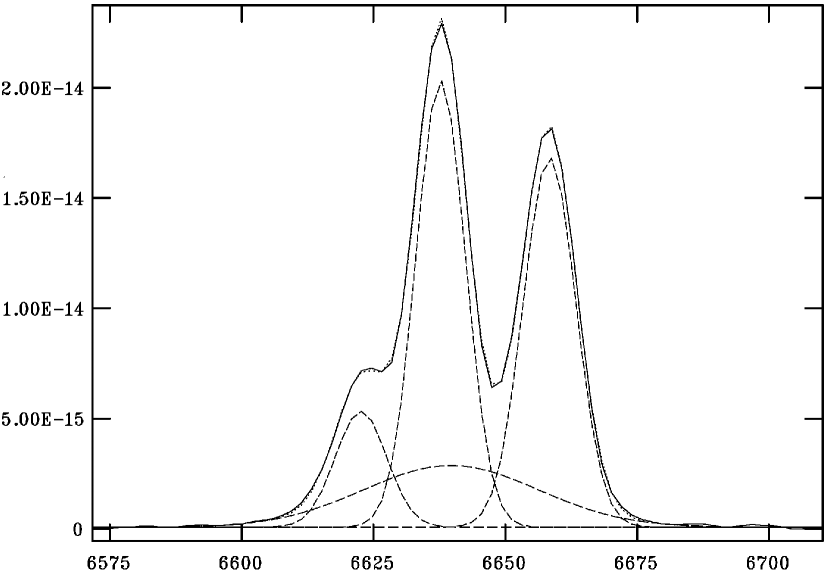
A careful deblending of H and the [NII] satellite-lines was performed using a multi-gaussian fit procedure. In the nuclear region of the Seyfert galaxy a better fit of the blend was obtained assuming the presence of a broad H component (Fig. 7), possibly indicating that this galaxy is a Seyfert of type 1.9. The mean full-width at half-maximum (FWHM) of the broad component found in the nuclear regions at P.A. = 150∘ and 146∘ is 1735 60 km s-1, in agreement with the FWHM 1860 km s-1 found in polarized light by Heisler et al. (1997). The mean FWHM of the narrow line is 300 km s-1.
Measured fluxes of the narrow lines were corrected for internal extinction assuming as intrinsic value of the Balmer decrement H/H=2.85 (Osterbrock, 1989). The Galactic interstellar reddening curve parametrized by Miller & Mathews (1972) has been used. Hereafter we indicate with the term “intensities” these extinction-corrected fluxes. The internal extinction derived in the above way can be considered an upper limit in the case of the nucleus of the Seyfert galaxy, since the intrinsic ratio H/H=3.1 might be more appropriate according to some authors (e.g. Veilleux & Osterbrock, 1987). The observed emission-line fluxes and intensities relative to H, the absolute fluxes of H and H, and the values of internal extinction for the individual regions are listed in the Appendix (Tables A1 through A6). The distances of the extremes of every region to the intensity peak along the slit, expressed in arcseconds, are indicated, as well.
3 MORPHOLOGICAL, PHOTOMETRIC, AND SPECTROSCOPIC PROPERTIES
3.1 Morphology
The morphology of the two galaxies was investigated through the analysis of the broad-band optical images. In order to study the radial trend of the ellipticity ( with and semiaxes of the ellipse) and position angle (P.A.), their isophotes were fitted with ellipses with fixed center. In the outermost isophotes of Tol1238-364 the P.A. had to be fixed as well. The and P.A. versus plots in Fig. 8 reveal in Tol1238-364 the existence of a bar extended until with and P.A. 145°, spiral arms mostly visible in B and extended until , and a clear twist of the isophotes (P.A. 80°), which become nearly circular beyond . Also in ESO381-G009 (Fig. 9) we observe a twist of the isophotes, whose P.A. changes from 120° to 30° and whose ellipticity increases beyond , giving the impression that they are stretching towards Tol1238-364. A strongly elliptical bar () is located at P.A. 125° and seems to extend its isophotes up to , after which we observe a sudden transition to the spiral arms arranged into a ring-like shape.
We repeated the isophote fitting with free ellipses in order to investigate the change in the position of the isophote center. We estimated a decentering degree, as defined by Márquez & Moles (1999), of 7.5% for Tol1238-364 and 3.4% for ESO381-G009. This parameter gives an indication of the degree of asymmetry of the galaxy disks.
A bulge-disk decomposition of the surface brightness profiles of both galaxies in the three passbands was performed without a PSF-deconvolution, assuming an exponential law for the two components (Andredakis, 1998; Andredakis & Sanders, 1994):
| (1) |
| (2) |
where and are the surface intensities of the bulge and disk components (in mag arcsec-2) at a radius , is the surface intensity at the effective radius (i.e. the radius containing half of the bulge light), is the central surface intensity of the disk and is the disk scale-length. The structural parameters averaged on the three passbands, the bulge-to-total light ratios , and the total magnitudes integrated to infinity are listed in Table3. Magnitudes corrected for Galactic extinction are reported as well. The B and V magnitudes measured for Tol1238-364 are in agreement with Hunt et al. (1999). The B/T ratios are typical of disk-dominated galaxies. Let us note that the existence of a real bulge in ESO381-G009 is uncertain. Actually the central part of the galaxy consists of a structure composed by two knots, the brightest of which was chosen as the nucleus, although it is not located in the geometrical center and we lack information about the kinematics of the system. In order to investigate the color gradient , we built a new surface brightness profile by applying the same ellipses fitted to the R-band isophotes. The profile of Tol1238-364 (Fig. 10) shows a red color for the bar, which is probably dominated by an old stellar population, blue spiral arms, and becomes red again in the outermost part of the galaxy, where the disk might be affected by dust extinction. In ESO381-G009, instead, the inner part of the bar exhibits a blue color (Fig. 11), probably as an effect of the presence of central star-forming regions in agreement with the bright knots visible in the H image. The profile reddens in the outer part of the bar and becomes blue again in correspondence of the spiral arms.
The continuum-subtracted H image shows the presence of bright emitting regions distributed all over Tol1238-364, but more concentrated toward its nucleus and in the north-eastern spiral arm facing the companion galaxy (Figs. 1 and 3), and confirms the structures already revealed by the analysis of the broad-band images for ESO381-G009. Additionally, a sort of plume departing from the northern side of ESO381-G009 is visible in all images, as well as an extension of star forming regions (better visible in the H image) on the south, outside the “ring”, especially in direction of the companion galaxy. All the above features are also emphasized as blue regions in the image (Fig. 2).
3.2 Spectroscopic Classification of the Emission-Line Regions
We analyze in this section the spectroscopic characteristics of the two galaxies separately:
Tol1238-364. The trend of the ionization degree along the direction of the slits is shown in Fig. 12, where the emission-line ratios [O III] 5007/H, and [N II] 6583/H are plotted against the radial distance to the nucleus for the regions identified as explained in § 2. All the diagrams show a peak in correspondence of the nucleus as expected in the case of photoionization by a source with a power-law spectrum, and a decreasing ionization degree moving away from it. Nevertheless the outermost regions exhibit an increasing trend of the [O III]/H ratio and an exactly opposite trend of the [N II]/H ratio. This symmetric behavior is typical of H II-like regions, however we stress that this trend is observed in only two bins per slit position. The rise of the ionization degree is more evident at P.A. 90∘ for the regions at the East side of the nucleus and could be partly caused by an underestimate of H, difficult to measure in spectra with relatively low SNR, and partly an effect of the presence of a hot interstellar medium.
In order to investigate the nature of the emission line regions and of their ionizing sources we used the intensities listed in the Appendix (Tables A1 through A6) in order to build the classic diagnostic diagrams (Figs. 13 and 14) [O III] 5007/H vs [O I] 6300/H, [N II] 6583/H, [S II] 6716+6731/H (Veilleux & Osterbrock, 1987, VO diagrams), and [O I] 6300/H, [O I] 6300/[O III] 5007, [N II] 6583/H, [O III] 5007/H vs [O II] 3727/[O III] 5007 (Baldwin, Phillips, & Terlevich, 1981; Shields & Filippenko, 1990; Halpern & Steiner, 1983).
A careful examination of the diagnostic diagrams allowed us to investigate in some detail the nature of the circumnuclear and extranuclear regions (throughout this paper we call “circumnuclear regions” the regions within 1 kpc from the nucleus, assuming H0 = 75 km s-1 Mpc-1). The nuclear and circumnuclear regions n2, n3, n4, n2’, n3’, and n4’ extracted from the central portions of the bidimensional spectra have line-ratios characteristic of Seyfert galaxies, while the adjacent regions n1, n5, n1’, and n5’, as well as region C” at P.A. = 90°, gradually move towards the LINER area of the diagrams, probably indicating a transition from a dominating non-thermal photoionizing source to a dominating thermal source.
Along P.A. = 150∘ a progressive transition from Seyfert-like to H II-like properties is evident when going out from the nucleus. The region A1 on the west side of the nucleus shows typical H II-like features, while B1 on the opposite side has transition properties between LINERs and H II regions. At P.A. = 146∘ the extranuclear regions all fall in the H II-like area of the diagrams, although A2’ approaches the LINER region in the [O I]/H diagram and enters it in the [S II]/H one. A similar behavior is observed in the regions B2” and A3” at P.A. = 90∘; the region B3” has an anomalously high [O III]/H ratio, which locates it at the border between Seyferts and LINERs. However, this could be a consequence of an underestimate444The correction for underlying stellar absorption was particularly difficult for this spectrum, therefore the measured H flux is uncertain. of H and the region is most probably to be classified as LINER type. In contrast with Bransford et al. (1998) we do not observe any marked E/W asymmetry in the distribution of the emission line ratios. The discrepancy among different diagnostic diagrams could be caused by an enhancement of [O I] and [S II] lines consequent to ionization by starburst-driven shocks, as suggested by Bransford et al. (1998). However, some of the anomalous regions are not well centered on any knot of emission in the H image (Fig. 3), and have low density of star formation rate (see last column of Table 4; details on the content of the table are given in §3.4). This could indicate that these regions are weakly ionized by a low number of young stars. Actually, “faint emission” regions are found to have relatively high values of [S II]/H ( 0.3 – 0.5) and [O I]/H ( 0.04 – 0.1) because of their low ionization degree (Smith et al., 1993).
A qualitative examination of the spectra of the individual extranuclear and circumnuclear regions (Figs. 4 and 6) gives further insights into their nature. In particular, we notice that the spectra of the outermost regions tend to be dominated by young (or sometimes very young) stellar populations, as suggested by the weakness of metal absorption lines, the strength of Balmer absorption lines, the high strength of the CaH+H doublet (2.3 Å EW 9.5 Å) relative to the CaK absorption line (0.5 Å EW 5.2 Å), and the blue continuum usually peaked around 4000 Å (e.g. region A2’ in Fig.15). These spectra appear to be dominated by a population of A-type (or F-type) stars. In two of the outermost regions, B3 and B2’, we observe a very blue continuum without detectable metal absorption lines and very weak Balmer absorption lines, indicative of a dominating population of O-B stars. Toward inner radii, the extranuclear regions show a slightly redder continuum, peaked around 4500 Å, progressively deeper metal absorption lines, but still very strong Balmer absorption lines indicating important contributions to the spectrum from both a relatively young and an old (G to K-type) stellar population (e.g. region B1 in Fig.15). The most important contribution from old stellar populations is found in the circumnuclear regions, which exhibit a red continuum, strong metal lines and comparably strong Balmer absorption lines (see e.g. regions n5, n2’ in Fig.15). The CaK (3.5 Å EW 7.7 Å) absorption line becomes stronger than the CaH+H doublet (1.6 Å EW 4.5 Å), as typical of G-type or later stellar populations (e.g. Rose, 1984; Leonardi & Rose, 1996), but not in all the regions within the central kiloparsec. In particular this is not the case for regions n1’, C”, and especially the nucleus n3 (EW(CaK) 3 Å, EW(CaH+H) 5 Å), where an A-type population probably gives a non-negligible contribution to the spectrum, and region n2, where a red continuum is overlapped with a component rising toward blue wavelengths (Fig.15). These last spectra give evidence of the presence of (relatively) recent nuclear and circumnuclear starbursts. The general trend described above, with old population contributions becoming progressively more important with decreasing radius and young populations dominating the outermost regions (at radii of about 3-5 kpc), is in agreement with the stellar population gradients observed by Raimann et al. (2002). However, these authors (their Fig. 3) find that in the nucleus the CaK absorption line has equivalent width significantly larger than CaH+H. This discrepancy with our results could be a consequence of a different spatial sampling and size of the extracted regions. While the spatial scale of their spectra is 0′′.7 pixel-1 and they extracted one-dimensional spectra in windows of 2′′.1 in the nuclear regions, our spatial scale is 0′′.336 pixel-1 and the good seeing conditions allowed us to extract nuclear regions 1′′ in size along the slit. Rebinning our spectra to match the spatial sampling of Raimann et al. and extracting regions of similar size, we verified that a 1-pixel offcenter (i.e. 0′′.7) is sufficient to obtain a spectrum of the nucleus dominated by an old stellar population, and thus reproduce the findings of Raimann et al. (2002). Indeed, the distribution of stellar populations in the circumnuclear regions appears very inhomogeneous with strong variations within a few arcseconds, which makes the analysis very sensitive to the extraction method.
Since in H II regions the equivalent widths of Balmer emission lines are proportional to the ratio of ionizing photons to visible continuum photons from the embedded stars (Kennicutt, Keel, & Blaha, 1989), we can obtain additional information on the population of the H II regions from the observed values of EW(H) listed in Table 4. The H EWs of the extranuclear regions are at (or even below) the lower limit of the distribution found by Kennicutt, Keel, & Blaha (1989) for disk H II regions (defined as the regions located at a distance 1 kpc from the nucleus) of spiral and irregular galaxies. These low emission-line equivalent widths could indicate that the contribution of the young stellar associations to the optical continuum is rather small and might suggest a significant contribution to the continuum by older stellar populations or a prolonged period of star formation over the disk.
ESO381-G009. The ionization-sensitive line ratios at several positions along the slits and the diagnostic diagrams have been plotted for the companion of Tol1238-364 as well (emission line fluxes are given in Tables A6 and A7). As expected, the [O III]/H and [N II]/H (Fig. 16) have symmetric trends typical of H II-like regions, except for the regions A3’, A4’, A5’, which exhibit the same trend in both the line ratios. Actually, also for this galaxy not all the line ratios can be explained by pure photoionization from thermal radiation: the shift of several points toward the LINER area in the [S II]/H diagnostic diagram (Fig. 17) could be caused in some cases by the faintness of the emission regions (A2, B1), but in other cases (A1, A1’, A2’, A3’) they are probably an indication of shock heating as additional ionization mechanism (Dopita & Sutherland, 1995).
The spectra of all the regions show typical properties of young stellar populations with a blue continuum. Metal absorption lines are detectable only in the nucleus (N and N’) together with deep Balmer absorptions. However, the H equivalent width measured in the spectra are rather low (see Table 5), ranging from 15 to 83 Å.
3.3 Photoionization Models
The code CLOUDY 90 (Ferland et al., 1998) has been used to calculate photoionization models, which have been compared to observational emission-line flux ratios, in order to evaluate the physical parameters of extranuclear and circumnuclear regions. CLOUDY is designed to simulate emission-line regions ranging from intergalactic medium to the BLR of quasars. Assuming diluted gas, heated and ionized by the radiation field of a central object, and simultaneously solving the equations of statistical and thermal equilibrium, CLOUDY can predict the physical conditions of the gas and its resulting emission line spectrum.
Simple models can be obtained by specifying as input parameters the continuum emitted by the source, a set of assumed chemical abundances, the total hydrogen density NH, and the ionization parameter U = QH/(4r2NHc), where QH is the number of ionizing photons and r is the distance between the source and the inner side of the gas cloud assumed to have a plane parallel geometry.
We derived a first estimate of the physical parameters and abundances of the ionized gas in the extranuclear regions by comparison with empirical diagrams (McGaugh, 1991; Denicoló et al., 2002). In particular the R23 ratio, defined as [O II] 3727 [O III] 4959,5007/H, was compared with the model grid in the plane [O III]/[O II] R23 in Fig. 10 of McGaugh (1991). From this comparison the ionization parameter was found in the range 3.5 U 3.0. The metal abundances were derived by means of the N2 = [N II] 6584/H calibrator (Denicoló et al., 2002, their Fig. 1) by referring to the model track for U = 3. They were found in the ranges555[12(O/H)]⊙ = 8.9 8.2 12(O/H) 8.6 and 8.2 12(O/H) 8.45 for Tol1238-364 and ESO381-G009, respectively. The choice not to directly calculate the abundances was motivated by the fact that the metallicity is very sensitive to the gas temperature, whose determination requires the measurement of the [O III] 4363 line. Some authors (Raimann et al., 2000) found a ratio [O III] 4363/H 0.02 in H II and starburst galaxies, which implies electronic temperatures lower than 104 K. Unfortunately, the low SNR of our spectra in the blue range prevented the detection of this line at intensity levels lower than 0.1 relative to H in all the extranuclear regions.
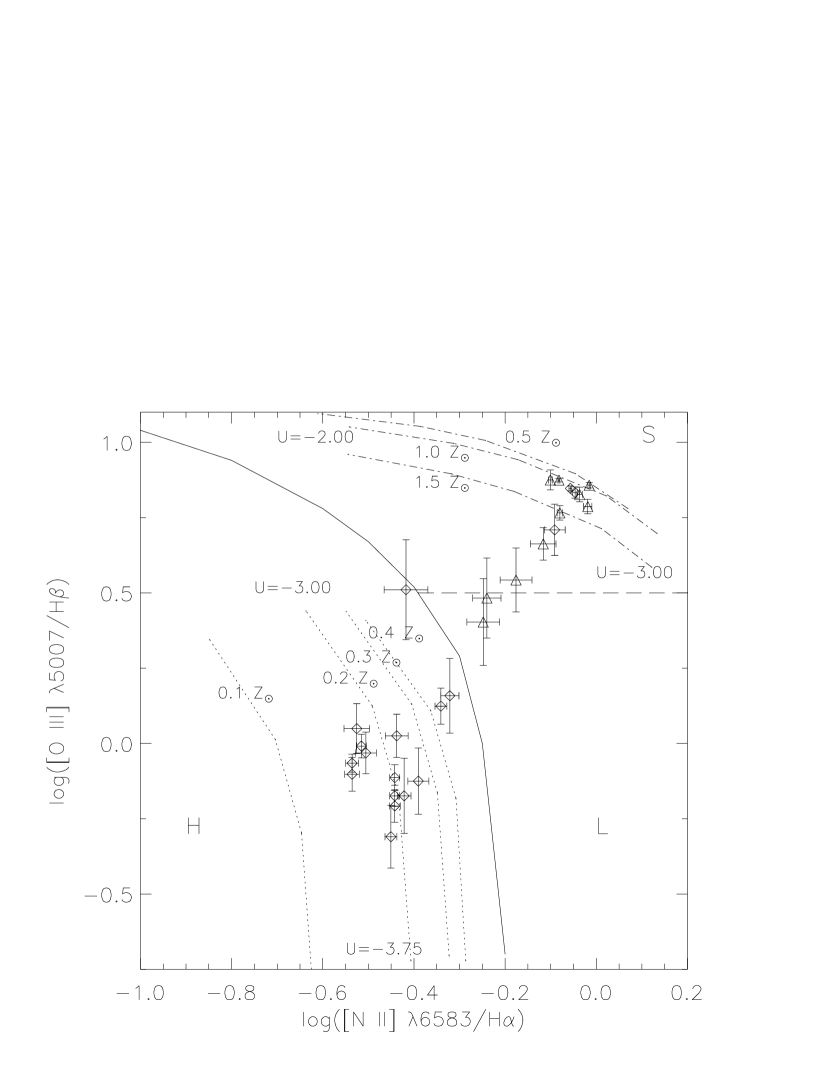
Models were obtained assuming as continuum Mihalas non-LTE stellar atmospheres (Mihalas, 1972) with T = 40000 K and as NH a typical value derived from the [S II]6716/6731 ratios (NH 50 cm-3), while the ionization parameter was left free to vary in the range 4 U 3 with step 0.25 dex, and the metal abundances were varied in the range 0.1Z⊙ Z 0.4Z⊙ with step 0.1. The resulting grid of models (dotted lines) is plotted onto the [N II]/H diagnostic diagram in Fig. 19 overlapped with the observational points. The models that appear to better reproduce the observed line ratios for most of the extranuclear regions of Tol1238-364 are those with 3.50U 3.25 and abundances slightly changing around 0.2Z⊙. The same models seem to be in agreement also with ESO381-G009 flux ratios, but with a larger spread in metallicity between 0.1Z⊙ and 0.2Z⊙ and with higher ionization parameters, distributed around 3.25.
In the case of the circumnuclear regions of Tol1238-364, which are dominated by the non-thermal ionization (§3.2), the models were calculated by assuming as continuum a power law with spectral index = 1.8 (F), NH = 103 cm-3 (as derived from the [S II]6716/6731 ratios), and 3 U 2. Models with different power law index (1.5 and 2.0) have also been attempted but they significantly deviate from the observed values. In these regions the electronic temperature of the gas can be estimate since [O III] 4363 is sufficiently strong to be measured. Nevertheless, the usual formulas (e.g. Pagel et al., 1992; Izotov, Thuan, & Lipovetsky, 1994) for the direct calculation of metal abundances are calibrated with typical H II regions and not with active nuclei, therefore they cannot be applied in this case. Trying to model the N2 calibrator as a function of metallicity and ionization parameter for a power-law ionizing continuum with index 1.5 we have obtained theoretical tracks, which are far below the observed [N II]/H ratios. This is an indication that there is a significant overabundance of nitrogen. Indeed, theoretical tracks obtained assuming a triple nitrogen abundance approach much more the data in the range of the expected ionization parameter for an AGN. For the above reason we constructed a grid of models with metallicities Z = 0.5, 1.0, and 1.5Z⊙ and nitrogen abundances higher by a factor of 3. The models with 2.75 U 2.50 and solar or even supersolar metallicity (Fig. 19, dash-dot lines) reproduce in a reasonable way the nuclear and circumnuclear regions within a radius of 0.5 kpc from the nucleus. The comparison of these models with the observed [S II] emission-line fluxes reveals also a possible overabundance (by a factor of 2) of sulfur in the circumnuclear regions of Tol1238-36.4. Similar cases of nitrogen and sulfur overabundances have been frequently observed in Seyfert 2 galaxies (Storchi-Bergmann & Pastoriza, 1990) and are probably a consequence of circumnuclear starburst activity. However, our observed flux-ratios show also a good agreement with the two-component models by Moy & Rocca-Volmerange (2002), which combine the effects of shocks with AGN photoionization. In particular, the strong [O III] and [O I] 6300 measured in the circumnuclear regions of Tol1238-364 are well reproduced by these models, whereas pure photoionization models predict too low values for these emission lines. Therefore we cannot exclude as alternative explanation to our flux-ratios, the presence of shocks as an additional source of ionization.
Regions n1, n5, n1’, n5’, and C” are not reproduced by any of the above models. As we have already pointed out in § 3.2, these regions are located in a transition area of the diagnostic diagrams. Their properties can be explained with hybrid models involving different proportions of mixed thermal and non-thermal ionization, as explained in Radovich, Hasinger, & Rafanelli (1998).
3.4 Star Formation and Energy Budget
The H line intensity of all emitting regions extracted from the spectra of Tol1238-364 and ESO381-G009 were converted into luminosities (Table 4 and 5) using the distances 47.9 Mpc and 44.3 Mpc, respectively, derived from the mean redshift values measured along the slits for each of the two galaxies. These luminosities were used to calculate the corresponding star formation rates (except for the pure Seyfert-like regions) adopting the relation of Hunter & Gallagher (1986):
| (3) |
The values shown in Tables 4 and 5 for Tol1238-364 and ESO381-G009 range from about 0.001 to 0.15 M⊙ yr-1, but much more significant are the SFR densities, which are 10 to 100 times higher than in normal spirals (Elmegreen, 1998). The mean value of the SFR density derived considering all H II-like regions identified along the slits up to a distance of 28′′ from the nucleus is 1.60 10-7 M⊙ yr-1 pc-2 in Tol1238-364.
The total flux measured on the calibrated H image within a radius of 37′′ is F(H+[N II]) = 3.8310-12 ergs s-1 cm-2. The percentage of [NII] emission detected by the H interference filter has been evaluated taking the average of the [NII]/H ratios measured in the extranuclear spectra ([NII]6548+6583/H = 0.48), although in the central kpc the [NII] lines contribute to the flux in the H image by a higher percentage. Galactic and internal extinction corrections were applied. For the last, the mean extinction value derived from the spectra, E(B-V) = 0.4, was used. No attempt was made to correct for the contribution from the active nucleus. The resulting corrected H luminosity is LHα = 1.441042 ergs s-1, which yields a total SFR = 10.22 M⊙ yr-1 and a SFR density of 4.41 10-8 M⊙ yr-1 pc-2.
In a similar way, mean SFR densities of 1.1 10-7 and 1.62 10-8 M⊙ yr-1 pc-2 were obtained from the spectra and the H image of ESO381-G009. The total luminosity and SFR evaluated from the image within a radius of 41′′ are 5.581041 ergs s-1 and 3.95 M⊙ yr-1, respectively. In this case the average observed ratio [N II]6548+6583/H = 0.33 and the mean internal extinction value E(B-V) = 0.59 were used to correct the flux F(H+[N II]) = 1.010-12 ergs s-1 cm-2 measured in the image. In both cases the SFR densities derived from the spectra are considerably larger than the corresponding value derived from the H images. This apparent discrepancy is a natural consequence of the orientation of the slit, preferentially located along alignments of knotty structures on the galaxies. A comparison with the work of Bushouse (1987) shows that both galaxies have SFR densities approaching the upper value found for a sample of interacting spiral galaxies (6.110-11 SFRD 7.610-8 M⊙ yr-1 pc-2) and clearly higher than values found in a sample of isolated spirals (210-10 SFRD 210-8 M⊙ yr-1 pc-2). Low values of H I depletion time scales, (MHI)/SFR) = 8.5 - 9 yr, are also observed. This is expected in case of interacting systems, according to the distribution shown in Figure 11 of Bushouse (1987).
As already noticed in § 3.1 the H emitting regions of Tol1238-364 appear more concentrated in the spiral arm facing the companion galaxy. Also in ESO381-G009 a concentration of H II regions seem to be present in direction of Tol1238-364 (Fig. 2). In order to better investigate the distribution of the emitting regions in the two galaxies, we measured the H fluxes in 18 circular sectors with aperture 20° and radii 2, 4, and 10 kpc, excluding the nuclei. In each galaxy, the fluxes were normalized to the total galaxy flux (excluding the nucleus). The angular distribution of the normalized fluxes is represented with bar histograms in Fig. 20. Bars with horizontal dashes indicate fluxes within 2 kpc, bars with inclined dashes indicate fluxes between 2 and 4 kpc, and empty bars indicate fluxes at radii 4kpc. The range of angles in which each galaxy faces the companion are marked with horizontal bars. The enhancement of H flux at these positions is evident, especially at the outer radii for ESO381-G009 and both at intermediate and outer radii for the Seyfert galaxy. A second peak in the angular flux distribution of ESO381-G009 is found around P.A. 300° in correspondence of the NW end of its bar.
SFRs in the active galaxy have been calculated for all the extranuclear regions and those circumnuclear regions whose diagnostic emission-line ratios suggest a mixture of thermal and non-thermal ionizing radiation. In the latter case the SFR values quoted in Table 4 are upper limits (marked with a colon), since the fractional contribution of the active nucleus to the H luminosity is unknown.
However, some simple energy budget considerations could be done in order to verify the capability of the Seyfert’s non-thermal source to ionize the regions outside the nucleus. The number of ionizing photons necessary to produce the observed H luminosity,
| (4) |
(Kennicutt, 1998), was evaluated in every region and compared (Table 4) with the number of nuclear ionizing photons which in principle could reach the considered region (Q).
Q is actually a fraction of the total number of ionizing photons produced per second by the central source (Qnuc). In fact it is diluted by the covering factor /4, which depends on the size and distance of each region to the nucleus ( is the solid angle under which the considered region is seen from the nucleus). Obviously a precise measure of this factor cannot be achieved, since we see only the projected sizes and distances of the regions.
The value of Q is given by
| (5) |
Because of the impossibility to estimate the covering factor of the very central region n3, the value of Qnuc has been evaluated in indirect way by selecting among all the circumnuclear regions those exhibiting a clear Seyfert nature and similar line ratios according to the diagnostic diagrams, namely n2, n4, n2’, n3’ and n4’. The Qion of such regions was multiplied by 4/ and the average of the resulting values was assumed to be the actual number of nuclear ionizing photons
| (6) |
included in Table 4 in correspondence of the central subregion n3. This Qnuc was then diluted to obtain Q of every region.
In the region-by-region comparison of Qion and Q there was no need to take into account the filling factor, that is the fraction of the total volume occupied by the gas. This factor is believed to be very low, typically few 0.01 (Durret, 1990), and is generally assumed to affect in the same measure both the Narrow Line Region and the extranuclear regions.
This comparison revealed that QQ for all the regions located at distances R1 kpc from n3 indicating that their ionization is not dominated by the active nucleus. This result is in agreement with the diagnostic diagrams, which show a clear thermal nature of the ionizing source in these regions. Within the central kiloparsec QionQ, except for the region n2. In fact the nuclear ionization is clearly dominating in the regions n4, n2’, n3’ and n4’, which lie inside the Seyfert area of the diagnostic diagrams. Instead it is likely mixed in different percentages to the ionization from thermal sources in the regions n5, n5’ and C”, which lie in the Seyfert area, but slightly displaced toward the Liners, and in the regions n1’ and n1, which occupy the Seyfert-Liner transition region and the Liner area, respectively. According to the diagnostic diagrams (Fig. 13), also the circumnuclear region n2 is dominated by the nuclear non-thermal radiation, however it exhibits an opposite behavior (QQ) with respect to the other circumnuclear regions. In particular its high observed Qion would require a number of nuclear ionizing photons a factor 3.4 higher than the estimated one. One could argue that Qnuc, as determined above, is still underestimated due to dust absorption and that only in direction of n2 the real amount of nuclear ionizing radiation can be estimated. In such a circumstance we would expect to observe a similarly high Qion also in the immediately adjacent n1 region. Since this is not the case, we rule out this hypothesis and confirm instead the presence of a circumnuclear starburst inside n2 as already suggested in § 3.2 on the basis of the analysis of its spectral properties. This idea is also supported by the estimated value of internal extinction in n2, AV 3.3 mag, much higher than in the surrounding zones.
The number of ionizing photons produced in every region was calculated also for ESO381-G009 (Table 5), and expressed in equivalent number of O5 stars, N(O5), assuming that each O5 star emits 5 1049 ionizing photons s-1 (Osterbrock, 1989). The obtained values range from the upper limit for normal H II regions ionized by clusters or associations of OB stars to values found for “giant” and “supergiant” H II regions (Kennicutt, Edgar, & Hodge, 1989). The starbursts with the highest values of SFR are located in the nucleus of the galaxy.
4 FIR EMISSION
The connection between the enhanced far-infrared emission and galaxy interactions has been established in many works (e.g. Telesco, Wolstencroft, & Done, 1988; Borne et al., 2000). In order to study the infrared activity of each member of the pair, position and flux calibrated raw IRAS data were extracted from the IRAS database server of the Space Research Organisation of the Netherlands (SRON). The program GIPSY (Groningen Image Processing System, Assendorp et al. 1995), was used to create low resolution co-added maps at 12, 25, 60 and 100 centered on Tol1238-364.
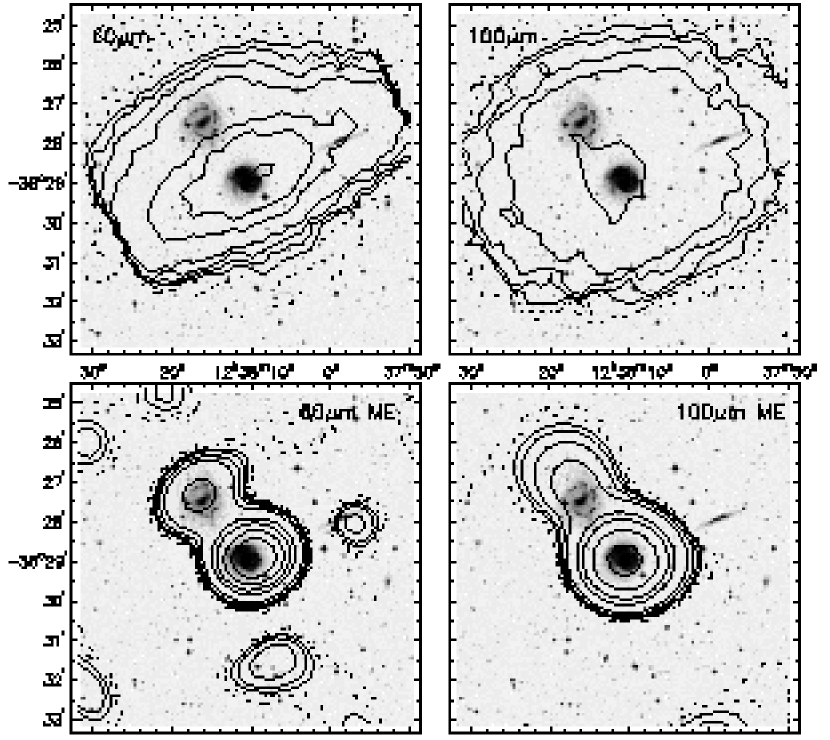
The overlap of these maps on the corresponding Digitized Sky Survey optical image allowed to show the fainter emission of ESO381-G009 at 12 and 25 , compared with the active galaxy. At 60 and 100 both galaxies seemed to be embedded in the same emission, because of the larger size of the detectors at those wavelengths (Assendorp et al., 1995). To remove the “confusion” and evaluate the contributions of the two objects, a higher resolution (by a factor of 5) was achieved (Fig. 21) by applying the program HIRAS, which drives the MEMSYS5 maximum entropy imaging algorithm (Bontekoe, Koper, & Kester, 1994).
The result showed ESO381-G009 as an emitting source clearly separated from Tol1238-364 in all the four bands. The sum of the flux densities of the two galaxies, measured by means of the GIPSY task FLUX (Table 6), was compared with previously published values, for which only a unique emitting source was considered. In particular our results are in good agreement both with the Point Source Catalog, apart from a slightly higher emission at 100 in our measurement, and with the values of Rush, Malkan, & Spinoglio (1993) obtained using the ADDSCAN procedure of the Infrared Processing and Analysis Center (IPAC).
Our flux ratios were compared with the infrared color-color diagrams log(F25/F12) log(F60/F25) and log(F100/F25) log(F60/F12), which can indicate whether the FIR emission is dominated by a dust-extinguished active nucleus, a pure starburst or a mixture of these two components (Dopita et al., 1998). We found that the FIR emission of Tol1238-364 is dominated by a moderately obscured AGN, while ESO381-G009 has an expected “warm” starburst nature (Fig. 22). Further confirmations came from the analysis of the spectral indices and , and mostly of the 60 curvature (), whose values 0.425 and 1.545 are typical of a Seyfert 2 and an H II galaxy respectively (Miley, Neugebauer, & Soifer, 1985).
The total fluxes between 42.5 and 122.5 have been calculated following Helou et al. (1985):
| (7) |
and converted into luminosities, using the distances given in § 3.4. The resulting values (Table 6) indicate that Tol1238-364 is 10 times brighter than ESO381-G009, a clear effect of the presence of an active nucleus. In fact the dusty torus is expected to contribute notably to the far-IR luminosity (Storchi-Bergmann, Mulchaey, & Wilson, 1992; Genzel et al., 1998; Lutz et al., 1998), which is generally produced by interstellar dust heated by the UV radiation field of young and hot stars. Considering a single temperature component and a emissivity law (Young et al., 1989), a major content of warm dust was revealed in Tol1238-364 (Table 6), likely concentrated into the bar and in correspondence of the giant H II regions populating its spiral arms. However, the star formation rate, derived from the FIR luminosities following the relation given by Hunter et al. (1986), is high in both galaxies as expected to occur in an interacting system. The overall SFR estimated from LFIR (SFR 15.9 M⊙ yr-1) appears somewhat higher than that estimated from LHα (SFR 10.2 M⊙ yr-1). In fact, the far infrared luminosity generally includes the contribution of the cirrus component, diffuse dust heated by the starlight radiation field, whose effect is to give an overestimate of the star formation rate, up to a factor 2 (Elmegreen, 1998). Furthermore, in the case of the Seyfert galaxy the dust heated by the nuclear non-thermal radiation contributes to the total FIR emission in a percentage which cannot be determined. On the opposite, for ESO381-G009, SFR is a factor 2 lower than SFR. A possible reason could be the error related to the “deblending” of the two IRAS sources.
5 DISCUSSION AND CONCLUSIONS
We have analyzed the physical properties of the galaxy pair Tol1238-364 and ESO381-G009, which belongs to a triple system together with ESO381-G006, on the basis of optical imaging and long-slit spectroscopy in order to point out possible effects of interaction.
The triple system was analyzed by Barnes & Webster (2001) as well, who suggested that also a fourth galaxy, ESO381-G014, might belong to this small galaxy group, because of its detection in radio observations at a radial velocity of 3304 km s-1. For the supposed four-members group they reported a median radial velocity of 3285 km s-1, a median projected velocity dispersion of 11 km s-1, a median projected galaxy-galaxy separation of 110 kpc, and a median crossing time of order 10 Gyr. Since they did not detect strong signs of galaxy interactions, like a common envelope of neutral gas or prominent tidal tails, they speculated that the triple system might be much looser than the projected density implies. ESO381-G014 has been indicated as a member of the group also in the catalog of groups of nearby optical galaxies (NOGG)666In the NOGG catalog, which contains only galaxies brighter than B = 14 mag, the group is erroneously indicated as a quartet, because the galaxy ESO381-G009 is counted twice, with the alternative names PGC 042519 and PGC 097487. compiled by Giuricin et al. (2000). However, its projected separation from the triplet (we assume as average coordinates of the triplet (J2000) = 12h40m50s.7, (J2000) = 36°44′32′′) is 42′, corresponding to 0.5 Mpc, assuming H0 = 75 km s-1 Mpc-1), i.e. 33 times the diameter of Tol1238-364 as estimated at the 25 mag arcsec-2 B isophote. Instead, the centers of the galaxies in the triplet are all encompassed by a minimum circle of radius 1′.87 (25 kpc) and have a median projected separation of 2′.63 (i.e. 35 kpc). While we have no pieces of evidence other than the concordant radial velocity to support either exclude the membership of ESO381-G014 to the group, we consider it unlikely for this galaxy to have a strong gravitational influence on the members of the triplet.
The radial velocity of the galaxies pose them at the same distance of the Centaurus cluster (Abell 3526, (J2000.0) = 12h48m48s.7, (J2000.0) = -41°18′44′′). However, they are at a projected distance of 3.5 Mpc from the cluster center and well separated from the main cluster galaxy concentration, therefore it is unclear whether they can be considered cluster members. In any case, at such a separation the influence of the Centaurus cluster on the triplet, if any, is most likely negligible with respect to the mutual influence of the galaxies within the triplet itself, provided this is really a tight system. We have actually observed properties in Tol1238-364 and ESO381-G009 (the tightest pair within the triple system, at least in projection on the sky) that are consistent with an interaction scenario, as we discuss in the following.
Both galaxies show a prominent bar, and ESO381-G009 also a ring of H II regions. Theoretical N-body simulations show that close encounters between galaxies can lead to bar formation (e.g. Noguchi, 1987; Gerin, Combes, & Athanassoula, 1990), although bars can form in isolated galaxies, as well, as a consequence of disk instabilities. Indeed, studies of the relative frequency of bars among various Hubble types and in different environments have demonstrated that galaxies in close binary systems and some groups have a greater occurrence of bars than field galaxies (Elmegreen, Elmegreen, & Bellin, 1990). This result is somewhat controversial, in fact it was recently found (van den Bergh, 2002) that the bar frequency does not appear to depend on the galaxy environment. Nevertheless, we think that the presence of a bar in at least two out of three members of a galaxy system, like in our case (since ESO381-G006 is edge-on we cannot establish whether it is barred or not), strongly favors the hypothesis that the mutual interaction has played a role in the bar formation. Further support to this hypothesis is given by the detection of star formation along the bars, which indicate that the bars are still relatively young and actively funneling gas toward the center of the galaxies.
The two galaxies show evidences of only slight morphological distortions (see §3.1). Specifically, we observe a twist of the inner isophotes, most likely caused by the bars, and an elongation and change of the P.A. of the outermost isophotes of both galaxies toward one another. Additionally, the decentering degree of the most external isophotes with respect to the luminosity center of Tol1238-364 is higher than the maximum value (5%) found by Márquez & Moles (1999) for isolated galaxies, indicating a significant asymmetry of the outskirts of the disk likely caused by interaction processes. On the contrary, ESO381-G009 does not exhibit such an asymmetry of the outermost isophotes, but its H image shows an extension of H II regions, also detectable in the broad band images, on the southern side of the disk, outside the ring-like structure, facing the Seyfert galaxy. Additionally, the optical images show a plume on its northern side. This plume appears more extended in the contour maps of the H I 21 cm line (Babic, Price, & Jones, 2000; Barnes & Webster, 2001). No other tidal features are visible in the optical images, but there are signs of an H I bridge between Tol1238-364 and ESO381-G006 (Babic, Price, & Jones, 2000). However, since the detection of this bridge is limited to one velocity channel, the possibility that this is a spurious feature cannot be excluded. Most of the neutral hydrogen remains located in the discs of the galaxies.
We note that the formation of prominent tidal tails is not ubiquitous in interacting galaxies, but depends on the geometry of the encounters, being particularly favored in prograde interactions, as shown by numerical simulations (see, e.g., the seminal work of Toomre & Toomre, 1972). In a recent work, Barton Gillespie, Geller, & Kenyon (2003) identified within a sample of close galaxy pairs a number of galaxies exhibiting triggered star formation but not long tidal tails. The color profiles of these galaxies show blue dips in their centers, in analogy with the profile we obtained for the non-active galaxy ESO381-G009.
In fact, we could not identify a real bulge structure in this galaxy, but two knots with high SFR, the brightest of which we adopted as nucleus. This kind of structure appears in agreement with the gas infall and centrally concentrated star formation predicted by the numerical simulations of Mihos & Hernquist (1996) for bulgeless galaxies in the early stages of interactions.
Tol1238-364 hosts a typical Seyfert 2 nucleus, with a hidden BLR. The non-thermal ionization produced by the central power-law source is confined within the first kiloparsec and no evidence of ionization cones is found along the three studied directions. Considerations on the energy budget (§ 3.4) reveal the presence of at least one circumnuclear starburst, a hypothesis that finds support in the observed spectral features. Besides the central starbursts, a large number of H II regions are found in both galaxies with a major concentration in the zone of their minimal mutual distance, further supporting the interaction scenario. In ESO381-G009 the H II regions are mainly located along the bar and in the ring, while in Tol1238-364 they are diffused all over the disk. The SFR and the density of SFR are strongly enhanced with respect to normal and/or isolated spirals, and higher in Tol1238-364 than in its companion (see § 3.4). This enhancement could be a combined effect of the mutual interactions of the galaxies, as shown by the comparison between the star formation properties of interacting and isolated galaxies (see e.g. Bushouse, 1987; Kennicutt et al., 1987; Keel & Van Soest, 1992), and of the perturbation of the whole galactic disk by the stellar bar (Aguerri, 1999), although the relation between the global star formation and the presence of a bar in a galaxy is still debated. Also, numerical simulations demonstrated that both galaxy interactions (e.g. Barnes & Hernquist, 1991, 1996; Mihos & Hernquist, 1996) and bars or, in general, non-axisymmetric features (as summarized e.g. in Combes, 2001) can produce torques and gas radial inflows toward the center, inducing nuclear starbursts and/or fueling a central AGN.
The H II regions of both galaxies,whose excitation is in general the effect of photoionization from hot, young stars although in some cases the contribution of starburst driven shocks cannot be excluded, exhibit subsolar metallicities. However, the Seyfert nucleus shows higher (solar or even supersolar) metallicity, with traces of overabundance of nitrogen and sulphur, which could be related to the presence of circumnuclear starburst.
The IRAS infrared colors confirmed the dual starburst - AGN nature of Tol1238-364 and the simple starburst nature of ESO381-G009, but the infrared emission of the Seyfert appears dominated by the active nucleus and shows higher FIR luminosity and dust content.
Based on the result of their analysis, Barton Gillespie et al. (2003) suggested that blue central colors, moderate EW(H), and small velocity separations in galaxy pairs, are indicative of galaxies that have undergone a close pass and than moved apart, while their triggered burst of star formation ages. Accordingly, numerical simulations by Mihos & Hernquist (1994), showed that two interacting disk/halo galaxies remain relatively unperturbed and show no increase of star forming activity until they reach the perigalacticon. Furthermore, an enhanced star formation activity is also induced in the disks of the galaxies before they reach the widest separation after their first encounter. The observational properties we have outlined in the present work suggest that this stage of the evolution, i.e. the phase subsequent to a first close passage, might be the case for the galaxy pair under study. The lack of really prominent morphological distortions might indicate that the galaxy separation is actually larger than appearing in projection on the sky.
In conclusion, although some of the observed properties, taken individually, can be found also in isolated galaxies, when considered all together they provide, in our opinion, a significant indication of an undergoing interaction between two gas-rich galaxies. From our data we cannot establish which role is played by ESO381-G006 in the interaction. On the basis of a comparison with the findings in other interacting pairs (e.g. Barton Gillespie et al., 2003) and the results of galaxy encounter simulations (Mihos & Hernquist, 1994, 1996), we suggest that the galaxy pair has already undergone a first close passage, which determined the onset of bursts of star formation both in the disks and in the central regions, caused moderate morphological distortions, and, possibly, disk instabilities leading to bar formation. Nevertheless, a clear connection of the Seyfert activity with the interaction cannot be demonstrated and remains at a speculative level.
Appendix A Measured Emission Line Fluxes of Tol1238-364 and ESO381-G009
References
- Aguerri (1999) Aguerri, J. A. L. 1999, A&A, 351, 43
- Andredakis (1998) Andredakis, Y. C. 1998, MNRAS, 295, 725
- Andredakis & Sanders (1994) Andredakis, Y. C. & Sanders, R. H. 1994, MNRAS, 267, 283
- Assendorp et al. (1995) Assendorp, R., Bontekoe, Tj. R., de Jonge, A. R. W., Kester, D. J. M., Roelfsema, P. R. & Vesselius, P. R. 1995, A&AS, 110, 395
- Babic, Price, & Jones (2000) Babic, B., Price, R. M. & Jones, K. 2000, in ASP Conf. Ser. 209, Small Galaxy Groups, ed. M. J. Valtonen & C. Flynn (San Francisco: ASP), 132
- Baldwin, Phillips, & Terlevich (1981) Baldwin, J. A., Phillips, M. M., Terlevich, R. J. 1981, PASP, 93, 5
- Barnes & Hernquist (1991) Barnes, J. E. & Hernquist, L. E. 1991, ApJ, 370, L65
- Barnes & Hernquist (1996) Barnes, J. & Hernquist, L. 1996, ApJ, 471, 115
- Barnes & Webster (2001) Barnes, D. G. & Webster, R. L. 2001, MNRAS, 324, 859
- Barton Gillespie et al. (2003) Barton Gillespie, E., Geller, M. J., & Kenyon, S. J. 2003, ApJ, 582, 668
- Bransford et al. (1998) Bransford, M. A., Appleton P. N., Heisler C. A., Norris, R. P., Marston, A. P. 1998, ApJ, 497, 133
- Bontekoe, Koper, & Kester (1994) Bontekoe,Tj. R., Koper, E., & Kester, D. J. M. 1994, A&A, 284, 1037
- Borne et al. (2000) Borne K. D., Bushouse, H., Lucas, R. A. & Colina, L. 2000, ApJ, 529, L77
- Burstein & Heiles (1982) Burstein D. & Heiles C. 1982 AJ, 87, 1165
- Bushouse (1987) Bushouse, H. A. 1987, ApJ, 320, 49
- Cardelli, Clayton, & Mathis (1989) Cardelli, J. A., Clayton, G. C., & Mathis, J. S. 1989, ApJ, 345, 245
- Combes (2001) Combes, F. 2001, Advanced Lectures on the Starburst-AGN Connection, Singapore: World Scientific, p. 223
- Denicoló et al. (2002) Denicoló, G., Terlevich, R., & Terlevich, E. 2002, MNRAS, 330, 69
- Dopita et al. (1998) Dopita, M. A., Heisler, C., Lumsden, S., Bailey, J. 1998, ApJ, 498, 570
- Dopita & Sutherland (1995) Dopita, M. A. & Sutherland, R. S. 1995, ApJ, 455, 468
- Durret (1990) Durret, F. 1990, A&A, 229, 351
- Elmegreen (1998) Elmegreen, D. M. 1998, Galaxies and Galactic Structure, Prentice-Hall Inc., Upper Saddle River, NJ 07458
- Elmegreen, Elmegreen, & Bellin (1990) Elmegreen, D. M., Elmegreen, B. G., & Bellin, A. D. 1990, ApJ, 364, 415
- Ferland et al. (1998) Ferland, G. J., Korista, K. T., Verner, D. A., Ferguson, J. W., Kingdon, J. B. & Verner, E. M. 1998, PASP, 110, 761
- Genzel et al. (1998) Genzel, R., Lutz, D., Sturm, E., Egami, E., Kunze, D., Moorwood, A. F. M., Rigopoulou, D., Spoon, H. W. W., Sternberg, A., Tacconi-Garman, L. E., Tacconi, L., Thatte, N. 1998, ApJ, 498, 579
- Gerin, Combes, & Athanassoula (1990) Gerin, M., Combes, F., & Athanassoula, E., A&A, 230, 37
- Giuricin et al. (2000) Giuricin, G., Marinoni, C., Ceriani, L., & Pisani, A. 2000, ApJ, 543, 178
- González Delgado & Heckman (1999) González Delgado, R. & Heckman, T. 1999, Ap&SS, 266, 187
- González Delgado et al. (1998) González Delgado, R. M., Heckman, T., Leitherer, C., Meurer, G., Krolik, J., Wilson, A. S., Kinney, A., Koratkar, A. , 1998, ApJ, 505, 174
- Halpern & Steiner (1983) Halpern, J. P. & Steiner, J. E. 1983, ApJ, 269, L37
- Heisler, Lumsden, & Bailey (1997) Heisler, C. A., Lumsden, S. L., & Bailey J. A. 1997, Nature, 385, 700
- Helou, Soifer, & Rowan-Robinson (1985) Helou, G., Soifer, B. T. & Rowan-Robinson, M. 1985, ApJ, 298, L7
- Ho, Filippenko, & Sargent (1993) Ho, L. C., Filippenko, A. V. & Sargent, W. L. W. 1993, ApJ, 417, 63
- Hunt et al. (1999) Hunt, L. K., Malkan, M. A., Rush, B., Bicay, M. D., Nelson, B. O., Stanga, R. M., & Webb, W. 1999, ApJS, 125, 349
- Hunter & Gallagher (1986) Hunter, D. A. & Gallagher, J. S. III 1986, PASP, 98, 5
- Hunter et al. (1986) Hunter, D. A., Gillet, F. C., Gallagher, J. S., Rice, W. L., Low, F. J. 1986, ApJ, 303, 171
- Izotov, Thuan, & Lipovetsky (1994) Izotov, Y. I., Thuan, T. X. & Lipovetsky, V. A. 1994, ApJ, 435, 647
- Karachentseva & Karachentsev (2000) Karachentseva, V. E. & Karachentsev, I. D., 2000, Astronomy Reports, 44, 501
- Keel & Van Soest (1992) Keel, W. C. & Van Soest, E. T. M. 1992, A&AS, 94, 553
- Kennicutt (1998) Kennicutt, R. C. Jr. 1998, ARA&A, 36, 189
- Kennicutt, Edgar, & Hodge (1989) Kennicutt, R. C. Jr., Edgar, B. K. & Hodge, P. W. 1989, ApJ, 337, 761
- Kennicutt, Keel, & Blaha (1989) Kennicutt, R. C. Jr., Keel, W. C., & Blaha, C. A., AJ, 97, 1022
- Kennicutt et al. (1987) Kennicutt, R. C. Jr., Roettiger, K. A., Keel, W. C., van der Hulst, J. M., & Hummel, E. 1987, AJ, 93, 1011
- Levenson, Weaver, & Heckman (2001) Levenson, N. A., Weaver, K. A., & Heckman, T. M. 2001, ApJS, 133, 269
- Leonardi & Rose (1996) Leonardi, A. J. & Rose, J. A. 1996, AJ, 111, 182
- Lorenz et al. (1993) Lorenz, H., Richter, G. M., Capaccioli. M., Longo, G. 1993, A&A, 277, 321
- Lutz (1992) Lutz, D. 1992, A&A, 259, 462
- Lutz et al. (1998) Lutz, D., Spoon, H. W. W., Rigopoulou, D., Moorwood, A. F. M. & Genzel, R. 1998, ApJ, 505, L103
- Márquez & Moles (1999) Márquez, I. & Moles, M. 1999, A&A, 344, 421
- McGaugh (1991) McGaugh, S. S. 1991, ApJ, 380, 140
- Mihalas (1972) Mihalas, D. 1972, Non-LTE Model Atmospheres for B and O stars (Boulder: NCAR) (NCAR-TN/STR-76)
- Mihos (1999) Mihos, C. 1999, Ap&SS, 266, 195
- Mihos & Hernquist (1994) Mihos, C. & Hernquist, L. 1994, ApJ, 431, L9
- Mihos & Hernquist (1996) Mihos, C. & Hernquist, L. 1996, ApJ, 464, 641
- Miley, Neugebauer, & Soifer (1985) Miley, G. K., Neugebauer, G., & Soifer, B. T. 1985, ApJ, 293, L11
- Miller & Mathews (1972) Miller, J. S. & Mathews, W. G. 1972, ApJ, 172, 593
- Moy & Rocca-Volmerange (2002) Moy, E. & Rocca-Volmerange, B. 2002, A&A, 383, 46
- Mulchaey, Regan, & Kundu (1997) Mulchaey, J. S., Regan, M. W., & Kundu, A. 1997, ApJS, 110, 299
- Noguchi (1987) Noguchi, M. 1987, MNRAS, 228, 635
- Osterbrock (1989) Osterbrock, D. E. 1989, Astrophysics of Gaseous Nebulae and Active Galactic Nuclei (Mill Valley, CA: Univ. Science Books)
- Pagel et al. (1992) Pagel, B. E. J., Simonson, E. A., Terlevich, R. J. & Edmunds, M. G. 1992, MNRAS, 255, 325
- Radovich, Hasinger, & Rafanelli (1998) Radovich, M., Hasinger, G., & Rafanelli, P. 1998, Astron. Nachr., 319, 325
- Rafanelli, Violato, & Baruffolo (1995) Rafanelli, P., Violato, M. & Baruffolo, A. 1995, AJ, 109, 1546
- Rafanelli, Temporin, & Baruffolo (1997) Rafanelli, P., Temporin, S. & Baruffolo, A. 1997, Astron. Nachr., 318, 249
- Raimann et al. (2000) Raimann, D., Storchi-Bergmann, T., Bica, E., Melnick, J., & Schmitt, H. 2000 MNRAS, 316, 559
- Raimann et al. (2002) Raimann, D., Storchi-Bergmann, T., González Delgado, R. M., Cid Fernandes, R., Heckman, T., Leitherer, C., and Schmitt, H. 2002, MNRAS, submitted (preprint astro-ph/0210635)
- Richter et al. (1991) Richter, G. M., Lorenz, H., Böhm, P., Priebe, A., & Capaccioli, M. 1991, Astron. Nachr., 312, 345
- Rifatto et al. (2001) Rifatto, A., Rafanelli, P., Ciroi, S., Radovich, M., Vennik, J., Richter, G. M., and Birkle, K. 2001, AJ, 122, 2301
- Risaliti, Maiolino, & Salvati (1999) Risaliti, G., Maiolino, R., & Salvati, M. 1999, ApJ, 522, 157
- Rose (1984) Rose, J. A. 1984, AJ, 89, 1238
- Rush, Malkan, & Spinoglio (1993) Rush, B., Malkan, M. A., & Spinoglio, L. 1993, ApJS, 89, 1
- Schlegel, Finkbeiner, & Davis (1998) Schlegel, D. J., Finkbeiner, D. P., Davis, M. 1998, ApJ, 500, 525
- Shields & Filippenko (1990) Shields, J. C. & Filippenko, A. V. 1990, AJ, 100, 1034
- Smith et al. (1993) Smith, R. C., Kirshner, R. P., Blair, W. P., Long, K. S., & Winkler, P. F. 1993, ApJ, 407, 564
- Storchi-Bergmann, Mulchaey, & Wilson (1992) Storchi-Bergmann, T., Mulchaey, J. S., & Wilson, A. S. 1992, ApJ, 395, 73
- Storchi-Bergmann & Pastoriza (1990) Storchi-Bergmann, T. & Pastoriza, M. G., 1990, PASP, 102, 1359
- Telesco, Wolstencroft, & Done (1988) Telesco, C. M., Wolstencroft, R. D., & Done, C. 1988, ApJ, 329, 174
- Toomre & Toomre (1972) Toomre A. & Toomre J. 1972, ApJ, 178, 623
- van den Bergh (2002) van den Bergh, S. 2002, AJ, 124, 782
- Veilleux & Osterbrock (1987) Veilleux, S. & Osterbrock, D. E. 1987, ApJS, 63, 295
- Young et al. (1989) Young, J. S., Xie, S., Kenney, J. D. P. & Rice, W. L. 1989, ApJS, 70, 699


.


| Object | (J2000.0) | (J2000.0) | Radial VelocityaaObtained from the H I 21 cm line Barnes & Webster (2001). | MBbbConverted from apparent magnitudes given in the NASA Extragalactic Database. |
|---|---|---|---|---|
| ( h m s) | ( ) | (km s-1) | (mag) | |
| Tol1238-364 | 12 40 52.9 | 36 45 22 | 3282 | 20.2 |
| ESO 381-G009 | 12 40 58.4 | 36 43 55 | 3288 | 19.3 |
| ESO 381-G006 | 12 40 40.8 | 36 44 20 | 3101 | 17.2 |
Note. — Units of right ascension are hours, minutes, and seconds, and units of declination are degrees, arcminutes, and arcseconds.
| Object | Date | U.T. | Exp. Time | P.A. | Spectral Range | Filter | aaLimit surface brightnesses are evaluated at a 3 level above the background, and the limit magnitudes are evaluated assuming a 3 signal within the PSF radius corresponding to 80% of the total flux. | mlimbbFor the H image we give the brightness and flux limit in units of ergs cm-2 s-1. |
|---|---|---|---|---|---|---|---|---|
| (hh:mm) | (sec) | (Å) | (mag arcsec-2) | (mag) | ||||
| Spectroscopy | ||||||||
| Tol1238-364 | 1995 Apr. 1 | 09:23 | 900 | 150∘ | 3850 - 7950 | |||
| ” | 1995 Apr. 1 | 09:47 | 1200 | ” | 3200 - 6030 | |||
| ” | 1995 Apr. 3 | 05:55 | 900 | 90∘ | 3850 - 7950 | |||
| ” | 1995 Apr. 3 | 06:47 | 900 | ” | 3200 - 6030 | |||
| ” | 1995 Apr. 4 | 06:28 | 1800 | 146∘ | 3850 - 7950 | |||
| ” | 1995 Apr. 4 | 07:04 | 2400 | ” | 3200 - 6030 | |||
| ESO381-G009 | 1995 Apr. 3 | 06:23 | 900 | 90∘ | 3850 - 7950 | |||
| ” | 1995 Apr. 3 | 07:59 | 900 | 125∘ | 3850 - 7950 | |||
| ” | 1995 Apr. 3 | 08:16 | 900 | ” | 3200 - 6030 | |||
| Imaging | ||||||||
| 1995 Apr. 1 | 07:49 | 600 | B | 23.79 | 22.79 | |||
| 1995 Apr. 1 | 08:02 | 300 | V | 23.96 | 23.13 | |||
| 1995 Apr. 1 | 08:10 | 300 | R | 24.11 | 23.12 | |||
| 1995 Apr. 1 | 07:05 | 900 | HbbFor the H image we give the brightness and flux limit in units of ergs cm-2 s-1. | 3.5610-16 | 8.4710-16 | |||
| 1995 Apr. 1 | 07:23 | 900 | H-cont. | |||||
| Object | B | V | R | |||
|---|---|---|---|---|---|---|
| (mag) | (mag) | (mag) | (arcsec) | (arcsec) | ||
| Tol1238-364 | 12.92 | 12.45 | 11.98 | 2.2 | 7.5 | 0.2 |
| 12.69 | 12.28 | 11.84 | ||||
| ESO381-G009 | 13.71 | 13.22 | 12.74 | 3.0 | 12.5 | 0.12 |
| 13.48 | 13.05 | 12.60 |
Note. — For each galaxy, observed magnitudes are listed on the first row and magnitudes corrected for Galactic extinction on the second row. Extinction values in V and R were derived from AB Burstein & Heiles (1982) following Cardelli, Clayton, & Mathis (1989) and assuming a visual selective extinction RV = 3.1.
| Id. | RaaDistance in kpc to the center of the galaxy. Negative distances indicate regions West or North-West of the nucleus. | L(H) | Qion | Q | EW(H) | SFR | SFR/pc2 |
|---|---|---|---|---|---|---|---|
| (kpc) | (1040 erg s-1) | (phot. s-1) | (phot. s-1) | (Å) | (M⊙ yr-1) | (M⊙ yr-1 pc-2) | |
| P.A. = 150∘ | |||||||
| A2 | 3.90 | 1.57 | 1.15E+52 | 2.20E+51 | 94.93 | 0.111 | 7.47E8 |
| A1 | 1.60 | 2.31 | 1.69E+52 | 5.74E+51 | 31.31 | 0.164 | 2.50E7 |
| n1 | 0.70 | 0.68 | 4.98E+51 | 8.28E+51 | 9.39 | 0.048: | 2.65E7: |
| n2 | 0.30 | 21.21 | 1.55E+53 | 4.53E+52 | 53.96 | ||
| n3 | 0.0 | 19.45 | 1.42E+53 | 2.82E+53 | 106.62 | ||
| n4 | 0.26 | 0.89 | 6.49E+51 | 3.61E+52 | 50.57 | ||
| n5 | 0.51 | 0.22 | 1.59E+51 | 1.22E+52 | 12.77 | 0.015: | 1.06E7: |
| B1 | 0.93 | 1.39 | 1.01E+52 | 6.59E+51 | 16.70 | 0.098 | 3.86E7 |
| B2 | 1.83 | 1.45 | 1.06E+52 | 3.91E+51 | 46.95 | 0.103 | 1.77E7 |
| B3 | 3.43 | 1.14 | 8.32E+51 | 1.75E+51 | 87.16 | 0.081 | 8.87E8 |
| P.A. = 146∘ | |||||||
| A2’ | 3.71 | 0.92 | 6.73E+51 | 2.48E+51 | 36.28 | 0.065 | 4.27E8 |
| A1’ | 1.53 | 1.35 | 9.85E+51 | 4.84E+51 | 43.68 | 0.095 | 1.88E7 |
| n1’ | 0.81 | 0.97 | 7.06E+51 | 7.40E+51 | 9.42 | 0.068: | 3.13E7: |
| n2’ | 0.39 | 2.43 | 1.77E+52 | 2.68E+52 | 25.38 | ||
| n3’ | 0.26 | 2.69 | 1.96E+52 | 3.61E+52 | 49.09 | ||
| n4’ | 0.37 | 0.64 | 4.69E+51 | 2.36E+52 | 17.83 | ||
| n5’ | 0.67 | 0.77 | 5.61E+51 | 9.04E+51 | 9.86 | 0.054: | 2.99E7: |
| B1’ | 1.74 | 2.05 | 1.50E+52 | 6.19E+51 | 35.73 | 0.145 | 1.73E7 |
| B2’ | 4.13 | 0.86 | 6.27E+51 | 1.86E+51 | 98.28 | 0.061 | 4.29E8 |
| P.A. = 90∘ | |||||||
| A3” | 5.10 | 0.38 | 2.76E+51 | 1.07E+51 | 64.92 | 0.027 | 2.16E8 |
| A2” | 2.95 | 1.61 | 1.17E+52 | 2.06E+51 | 94.16 | 0.114 | 1.42E7 |
| A1” | 1.37 | 2.19 | 1.60E+52 | 9.12E+51 | 57.72 | 0.155 | 2.03E7 |
| C” | 0.66 | 0.83 | 6.05E+51 | 1.88E+52 | 11.71 | 0.059: | 1.61E7: |
| B1” | 0.97 | 2.15 | 1.57E+52 | 7.80E+51 | 24.21 | 0.152 | 4.65E7 |
| B2” | 1.83 | 0.76 | 5.58E+51 | 3.88E+51 | 27.01 | 0.054 | 9.30E8 |
| B3” | 3.90 | 1.07 | 7.80E+51 | 2.11E+51 | 28.00 | 0.076 | 5.33E8 |
Note. — Q values are calculated taking as reference the value given in bold-face in correspondence of the central region n3, and obtained as explained in the text. SFR and SFRD values marked with a colon are upper limits.
| Id. | RaaDistance in kpc to the center of the galaxy. Negative distances indicate regions West of the nucleus. | L(H) | Qion | N(O5) | EW(H) | SFR | SFR/pc2 |
|---|---|---|---|---|---|---|---|
| (kpc) | (1040 erg s-1) | (phot. s-1) | (Å) | (M⊙ yr-1) | (M⊙ yr-1 pc-2) | ||
| P.A. = 90∘ | |||||||
| A2 | 3.10 | 0.23 | 1.65E+51 | 33 | 28.41 | 0.016 | 9.36E-9 |
| A1 | 1.94 | 1.43 | 1.04E+52 | 208 | 15.47 | 0.101 | 1.01E-7 |
| N | 0.0 | 5.52 | 4.03E+52 | 805 | 76.07 | 0.390 | 4.49E-7 |
| B1 | 1.74 | 0.37 | 2.72E+51 | 54 | 32.60 | 0.026 | 1.76E-8 |
| P.A. = 125∘ | |||||||
| A3’ | 5.93 | 0.44 | 3.24E+51 | 65 | 82.61 | 0.031 | 2.77E-8 |
| A2’ | 3.40 | 0.40 | 2.91E+51 | 58 | 45.92 | 0.028 | 3.60E-8 |
| A1’ | 1.89 | 1.28 | 9.35E+51 | 187 | 58.24 | 0.091 | 1.09E-7 |
| N’ | 0.0 | 3.53 | 2.58E+52 | 516 | 66.08 | 0.250 | 2.68E-7 |
| B1’ | 19.35 | 0.09 | 6.80E+50 | 14 | 16.83 | 0.007 | 2.59E-9 |
| Quantity | Tol1238-364 | ESO381-G009 |
|---|---|---|
| F12 (Jy) | 0.580 0.065 | 0.125 0.035 |
| F25 (Jy) | 2.198 0.140 | 0.204 0.085 |
| F60 (Jy) | 7.942 0.130 | 1.122 0.102 |
| F100(Jy) | 13.591 0.431 | 1.378 0.296 |
| log(F25/F12) | 0.578 0.076 | 0.212 0.302 |
| log(F60/F25) | 0.558 0.034 | 0.740 0.220 |
| log(F100/F25) | 0.791 0.041 | 0.829 0.274 |
| log(F60/F12) | 1.136 0.055 | 0.953 0.161 |
| -1.476 0.090 | -1.947 0.580 | |
| -1.051 0.094 | -0.402 0.598 | |
| Tdust (K) | 39.5 | 45.1 |
| Mdust (M⊙) | 5.5106 | 3.0105 |
| LFIR (L⊙) | 3.041010 | 3.24109 |
| SFR (M⊙ yr-1) | 15.86 | 1.69 |
| Line | A1 | A2 | N | B1 | B2 | B3 | |
|---|---|---|---|---|---|---|---|
| 9.7 – 3.7 | 23.5 – 9.7 | 3.7 – 3.0 | 3.0 – 5.4 | 5.4 – 10.8 | 10.8 – 19.2 | ||
| OII | 3727 | 3.05 0.98 | 0.55 0.10 | 2.35 0.96 | 2.00 0.70 | 4.14 1.12 | |
| 4.86 | 0.84 | 4.50 | 2.69 | 5.22 | |||
| NeIII | 3869 | 0.39 0.14 | 2.16 1.36 | ||||
| 0.56 | 3.81 | ||||||
| H | 4340 | 0.12 0.02 | |||||
| 0.15 | |||||||
| OIII | 4363 | 0.11 0.04 | |||||
| 0.14 | |||||||
| HeII | 4686 | 0.13 0.03 | |||||
| 0.14 | |||||||
| OIII | 4959 | 0.24 0.06 | 2.41 0.07 | 0.39 0.23 | 0.22 0.09 | 0.38 0.11 | |
| 0.24 | 2.34 | 0.37 | 0.22 | 0.37 | |||
| OIII | 5007 | 0.71 0.20 | 0.81 0.11 | 7.38 0.15 | 1.55 0.45 | 0.51 0.12 | 0.95 0.15 |
| 0.67 | 0.79 | 7.03 | 1.44 | 0.49 | 0.93 | ||
| FeVII | 5158 | 0.08 0.03 | |||||
| 0.07 | |||||||
| FeVI | 5177 | 0.11 0.03 | |||||
| 0.10 | |||||||
| NI | 5199 | 0.18 0.03 | |||||
| 0.16 | |||||||
| CaV | 5309 | 0.13 0.03 | |||||
| 0.11 | |||||||
| HeI | 5876 | 0.16 0.07 | 0.16 0.04 | 0.18 0.02 | 0.37 0.16 | 0.09 0.04 | 0.38 0.08 |
| 0.11 | 0.13 | 0.13 | 0.22 | 0.07 | 0.32 | ||
| OI | 6300 | 0.17 0.06 | 0.81 0.03 | 0.12 0.07 | |||
| 0.10 | 0.52 | 0.09 | |||||
| OI | 6364 | 0.32 0.03 | |||||
| 0.20 | |||||||
| NII | 6548 | 0.55 0.12 | 0.27 0.05 | 1.27 0.04 | 1.43 0.29 | 0.30 0.06 | 0.30 0.07 |
| 0.32 | 0.20 | 0.77 | 0.66 | 0.21 | 0.23 | ||
| H | 6563 | 4.97 0.70 | 3.89 0.27 | 4.72 0.09 | 6.20 0.93 | 4.06 0.37 | 3.76 0.34 |
| 2.85 | 2.85 | 2.85 | 2.85 | 2.85 | 2.85 | ||
| NII | 6583 | 1.90 0.30 | 1.14 0.10 | 4.16 0.08 | 2.98 0.51 | 1.45 0.15 | 1.18 0.14 |
| 1.08 | 0.83 | 2.50 | 1.36 | 1.01 | 0.89 | ||
| SII | 6717 | 1.06 0.19 | 0.61 0.07 | 1.17 0.04 | 1.57 0.36 | 0.85 0.10 | 0.67 0.10 |
| 0.59 | 0.44 | 0.68 | 0.69 | 0.58 | 0.50 | ||
| SII | 6724 | 1.73 0.33 | 1.01 0.12 | 2.48 0.07 | 2.61 0.63 | 1.42 0.18 | 1.01 0.16 |
| 0.95 | 0.72 | 1.45 | 1.14 | 0.97 | 0.75 | ||
| SII | 6731 | 0.67 0.14 | 0.40 0.06 | 1.31 0.04 | 1.04 0.28 | 0.57 0.08 | 0.35 0.06 |
| 0.37 | 0.29 | 0.76 | 0.45 | 0.39 | 0.26 | ||
| Hbeta 4861 = 1.00 | |||||||
| F(H) ( erg/s/cm2) | 27.2 0.3 | 30.4 0.3 | 238.8 0.0 | 10.4 0.1 | 25.7 0.3 | 23.6 0.2 | |
| 84.0 | 57.2 | 664.8 | 50.4 | 52.8 | 41.4 | ||
| F(H) ( erg/s/cm2) | 5.5 0.7 | 7.8 0.5 | 50.6 1.0 | 1.7 0.2 | 6.3 0.5 | 6.3 0.5 | |
| 29.5 | 20.1 | 233.2 | 17.7 | 18.5 | 14.5 | ||
| caaExtinction coefficient | 0.73 | 0.41 | 0.66 | 1.02 | 0.47 | 0.36 | |
| E(B-V) | 0.51 | 0.28 | 0.46 | 0.71 | 0.32 | 0.25 | |
Note. — In this and the following tables, bold face numbers indicate flux ratios and absolute fluxes corrected for internal reddening. Below the label of every region, the distance in arcsec of the region’s extremes to the intensity peak along the slit are indicated; positive distances are in East direction.
| Line | A1’ | A2’ | N’ | B1’ | B2’ | |
|---|---|---|---|---|---|---|
| 8.7 – 4.0 | 22.8 – 8.7 | 4.0 – 3.7 | 3.7 – 11.4 | 11.4 – 24.5 | ||
| OII | 3727 | 3.74 0.30 | 4.14 0.87 | 1.61 0.16 | 2.74 0.36 | 3.62 0.40 |
| 4.89 | 5.92 | 2.58 | 3.75 | 4.03 | ||
| NeIII | 3869 | 0.82 0.26 | ||||
| 1.24 | ||||||
| H | 4340 | 0.48 0.09 | ||||
| 0.51 | ||||||
| OIII | 4363 | 0.17 0.07 | ||||
| 0.21 | ||||||
| HeII | 4686 | |||||
| OIII | 4959 | 0.22 0.04 | 0.37 0.12 | 2.27 0.14 | 0.23 0.06 | 0.30 0.04 |
| 0.22 | 0.36 | 2.20 | 0.22 | 0.30 | ||
| OIII | 5007 | 0.69 0.06 | 1.10 0.19 | 7.19 0.36 | 0.64 0.08 | 0.87 0.06 |
| 0.67 | 1.06 | 6.81 | 0.62 | 0.86 | ||
| NI | 5199 | 0.15 0.05 | ||||
| 0.13 | ||||||
| HeI | 5876 | 0.16 0.03 | 0.25 0.04 | 0.15 0.03 | 0.12 0.03 | |
| 0.13 | 0.17 | 0.12 | 0.11 | |||
| OI | 6300 | 0.10 0.03 | 0.21 0.06 | 0.88 0.07 | 0.18 0.04 | 0.13 0.04 |
| 0.08 | 0.14 | 0.54 | 0.13 | 0.12 | ||
| OI | 6364 | 0.30 0.05 | ||||
| 0.18 | ||||||
| NII | 6548 | 0.48 0.04 | 0.40 0.10 | 1.51 0.09 | 0.53 0.06 | 0.37 0.04 |
| 0.35 | 0.26 | 0.86 | 0.36 | 0.33 | ||
| H | 6563 | 3.93 0.16 | 4.37 0.44 | 5.00 0.25 | 4.15 0.25 | 3.24 0.13 |
| 2.85 | 2.85 | 2.85 | 2.85 | 2.85 | ||
| NII | 6583 | 1.43 0.07 | 1.60 0.19 | 4.52 0.23 | 1.51 0.11 | 0.95 0.05 |
| 1.03 | 1.04 | 2.56 | 1.03 | 0.83 | ||
| SII | 6717 | 0.56 0.05 | 1.09 0.13 | 1.48 0.09 | 0.85 0.07 | 0.61 0.05 |
| 0.40 | 0.69 | 0.81 | 0.57 | 0.53 | ||
| SII | 6724 | 1.05 0.09 | 1.76 0.23 | 2.97 0.18 | 1.41 0.11 | 0.97 0.09 |
| 0.74 | 1.11 | 1.63 | 0.94 | 0.85 | ||
| SII | 6731 | 0.49 0.05 | 0.68 0.10 | 1.49 0.09 | 0.56 0.05 | 0.37 0.04 |
| 0.35 | 0.43 | 0.82 | 0.37 | 0.32 | ||
| Hbeta 4861 = 1.00 | ||||||
| F(H) ( erg/s/cm2) | 25.5 0.3 | 14.1 0.3 | 89.9 0.9 | 34.7 0.3 | 24.1 0.2 | |
| 49.0 | 33.5 | 281.2 | 74.4 | 31.2 | ||
| F(H) ( erg/s/cm2) | 6.5 0.2 | 3.2 0.3 | 18.0 0.7 | 8.4 0.4 | 7.4 0.2 | |
| 17.2 | 11.7 | 98.7 | 26.1 | 11.0 | ||
| caaExtinction coefficient. | 0.42 | 0.56 | 0.74 | 0.49 | 0.17 | |
| E(BV) | 0.29 | 0.39 | 0.51 | 0.34 | 0.12 | |
| Line | A1” | A2” | A3” | C” | B1” | B2” | B3”aaThe emission-line ratios for region B3” are somewhat uncertain because of difficulties in appropriately correcting H for the underlying stellar absorption. This additional source of uncertainty is not contained in the errors quoted in the table. | |
|---|---|---|---|---|---|---|---|---|
| 9.4 – 2.3 | 16.8 – 9.4 | 28.2 – 16.8 | 2.3 – 1.1 | 1.1 – 4.1 | 4.1 – 9.5 | 9.5 – 22.6 | ||
| OII | 3727 | 2.15 0.34 | 3.01 0.57 | 3.08 1.48 | 4.05 1.34 | 1.73 0.54 | 3.40 0.92 | 9.37 4.69 |
| 3.06 | 4.43 | 3.49 | 6.19 | 2.88 | 4.72 | 17.60 | ||
| NeIII | 3869 | 0.64 0.35 | 1.83 1.15 | |||||
| H | 4340 | |||||||
| OIII | 4363 | |||||||
| HeII | 4686 | |||||||
| OIII | 4959 | 0.25 0.05 | 0.34 0.06 | 0.48 0.17 | 1.66 0.46 | 0.46 0.13 | 0.24 0.04 | 0.99 0.50 |
| 0.24 | 0.33 | 0.48 | 1.61 | 0.44 | 0.23 | 0.95 | ||
| OIII | 5007 | 0.80 0.08 | 1.02 0.09 | 1.14 0.22 | 5.38 1.08 | 1.41 0.20 | 0.78 0.20 | 3.48 1.15 |
| 0.77 | 0.98 | 1.12 | 5.12 | 1.33 | 0.75 | 3.24 | ||
| NI | 5199 | |||||||
| HeI | 5876 | 0.14 0.04 | 0.15 0.05 | 0.40 0.24 | 0.22 0.05 | |||
| 0.11 | 0.11 | 0.29 | 0.15 | |||||
| OI | 6300 | 0.09 0.02 | 0.17 0.04 | 0.46 0.20 | 0.21 0.08 | 0.48 0.24 | ||
| 0.06 | 0.11 | 0.29 | 0.15 | 0.25 | ||||
| OI | 6364 | |||||||
| NII | 6548 | 0.34 0.04 | 0.37 0.04 | 0.30 0.09 | 1.76 0.40 | 0.57 0.09 | 0.32 0.10 | 0.33 0.19 |
| 0.22 | 0.23 | 0.26 | 1.06 | 0.31 | 0.22 | 0.16 | ||
| H | 6563 | 4.34 0.22 | 4.52 0.23 | 3.31 0.46 | 4.73 0.90 | 5.25 0.42 | 4.22 0.51 | 6.06 1.70 |
| 2.85 | 2.85 | 2.85 | 2.85 | 2.85 | 2.85 | 2.85 | ||
| NII | 6583 | 1.58 0.09 | 1.38 0.08 | 0.99 0.18 | 3.85 0.77 | 2.41 0.22 | 1.73 0.24 | 2.33 0.77 |
| 1.03 | 0.87 | 0.85 | 2.31 | 1.30 | 1.16 | 1.09 | ||
| SII | 6717 | 0.79 0.06 | 0.74 0.06 | 0.77 0.17 | 1.33 0.33 | 0.98 0.12 | 0.94 0.18 | 1.79 0.63 |
| 0.50 | 0.45 | 0.66 | 0.77 | 0.51 | 0.62 | 0.80 | ||
| SII | 6724 | 1.29 0.12 | 1.30 0.10 | 1.31 0.30 | 2.58 0.65 | 1.70 0.22 | 1.60 0.34 | 3.05 1.13 |
| 0.82 | 0.79 | 1.12 | 1.50 | 0.88 | 1.05 | 1.36 | ||
| SII | 6731 | 0.50 0.06 | 0.56 0.05 | 0.54 0.14 | 1.25 0.31 | 0.72 0.10 | 0.66 0.15 | 1.26 0.49 |
| 0.32 | 0.34 | 0.46 | 0.73 | 0.37 | 0.43 | 0.56 | ||
| Hbeta 4861 = 1.00 | ||||||||
| F(H) ( erg s-1 cm-2) | 33.8 0.3 | 22.9 0.2 | 10.1 0.1 | 10.8 0.2 | 22.6 0.2 | 12.5 0.3 | 8.4 0.3 | |
| 79.5 | 58.4 | 13.7 | 30.1 | 78.2 | 27.8 | 38.8 | ||
| F(H) ( erg s-1 cm-2) | 7.8 0.3 | 5.1 0.2 | 3.1 0.4 | 2.3 0.4 | 4.3 0.3 | 3.0 0.3 | 1.4 0.3 | |
| 27.9 | 20.5 | 4.8 | 10.6 | 27.5 | 9.8 | 13.6 | ||
| cbbExtinction coefficient. | 0.55 | 0.61 | 0.20 | 0.67 | 0.80 | 0.52 | 0.99 | |
| E(BV) | 0.39 | 0.42 | 0.14 | 0.46 | 0.56 | 0.36 | 0.69 | |
| P.A. = 150∘ | P.A. = 146∘ | |||||||||||
|---|---|---|---|---|---|---|---|---|---|---|---|---|
| Line | n1 | n2 | n3 | n4 | n5 | n1’ | n2’ | n3’ | n4’ | n5’ | ||
| 3.7 – 2.0 | 2.0 – 0.3 | 0.3 – 0.7 | 0.7 – 1.7 | 1.7 – 3.0 | 4.0 – 2.0 | 2.0 – 0.3 | 0.3 – 0.7 | 0.7 – 2.0 | 2.0 – 3.7 | |||
| OII | 3727 | 4.00 3.56 | 0.08 0.02 | 0.51 0.10 | 4.18 1.00 | 6.14 2.27 | 1.05 0.18 | 0.68 0.07 | 2.15 0.32 | 5.58 1.79 | ||
| 6.87 | 0.15 | 0.51 | 4.28 | 13.20 | 1.79 | 0.96 | 2.71 | 10.89 | ||||
| NeIII | 3869 | 0.22 0.13 | 0.52 0.13 | 1.59 0.48 | 0.74 0.19 | 0.44 0.08 | 1.14 0.35 | |||||
| 0.38 | 0.52 | 1.62 | 1.18 | 0.60 | 1.40 | |||||||
| H | 4340 | 0.16 0.02 | 0.30 0.05 | 0.21 0.03 | 0.12 0.04 | |||||||
| 0.22 | 0.30 | 0.25 | 0.13 | |||||||||
| OIII | 4363 | 0.11 0.03 | 0.19 0.05 | 1.27 0.61 | 0.22 0.13 | 0.12 0.03 | 0.25 0.11 | |||||
| HeII | 4686 | 0.12 0.03 | 0.12 0.04 | 0.14 0.04 | 0.13 0.06 | |||||||
| 0.14 | 0.12 | 0.15 | 0.14 | |||||||||
| OIII | 4959 | 1.07 0.59 | 2.57 0.26 | 2.62 0.05 | 1.96 0.14 | 1.58 0.28 | 0.75 0.41 | 2.30 0.16 | 2.39 0.07 | 2.06 0.16 | 1.19 0.45 | |
| 1.03 | 2.40 | 2.51 | 1.96 | 1.58 | 0.71 | 2.21 | 2.33 | 2.03 | 1.13 | |||
| OIII | 5007 | 2.69 0.89 | 8.38 0.67 | 8.05 0.08 | 5.83 0.29 | 4.61 0.60 | 3.32 1.00 | 7.14 0.43 | 7.49 0.15 | 6.29 0.38 | 3.77 0.90 | |
| 2.53 | 7.50 | 7.49 | 5.83 | 4.60 | 3.04 | 6.71 | 7.20 | 6.12 | 3.49 | |||
| FeVII | 5158 | 0.06 0.01 | 0.08 0.03 | 0.05 0.02 | ||||||||
| 0.05 | 0.08 | 0.05 | ||||||||||
| FeVI | 5177 | 0.08 0.03 | ||||||||||
| 0.08 | ||||||||||||
| NI | 5199 | 0.26 0.08 | 0.15 0.02 | 0.14 0.03 | 0.15 0.04 | 0.16 0.02 | 0.12 0.03 | |||||
| 0.20 | 0.13 | 0.14 | 0.13 | 0.14 | 0.11 | |||||||
| CaV | 5309 | 0.06 0.02 | 0.07 0.02 | |||||||||
| 0.05 | 0.07 | |||||||||||
| NII | 5755 | 0.08 0.02 | 0.09 0.02 | |||||||||
| 0.05 | 0.09 | |||||||||||
| HeI | 5876 | 0.26 0.08 | 0.21 0.02 | 0.10 0.01 | 0.16 0.08 | 0.56 0.63 | 0.23 0.05 | 0.22 0.02 | 0.20 0.06 | |||
| 0.12 | 0.13 | 0.10 | 0.16 | 0.31 | 0.15 | 0.17 | 0.17 | |||||
| FeVII | 6086 | 0.11 0.03 | 0.09 0.02 | |||||||||
| 0.06 | 0.07 | |||||||||||
| OI | 6300 | 0.77 0.42 | 1.15 0.15 | 1.01 0.03 | 0.37 0.03 | 0.33 0.12 | 0.50 0.32 | 0.81 0.08 | 0.88 0.04 | 0.80 0.10 | 0.61 0.27 | |
| 0.44 | 0.42 | 0.52 | 0.37 | 0.32 | 0.22 | 0.46 | 0.61 | 0.63 | 0.30 | |||
| OI | 6364 | 0.40 0.10 | 0.37 0.02 | 0.15 0.03 | 0.29 0.06 | 0.29 0.03 | 0.25 0.07 | … | ||||
| 0.14 | 0.19 | 0.15 | 0.16 | 0.20 | 0.19 | |||||||
| NII | 6548 | 1.06 0.39 | 2.53 0.23 | 1.65 0.03 | 0.51 0.04 | 0.81 0.16 | 1.36 0.50 | 1.58 0.13 | 1.30 0.04 | 1.10 0.10 | 0.94 0.36 | |
| 0.56 | 0.81 | 0.78 | 0.51 | 0.79 | 0.55 | 0.84 | 0.86 | 0.84 | 0.42 | |||
| H | 6563 | 5.44 1.36 | 9.00 0.63 | 6.06 0.06 | 1.83 0.09 | 2.93 0.38 | 7.12 1.71 | 5.40 0.32 | 4.32 0.09 | 3.76 0.23 | 6.34 1.33 | |
| 2.85 | 2.85 | 2.85 | 1.83 | 2.85 | 2.85 | 2.85 | 2.85 | 2.85 | 2.85 | |||
| NII | 6583 | 3.10 0.84 | 7.22 0.58 | 5.06 0.05 | 1.59 0.08 | 2.24 0.31 | 4.13 1.07 | 5.00 0.30 | 4.19 0.08 | 3.61 0.22 | 4.25 0.98 | |
| 1.61 | 2.26 | 2.36 | 1.59 | 2.18 | 1.64 | 2.62 | 2.75 | 2.73 | 1.90 | |||
| SII | 6717 | 1.34 0.48 | 1.92 0.17 | 1.27 0.03 | 0.47 0.03 | 0.92 0.17 | 1.91 0.63 | 1.55 0.11 | 1.30 0.04 | 1.35 0.11 | 1.66 0.46 | |
| 0.67 | 0.56 | 0.57 | 0.47 | 0.89 | 0.72 | 0.78 | 0.83 | 1.00 | 0.71 | |||
| SII | 6724 | 2.49 0.92 | 4.04 0.36 | 2.77 0.06 | 0.95 0.07 | 1.66 0.33 | 3.40 1.16 | 3.05 0.21 | 2.70 0.08 | 2.67 0.21 | 2.81 0.84 | |
| 1.25 | 1.18 | 1.24 | 0.95 | 1.61 | 1.28 | 1.54 | 1.73 | 1.99 | 1.19 | |||
| SII | 6731 | 1.15 0.44 | 2.12 0.19 | 1.49 0.03 | 0.48 0.03 | 0.75 0.16 | 1.49 0.54 | 1.51 0.11 | 1.40 0.04 | 1.32 0.11 | 1.14 0.36 | |
| 0.57 | 0.62 | 0.66 | 0.48 | 0.73 | 0.56 | 0.76 | 0.90 | 0.98 | 0.48 | |||
| Hbeta 4861 = 1.00 | ||||||||||||
| F(H) ( erg/s/cm2) | 66.6 2.0 | 746.5 0.0 | 1528.0 0.0 | 322.7 3.2 | 74.7 2.2 | 54.7 1.6 | 240.9 2.4 | 419.5 0.0 | 132.9 1.3 | 55.1 1.7 | ||
| 247.5 | 7702.0 | 7065.0 | 322.7 | 79.0 | 351.0 | 881.4 | 975.8 | 233.2 | 279.1 | |||
| F(H) ( erg/s/cm2) | 12.3 2.7 | 83.0 5.8 | 252.2 2.5 | 176.8 7.1 | 25.5 2.5 | 7.7 1.6 | 44.6 2.2 | 97.2 1.9 | 35.3 1.8 | 8.7 1.6 | ||
| 86.9 | 2703.0 | 2479.0 | 176.8 | 27.7 | 123.1 | 309.3 | 342.6 | 81.8 | 97.9 | |||
| caaExtinction coefficient. | 0.85 | 1.51 | 0.99 | 0.00 | 0.04 | 1.20 | 0.84 | 0.55 | 0.36 | 1.05 | ||
| E(B-V) | 0.59 | 1.05 | 0.69 | 0.00 | 0.03 | 0.84 | 0.59 | 0.38 | 0.25 | 0.73 | ||
| Line | A1 | A2 | N | B1 | |
|---|---|---|---|---|---|
| 14.4 – 3.6 | 32.9 – 14.4 | 3.6– 5.8 | 5.8 – 21.8 | ||
| OIII | 4959 | 0.31 0.06 | |||
| 0.30 | |||||
| OIII | 5007 | 1.07 0.66 | 0.94 0.64 | 1.06 0.08 | 1.72 0.71 |
| 0.96 | 0.89 | 1.00 | 1.59 | ||
| NI | 5199 | ||||
| HeI | 5876 | 0.20 0.04 | |||
| 0.14 | |||||
| OI | 6300 | ||||
| OI | 6364 | ||||
| NII | 6548 | 0.81 1.44 | 0.44 0.04 | ||
| 0.26 | 0.25 | ||||
| H | 6563 | 8.78 3.86 | 4.75 2.00 | 5.01 0.20 | 6.59 1.58 |
| 2.85 | 2.85 | 2.85 | 2.85 | ||
| NII | 6583 | 2.23 1.36 | 1.11 0.79 | 1.13 0.07 | 1.96 0.76 |
| 0.72 | 0.66 | 0.64 | 0.84 | ||
| SII | 6717 | 2.23 1.56 | 1.08 0.79 | 0.61 0.05 | 1.09 0.51 |
| 0.67 | 0.63 | 0.33 | 0.45 | ||
| SII | 6724 | 4.57 3.15 | 2.36 1.63 | 1.10 0.10 | 2.27 1.04 |
| 1.37 | 1.37 | 0.60 | 0.93 | ||
| SII | 6731 | 2.35 1.60 | 1.28 0.84 | 0.49 0.05 | 1.17 0.53 |
| 0.70 | 0.74 | 0.27 | 0.48 | ||
| Hbeta 4861 = 1.00 | |||||
| F(H) ( erg/s/cm2) | 61.8 7.4 | 34.1 3.1 | 745.5 0.0 | 28.8 1.7 | |
| 606.0 | 96.2 | 2343.0 | 158.1 | ||
| F(H) ( erg/s/cm2) | 7.0 2.3 | 7.2 2.4 | 148.8 6.0 | 4.4 0.8 | |
| 212.7 | 33.8 | 821.9 | 55.5 | ||
| caaExtinction coefficient. | 1.48 | 0.67 | 0.74 | 1.10 | |
| E(BV) | 1.03 | 0.47 | 0.52 | 0.77 | |
| Line | A1’ | A2’ | A3’ | N’ | |
|---|---|---|---|---|---|
| 12.8 – 3.7 | 21.2 – 12.8 | 33.3 – 21.2 | 3.7 – 6.4 | ||
| OII | 3727 | 2.80 0.53 | 5.58 2.96 | 6.08 3.47 | 2.27 0.30 |
| 3.73 | 8.82 | 8.42 | 3.20 | ||
| NeIII | 3869 | 0.89 0.59 | 0.81 0.21 | ||
| 1.14 | 1.09 | ||||
| H | 4340 | ||||
| OIII | 4363 | ||||
| HeII | 4686 | ||||
| OIII | 4959 | 0.26 0.06 | 0.75 0.40 | 0.47 0.30 | 0.27 0.03 |
| 0.25 | 0.73 | 0.46 | 0.26 | ||
| OIII | 5007 | 0.63 0.07 | 1.70 0.48 | 1.41 0.49 | 0.87 0.05 |
| 0.61 | 1.61 | 1.36 | 0.84 | ||
| NI | 5199 | ||||
| HeI | 5876 | 0.14 0.03 | 0.23 0.15 | 0.20 0.02 | |
| 0.11 | 0.18 | 0.15 | |||
| OI | 6300 | 0.14 0.04 | 0.06 0.03 | ||
| 0.10 | 0.04 | ||||
| OI | 6364 | ||||
| NII | 6548 | 0.32 0.05 | 0.24 0.19 | 0.23 0.41 | 0.38 0.03 |
| 0.23 | 0.14 | 0.16 | 0.25 | ||
| H | 6563 | 4.01 0.20 | 4.93 1.04 | 4.21 1.26 | 4.30 0.17 |
| 2.85 | 2.85 | 2.85 | 2.85 | ||
| NII | 6583 | 1.23 0.09 | 1.16 0.36 | 0.78 0.53 | 1.08 0.05 |
| 0.87 | 0.67 | 0.53 | 0.71 | ||
| SII | 6717 | 0.90 0.08 | 1.35 0.54 | 0.91 0.46 | 0.57 0.05 |
| 0.63 | 0.75 | 0.60 | 0.37 | ||
| SII | 6724 | 1.59 0.16 | 2.25 0.99 | 1.58 0.85 | 1.04 0.08 |
| 1.10 | 1.25 | 1.04 | 0.67 | ||
| SII | 6731 | 0.68 0.07 | 0.90 0.45 | 0.68 0.40 | 0.47 0.04 |
| 0.47 | 0.50 | 0.45 | 0.30 | ||
| Hbeta 4861 = 1.00 | |||||
| F(H) ( erg/s/cm2) | 27.2 0.3 | 5.6 0.2 | 8.5 0.8 | 65.1 0.7 | |
| 54.4 | 17.0 | 18.8 | 150.1 | ||
| F(H) ( erg/s/cm2) | 6.8 0.3 | 1.1 0.2 | 2.0 0.4 | 15.1 0.5 | |
| 19.1 | 5.9 | 6.6 | 52.6 | ||
| caaExtinction coefficient. | 0.45 | 0.72 | 0.51 | 0.54 | |
| E(B-V) | 0.31 | 0.50 | 0.36 | 0.38 | |