Internal Dynamics, Structure, and Formation of Dwarf Elliptical Galaxies: II. Rotating Versus Non-Rotating Dwarfs
Abstract
We present spatially-resolved internal kinematics and stellar chemical abundances for a sample of dwarf elliptical (dE) galaxies in the Virgo Cluster observed with the Keck telescope***Data presented herein were obtained at the W. M. Keck Observatory, which is operated as a scientific partnership among the California Institute of Technology, the University of California and the National Aeronautics and Space Administration. The Observatory was made possible by the generous financial support of the W. M. Keck Foundation. and Echelle Spectrograph and Imager. In combination with previous measurements, we find that 4 out of 17 dEs have major axis rotation velocities consistent with rotational flattening, while the remaining dEs have no detectable major axis rotation. Despite this difference in internal kinematics, rotating and non-rotating dEs are remarkably similar in terms of their position in the Fundamental Plane, morphological details, stellar populations, and local environment. We present evidence for (or confirm the presence of) faint underlying disks and/or weak substructure in a fraction of both rotating and non-rotating dEs, but a comparable number of counter-examples exist for both types which show no evidence of such structure. Absorption-line strengths were determined based on the Lick/IDS system (H, Mgb, Fe5270, Fe5335) for the central region of each galaxy. We find no difference in the line-strength indices, and hence stellar populations, between rotating and non-rotating dE galaxies. The best-fitting mean age and metallicity for our 17 dE sample are 5 Gyr and dex, respectively, with rms spreads of 3 Gyr and 0.1 dex. The majority of dEs are consistent with solar abundance ratios. By contrast, the stellar populations of classical elliptical galaxies are, on average, older, more metal rich, and -enhanced relative to our dE sample. The line-strengths of our dEs are consistent with the extrapolation of the line-strength versus velocity dispersion trend seen in classical elliptical galaxies. Finally, the local environments of both rotating and non-rotating dEs appear to be diverse in terms of their proximity to larger galaxies in real or velocity space within the Virgo Cluster. Thus, rotating and non-rotating dEs are remarkably similar in terms of their structure, stellar content, and local environments, presenting a significant challenge to theoretical models of their formation.
1 Introduction
Dwarf elliptical (dE) galaxies are the dominant galaxy type in nearby galaxy clusters, accounting for more than 75% of all objects in these regions down to a limiting magnitude of (Bingelli, Sandage, & Tammann, 1988; Trentham & Tully, 2002). They are characterized by low effective surface brightness mag arcsec-2 and faint luminosities (for a review see Ferguson & Binggeli, 1994). Unlike classical elliptical galaxies whose surface brightness profiles tend to be well fit by the de Vaucouleurs law (de Vaucouleurs, 1948), dEs have brightness profiles that are characterized by Sérsic profiles (Sérsic, 1968) with indices ranging between –3 (where corresponds to an exponential law and to an law) making them appear more diffuse than classical ellipticals of the same total magnitude. A direct illustration of this is the discontinuity in surface brightness between dEs and the low luminosity end of classical elliptical galaxy sequence (Kormendy 1985; Bender, Burstein, & Faber 1992; however, see Graham & Guzman 2003).
Detailed studies of the internal dynamics of Local Group dEs have been carried out over the past two decades (e.g., Bender, Paquet, & Nieto, 1991), but, until recently, only integrated measurements were available for more distant dEs (Peterson & Caldwell, 1993). The number of dEs outside the Local Group with spatially-resolved measurements of internal kinematics has increased dramatically in the last few years (De Rijcke et al., 2001; Geha, Guhathakurta, & van der Marel, 2002; Pedraz et al., 2002; Simien & Prugniel, 2002). These observations have revealed an intriguing diversity of properties: several dEs in the Virgo and Fornax clusters appear to be roughly consistent with rotational flattening, while others have no detectable rotation similar to their Local Group counterparts (Bender et al., 1991). This range in rotation velocities is a newly found feature of cluster dEs that must be explained by theoretical models of their formation.
Formation scenarios for dE galaxies fall into two broad categories: (1) dEs are old, primordial objects, and (2) dEs have recently evolved or transformed from a progenitor galaxy population. Two independent lines of observational evidence favor the latter category. Primordial dwarf galaxies are expected to be less strongly clustered than massive galaxies in the context of hierarchical structure formation theories, whereas the dE-to-giant galaxy ratio is observed to be higher in regions of higher galaxy density (Ferguson & Sandage, 1991). The radial velocity distribution of galaxies in the Virgo Cluster suggests that dEs may be a recently accreted population (Bothun & Mould, 1988; Conselice, Gallagher, & Wyse, 2001).
From simulations, Moore, Lake, & Katz (1998) suggest that galaxy harassment in clusters can morphologically transform a spiral galaxy into a dE. Recent observations of embedded disks in a handful of Virgo and Fornax dEs support this model (Jerjen, Kalnajs, & Binggeli, 2000; Barazza, Binggeli, & Jerjen, 2002; De Rijcke et al., 2003). Galaxy harassment partially disrupts the rotational motion of the progenitor galaxy while increasing velocity dispersions, and is expected to result in a range of rotational velocities. It is yet unclear whether this scenario can reproduce the large fraction of dEs with extremely low rotational velocities (Geha et al., 2002). Another model suggests that gas-rich dwarf irregular and/or small spiral galaxies are transformed into dEs through the process of ram pressure stripping (Faber & Lin, 1983). In this case, dEs would be expected to largely retain the rotational properties of their progenitors. The degree of rotational support present in dE galaxies is thus a strong constraint on formation models.
We investigate whether or not dE properties such as morphology, stellar population, and local environment are correlated with the degree of internal rotation. A sample of 17 dEs in the Virgo Cluster forms the basis of this study. In § 2, we present Keck spectroscopy and imaging for eleven dEs and combine these observations with the six additional dEs previously presented in Geha et al. (2002). In § 3.1, we discuss the kinematic profiles of this sample and distinguish between rotating and non-rotating dEs. In §§ 3.2–3.4, respectively, we examine the position of the rotating and non-rotating sub-samples in the Fundamental Plane, study galaxy morphologies, and probe stellar populations using absorption-line-strength indices. In § 4, we compare the local environments of rotating and non-rotating dEs within the Virgo Cluster. Finally, in § 5, we argue that major axis rotation velocity appears to be uncorrelated with other internal properties and local environment for the dEs in our sample, and discuss the broader implications of these results.
Throughout this paper a Virgo Cluster true distance modulus of is adopted, i.e., a distance of 15.3 Mpc, as determined by the Hubble Space Telescope†††Based on observations with the NASA/ESA Hubble Space Telescope, obtained at the Space Telescope Science Institute, which is operated by the Association of Universities for Research in Astronomy, Inc., under NASA contract NAS 5-26555. (HST) Key Project on the extragalactic distance scale (Freedman et al., 2001). Line-of-sight extinction values are taken from Schlegel, Finkbeiner, & Davis (1998) assuming a standard Galactic reddening law with .
2 Data
2.1 The Sample
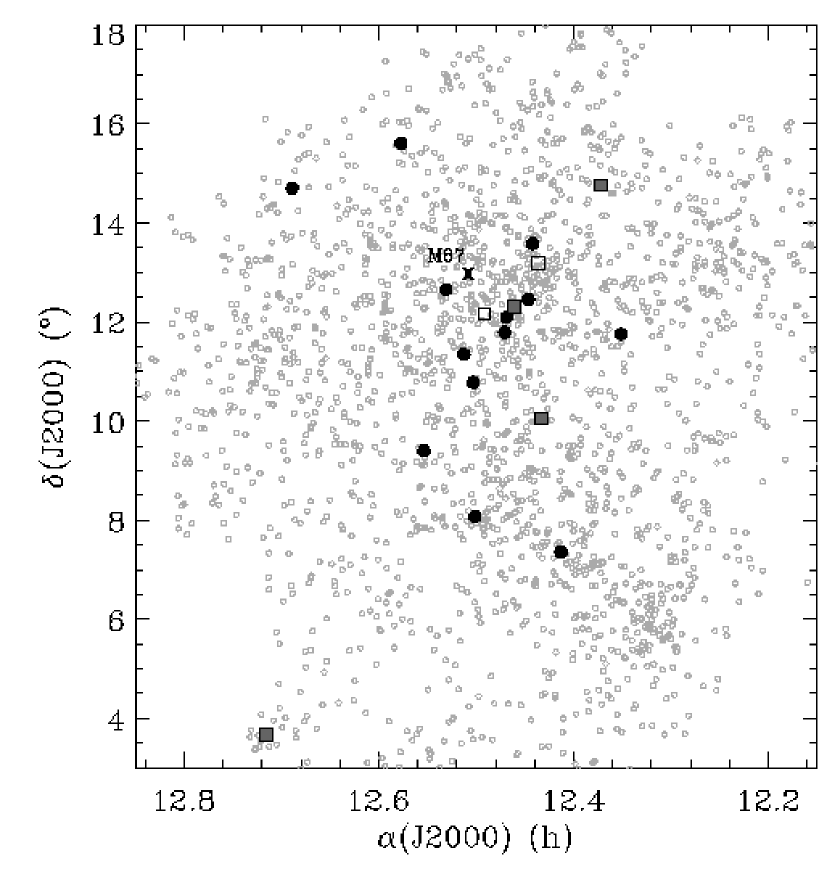
We present Keck spectroscopy and imaging for eleven Virgo Cluster dE galaxies (in § 2.2 and § 2.3, respectively) and combine these with observations of an additional six Virgo Cluster dEs previously presented in Geha et al. (2002). This sample of 17 Virgo dEs is then analyzed together throughout the paper. The general properties of the full sample are listed in Table 1. The distribution of the dEs on the sky and in velocity space are shown in Figure 1. The galaxies lie primarily near the bright end of the dE luminosity function and were chosen to cover a range of ellipticities. All but three of the galaxies discussed in this paper were classified as “dE” by Bingelli, Sandage, & Tammann (1985). These three galaxies are included in our sample as they lie in the region of the Fundamental Plane typical for dEs (Figure 5). Two of these objects, VCC 1386 and VCC 1488, were classified as normal ellipticals with an uncertainty flag (E:), but are likely to be misclassified dEs. The third object, VCC 1036, was classified as a transition dE/dS0 galaxy; however, as we discuss in § 3.3, the presence of disks and other substructure may be fairly common among dEs. In several of our figures, we include two additional galaxies, VCC 1122 and VCC 1407 (Simien & Prugniel, 2002). These are the only other Virgo Cluster galaxies with published spatially-resolved internal kinematics outside our sample that are classified as “dE” by Bingelli et al. (1985).
2.2 Spectroscopy
Eleven dE galaxies were observed on 2002 March 10–11 using the Keck II 10-m telescope and the Echelle Spectrograph and Imager (ESI; Sheinis et al., 2002). The observing setup was identical to that for the six additional Virgo dEs presented in Geha et al. (2002). Observations were made in the echellette mode with continuous wavelength coverage over the range – across 10 echelle orders with a spectral dispersion of 11.4 km s-1 pixel-1. The spectra were obtained through a slit, resulting in an instrumental resolution of 23 km s-1 (Gaussian sigma) over the entire spectrum. The slit was positioned on the major axis of each galaxy, with the galaxy’s center displaced from the center of the slit along its length. A summary of observing parameters is given in Table 2.
The ESI data were reduced using a combination of IRAF echelle and long-slit spectral reduction tasks. This is described in detail in Geha et al. (2002); a brief summary is given here. The sum of a bright calibration star exposure and a flat field exposure were used to trace a fiducial point and the ends of the slit for each of the 10 curved echelle orders. After overscan and dark frame subtraction, scattered light was subtracted from individual frames by fitting a smooth function to the areas outside the apertures corresponding to the echelle orders (as defined by the tracing of the slit ends). To preserve spatial information, the APALL task was used in “strip” mode to extract and rectify two-dimensional rectangular strips for each echelle order. The rectified orders for both data and calibration frames were then interpolated to a common spatial pixel scale of per pixel. Data reduction was carried out on these rectified strips. Each strip was divided by its corresponding normalized flat-field image. Individual exposures were cleaned of cosmic rays and combined. Cosmic rays were easily distinguished from night sky lines even after the slight smearing caused by interpolation during the rectification process.
A two-dimensional wavelength solution was determined for each rectified echelle order from a combined Cu/Ar/Hg/Ne arc lamp spectrum. The wavelength solution was applied to the data (to render vertical lines of constant wavelength) using either a logarithmic wavelength interpolation scheme (with 11.4 km s-1 pixels) or linear interpolation (with pixels) for the kinematic and line strength analyses, respectively. The sky spectrum was determined for each combined frame from a -wide section near the end of the slit farthest from the galaxy center (), and subtracted from the rest of the two-dimensional spectrum. The galaxy data were extracted into one-dimensional spectra in spatial (radial) bins to achieve a signal-to-noise level of per pixel in all radial bins, while ensuring that the spatial bin size is at least as large as the FWHM of seeing during the observations (). The galaxy continuum flux in each order of each one-dimensional spectrum was then individually normalized to unity. Finally, the strips from the different echelle orders were combined, weighted by the noise frame, to create a single two-dimensional long-slit spectrum. The reddest and two bluest echelle orders were not included in the analysis due to low signal-to-noise; the final combined spectrum covers .
The mean line-of-sight velocity and velocity dispersion as a function of radius were determined using a pixel-fitting method described in van der Marel (1994). As demonstrated in Geha et al. (2002), internal velocity dispersions from this observing setup can be measured down to the instrumental resolution of 23 km s-1 with an accuracy of %. Velocity profiles were recovered using template stars ranging in spectral type from G8III to M0III. The best fitting template stars, HD48433 and HD40460 (both K1III stars with [Fe/H] = and dex, respectively) were used to recover the velocity and velocity dispersion profiles presented in § 3.1.
2.3 Imaging
Imaging for the above spectroscopic dE sample came from two sources: archival HST Wide Field Planetary Camera 2 (WFPC2) images were available for five of the dEs, while the remaining six were imaged with ESI during our spectroscopic run. The WFPC2 data, first presented in Miller et al. (1998) and Stiavelli et al. (2001), consist of -s WFPC2 images in the F555W () bandpass, except in the case of VCC 1261 where only archival WFPC2 F702W (-band) imaging was available (Rest et al., 2001); photometric parameters for this galaxy were transformed to -band assuming = 0.5 (Prugniel & Heraudeau, 1998). The WFPC2 images were cleaned of cosmic rays and combined; instrumental magnitudes were calibrated to standard passbands using the transformations of Holtzman et al. (1995). The ground-based ESI images consist of -s -band exposures, with the seeing FWHM ranging between . In imaging mode, ESI has pixels and a field-of-view. The ESI images were bias subtracted and flat fielded using twilight sky exposures. Photometric zero-points were determined based on observations of standard star fields taken on a different (but also photometric) night; our surface photometry and total magnitudes agree with previously published values.
Surface brightness profiles were determined for all galaxies using the IRAF ELLIPSE isophotal fitting routine (Jedrzejewski, 1987). Half-light effective radii () and effective surface brightnesses () were calculated by fitting a Sérsic profile of the form to the observed -band data. A Sérsic index represents an exponential profile and is a de Vaucouleurs law. The best-fit Sérsic profile is determined by non-linear least-squares fitting to the region ; in this region, contributions from the nucleus and effects of the different spatial resolution of ESI and WFPC2 should be negligible. Sérsic indices, half-light effective radii and effective surface brightnesses are listed in Table 3. The average ellipticity and -parameter (discussed in § 3.3) also listed in this table were determined over the same radial range.
3 Results
3.1 Kinematic Profiles
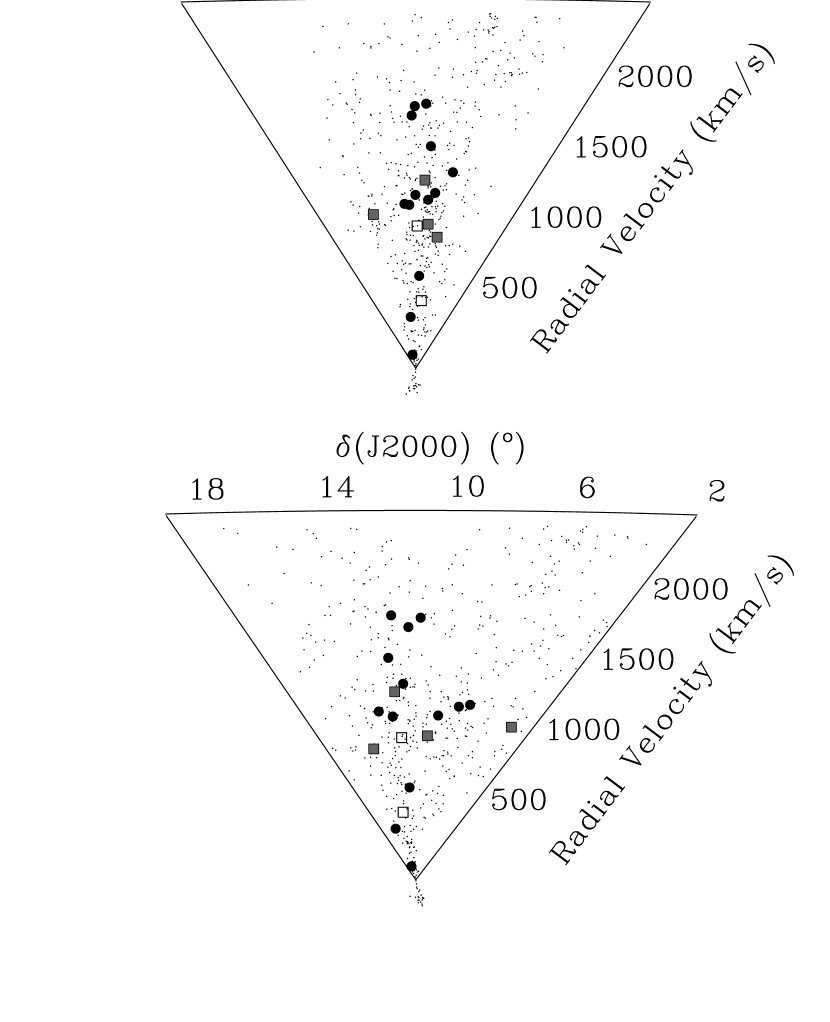
Kinematic profiles for the eleven Virgo Cluster dEs are presented in Figures 2 and 3. We have separately plotted dEs with significant rotation velocities and those which show no evidence for substantial rotation along the major axis ( km s-1, or see below). For the former kinematic profiles (Figure 2), our observations do not reach out to a large enough radius in three out of four dEs to observe a turnover in the rotation curve; in these galaxies we measure only a lower limit to the maximum rotational velocity. We argue below that our observations are not far from the turnover radius. The maximum rotation velocity () are quoted as lower limits in Table 1 and shown as up-arrows in Figure 4. For galaxies which show no evidence for substantial rotation (Figure 3), we estimate the upper limit on the maximum rotation velocity by differencing the average velocities on either side of the major axis of the galaxy and dividing by two. Error bars on rotational motion were determined by adding in quadrature the error of the mean velocity on either side of the major axis. These quantities along with the heliocentric velocity and velocity dispersion are listed in Table 1.
We note that five dEs in our combined sample (VCC 543, VCC 856, VCC 1036, VCC 1087, VCC 1261) have been previously observed by Simien & Prugniel (2002) and/or Pedraz et al. (2002). Our kinematic profiles are entirely consistent with these measurements. Due to the higher spectral resolution and signal-to-noise ratio of our observations, we are able to place significantly tighter constraints on the rotational velocity for two of these galaxies. In all cases, we obtain a more accurate estimate of the velocity dispersions.
For the dE profiles in Figure 3, it is difficult to explain the lack of observed major axis rotation as being a result of insufficient radial coverage. The majority of our kinematic profiles are measured out to between 0.5–1.0 . Two-integral dynamical models predict that if these galaxies were oblate, isotropic rotators we should have reached or measured beyond the maximum rotation velocity at these radii (see Figures 8–9 in Dehnen & Gerhard, 1994). Although these models are based on the specific case of density profiles with at large radii and a varying inner cusp slope, the predictions for are generic and should not be very different for a Sérsic profile (as is more appropriate for dE galaxies). As an example, we measure the velocity profile of the dE3 galaxy VCC 1261 out to its effective radius of (Figure 3). As we discuss below, if the observed flattening in this galaxy was due to rotation, we would expect , implying a maximum rotation velocity of 30 km s-1 given the average dispersion velocity of 45 km s-1. This is in stark contrast to the measured upper limit on rotation in VCC 1261 of 0.5 km s-1.
Conversely, for the four profiles with measurable rotation velocities (Figure 2), it is not surprising that we observe a turnover in the rotation curve for only one out of four strongly rotating galaxies (VCC 856). For these dEs, we only have kinematic data out to . The models of Dehnen & Gerhard suggest that we have barely reached the maximum rotation velocity in these systems and would need to observe a little further out in radius in order to see a turnover in these rotation curves. The rotation velocities for the these dEs are listed as lower limits in Table 1.
To compare the degree of rotational support in our full sample of 17 dEs, we plot the ratio of the maximum rotational velocity to the average velocity dispersion () versus ellipticity (Figure 4, left panel). The solid line in this figure is the ratio expected from an oblate, isotropic, rotationally-flattened body seen edge-on; systems that are not edge-on should have somewhat larger predicted values (Binney & Tremaine, 1987). The lower limits on for the four galaxies with measured rotation are consistent with rotational flattening. The upper limits on determined for the majority of our dEs are significantly smaller than expected if the observed flattenings were due to rotation and imply that these objects must be supported by anisotropic velocity dispersions. In our present sample, the degree of rotational support does not appear to be a continuous distribution: we observed either dEs with no measurable major axis rotation, or dEs with rotation velocities approaching that expected for rotational support. There is a natural division in our sample between “rotating” and “non-rotating” dEs; we arbitrarily place the dividing line in our sample as galaxies with rotational support greater or less than . Rotating and non-rotating dEs cover a similar range of ellipticities and absolute magnitudes. Figure 4 suggests that rotational support is not correlated to either of these quantities. In the remaining sections, we explore whether or not any other global dE property is correlated to rotational properties.
The mean velocity dispersions for the dEs in Figures 2 and 3, determined outside of to exclude any nuclear contributions, range between 25 and 45 km s-1. The velocity dispersion profiles are either constant as a function of radius or show a decrease in dispersion in the central region. As demonstrated in Geha et al. (2002), such profiles can in general be adequately modeled assuming that the stellar mass density profile is equal to the luminosity density profile times a constant mass-to-light ratio. Although spherical, isotropic models do not necessarily fit the observed velocity dispersion profiles in detail, such models do in general reproduce the overall shape of the observed dE velocity dispersion profiles.
3.2 The Fundamental Plane
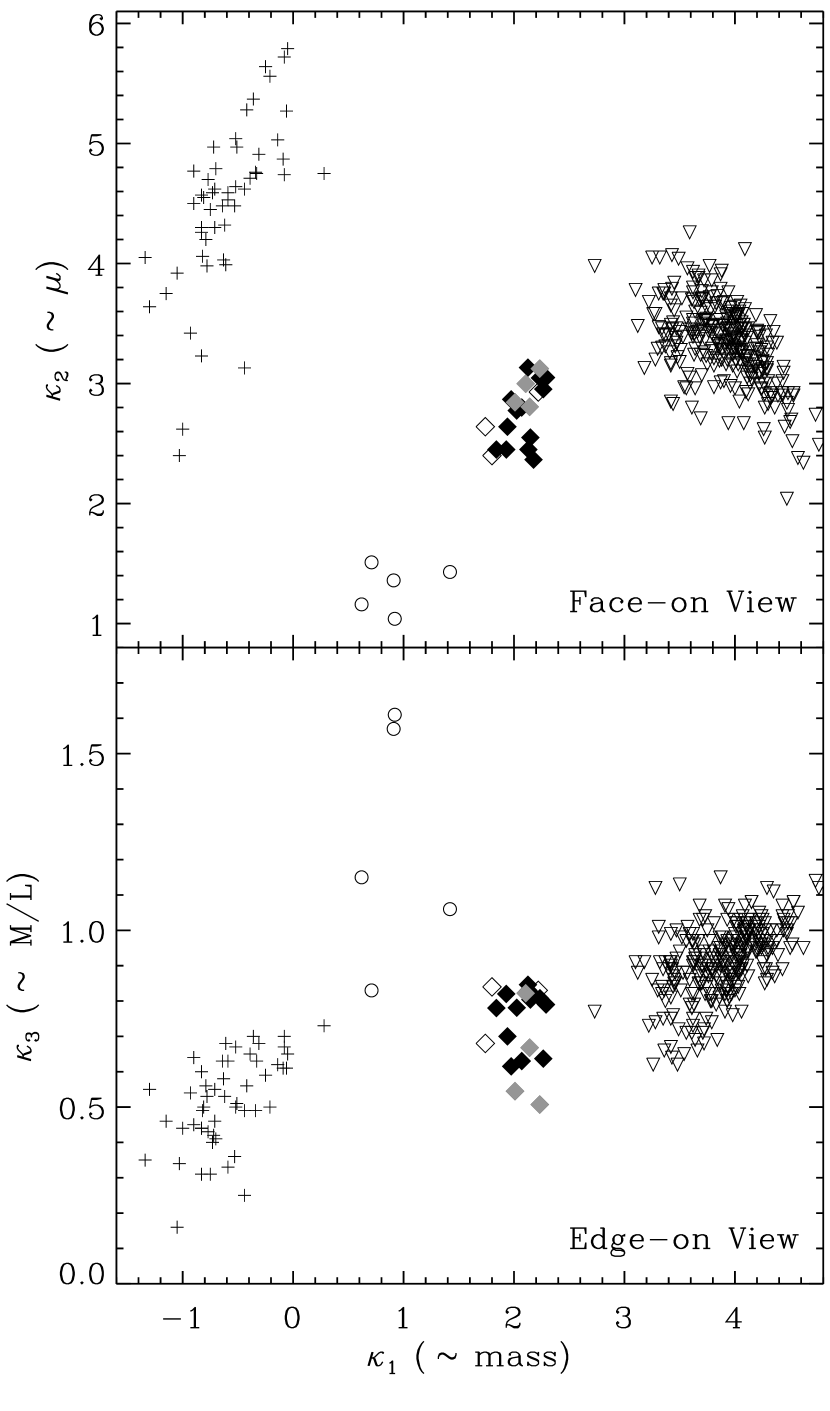
Dwarf elliptical galaxies lie in a region of Fundamental Plane space distinctly different from other stellar systems. This is best illustrated in the -projection of the multivariate space defined by central velocity dispersion, , effective surface brightness, , and effective radius, (Bender et al., 1992). As shown in Figure 5, dEs appear well separated from other stellar systems. Bender et al. (1992) argued that this separation represents a fundamental difference between the galaxy formation processes of dEs and more luminous classical ellipticals (see Guzman et al., 2003, however, for an alternate viewpoint). Here, we are primarily interested in the relative position of our rotating and non-rotating dE galaxies within Fundamental Plane space.
In both panels of Figure 5, the rotating and non-rotating dEs occupy similar regions of the Fundamental Plane. As a statistical comparison, we use the one-dimensional Kolmogorov-Smirnov (K-S) test. This test gives the probability () that the difference between two distributions would be as large as observed if they had been drawn from the same population. Two distributions are considered different if the probability that they are drawn from the same parent distribution can be ruled out at a confidence level greater than 95% (). As an example, the probability that the rotation velocities of our rotating and non-rotating subsamples are drawn from the same parent distribution is 0.3% ( = 0.003); thus this hypothesis can be ruled out at high confidence level. In comparing -values for rotating and non-rotating dEs (listed in Table 3), the relatively high values of the K-S probability, = 0.6, 0.2, and 0.1 for , , and respectively, indicate that we cannot demonstrate that these two samples are drawn from different populations. The rotating dEs appear slightly offset in the direction of higher and values (corresponding to larger mass and surface brightness, respectively), but more data is required to establish such a correlation.
3.3 Morphology
Evidence for underlying disk-like structure has been presented for a handful of cluster dE galaxies based on deep imaging. Five dEs in the Virgo Cluster show evidence for a bar or weak spiral structure (Jerjen et al., 2000; Barazza et al., 2002) and two Fornax Cluster dE/dS0s show evidence for embedded disks (De Rijcke et al., 2003). This accounts for roughly 20% of analyzed images. Two of these galaxies are in our sample: Jerjen et al. discovered faint spiral structure in VCC 856 (IC 3328) implying the presence of a nearly face-on disk, while Barazza et al. presented evidence for an elongated dumbbell-shaped structure along the major axis of VCC 940 (IC 3349). The former galaxy is a rotating dE in our sample, the latter is a non-rotating dE. In view of these results, we analyzed all our dE images to determine the level of substructure present and whether or not this is correlated with the amount of major axis rotation.
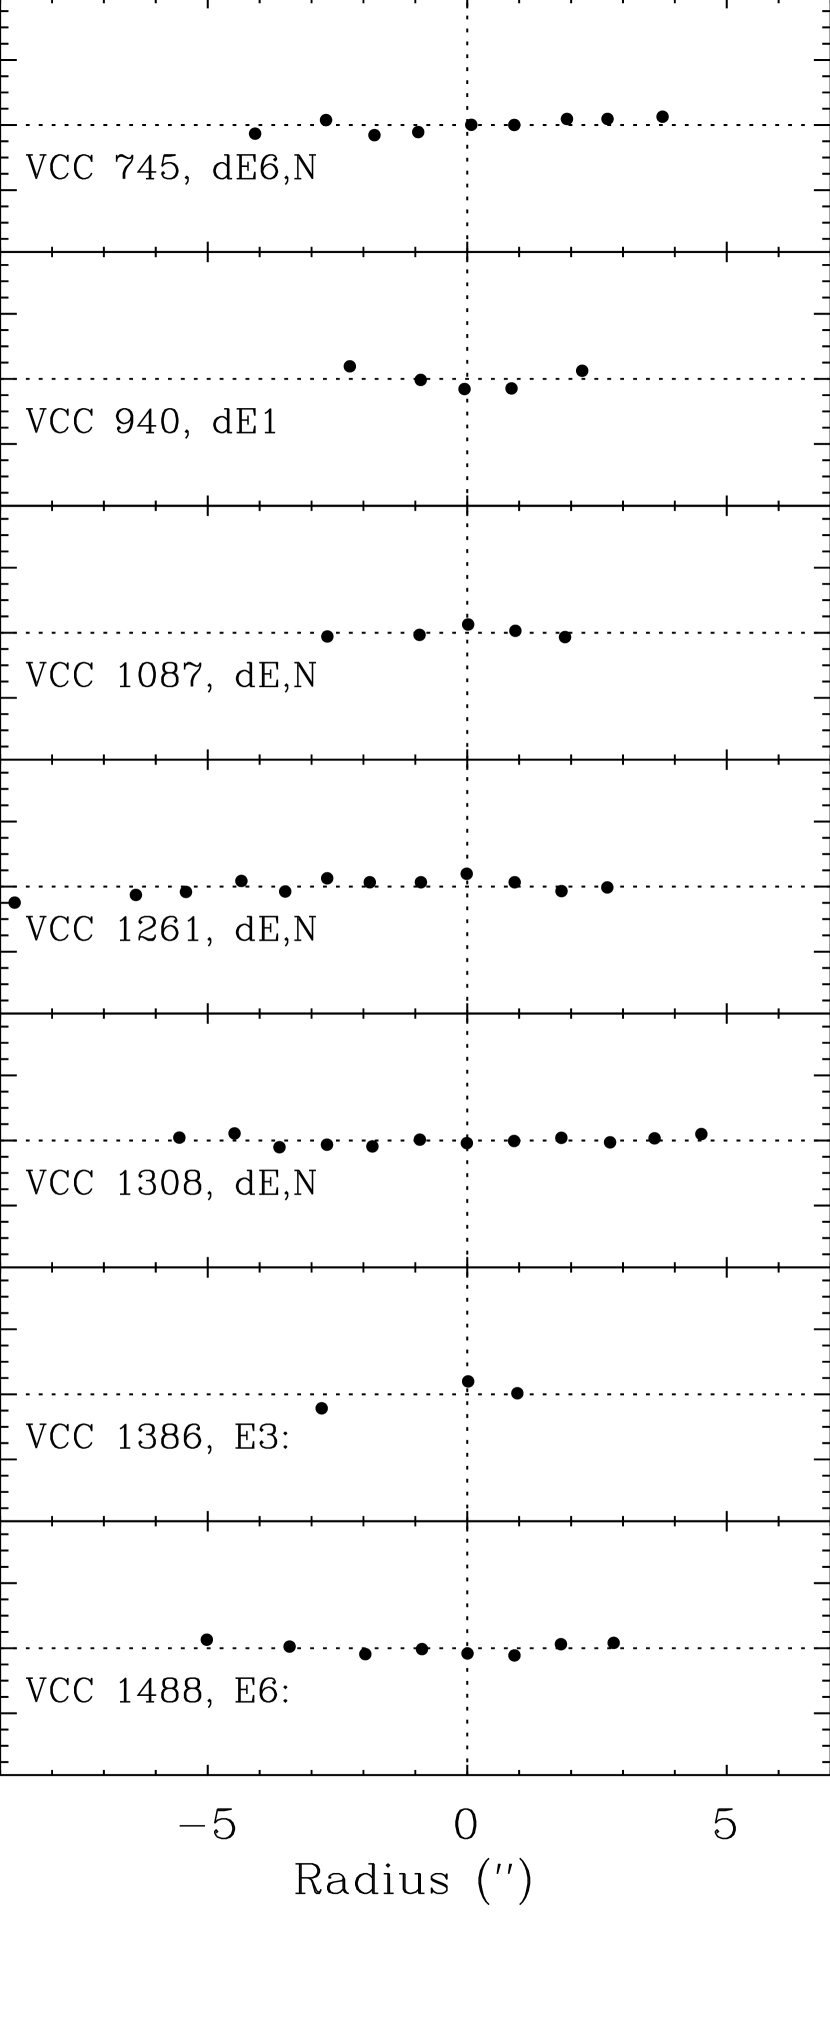
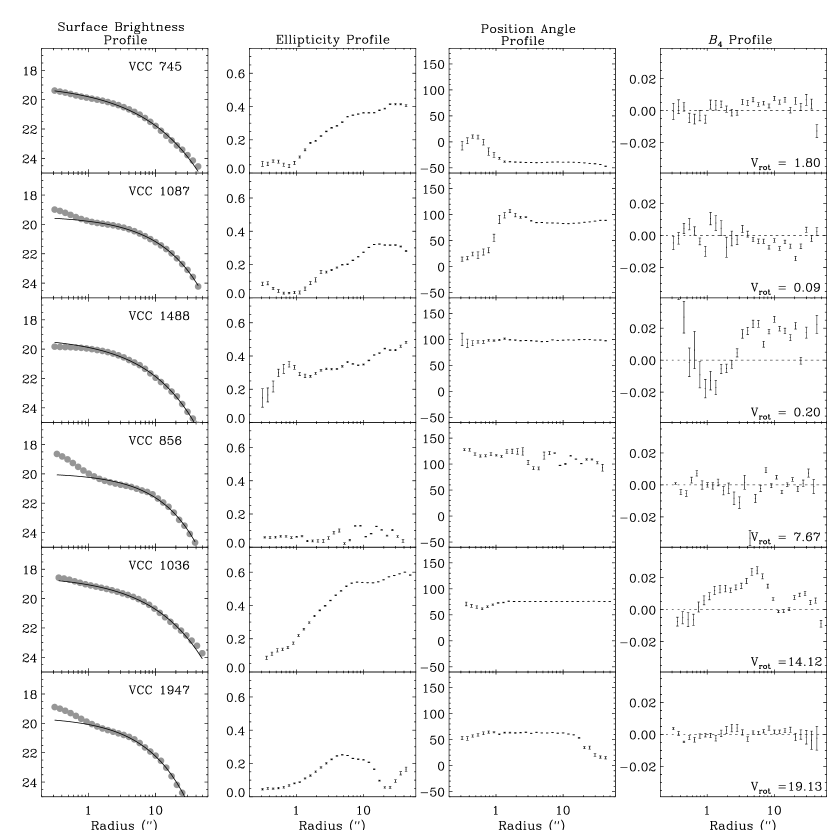
Images of the dE galaxies in our sample appear to be smooth and without obvious signs of substructure, however, detailed analysis is required to detect possible low level substructure. As discussed in § 2.3, we determine surface brightness profiles using the IRAF ELLIPSE isophotal fitting routine. Deviations from the best-fitting ellipse, often an indication of an underlying disk or other substructure, are quantified by expanding the intensity variations along the best-fitting ellipse in a Fourier series as:
| (1) |
The first- and second-order terms () of Eqn. (1) are zero by definition; non-zero values would indicate that the best-fitting ellipse has not been found. For , the quantities
| (2) | |||
| (3) |
measure deviations of the isophote from the best-fitting ellipse, where is the semi-major axis length and the local intensity gradient. The quantity is similar to the quantity used by e.g., Bender, Doebereiner, & Moellenhoff (1988). Positive values indicate disky isophotes whereas negative values indicate boxy isophotes (Jedrzejewski, 1987). In Figure 6, we present surface brightness, ellipticity, position angle, and as a function of radius for those dEs with ESI imaging. We note that in all cases the isophotal ellipticity varies with radius; two galaxies show significant departures from zero in their profiles. For the remaining dEs in our sample for which we have only WFPC2 imaging, we present the averaged ellipticity and measurements in Table 3. We do not present the WFPC2 radial profiles since much of this data has been presented elsewhere (Geha et al., 2002; Stiavelli et al., 2001; Geha, 2003), and because these images are too shallow to meaningfully constrain the amount of substructure present. As an illustration, the existing WFPC2 images do not show detectable substructure in VCC 940; however, as mentioned above, Barazza et al. (2002) present clear evidence for an elongated structure along its major axis from deep ground-based imaging.
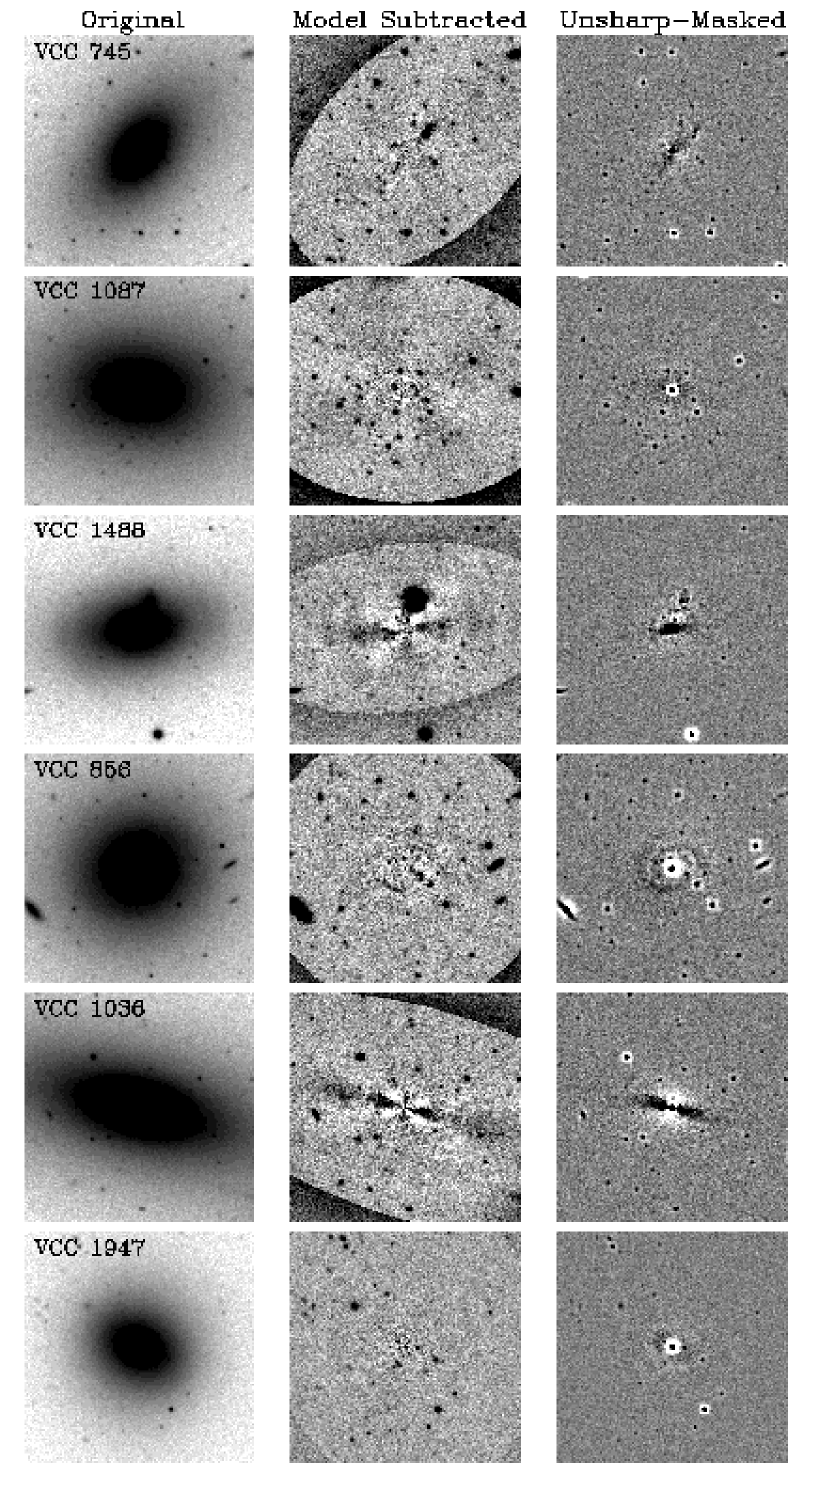
In the first column of Figure 7 we present -band ESI images for the profiles presented in Figure 6. In the second column of this figure we plot the residual image resulting from subtraction of a 2D model based on the ellipse fitting (excluding higher-order components) from the original image. In the third column we present unsharp-masked images created by subtracting a boxcar-smoothed image (with smoothing length) from the original, to highlight high frequency spatial structure. The unsharp-masked images have the advantage of being independent of our ellipse fitting model, but can be difficult to interpret. For example, the “structure” apparent in the unsharp-masked images of VCC 1947 and VCC 745 is due to ellipticity gradients evident in Figure 6; the model-subtracted images of these galaxies in the middle column of Figure 7 show no obvious structure. On the other-hand, the model-subtracted images of two other dEs in Figure 7, VCC 1036 and VCC 1488, do show clear signs of an underlying disk. This is seen in both the unsharp-masked images and the positive profiles in Figure 6. The rotating dE/dS0 VCC 1036 has a strong disk component, while the non-rotating dE VCC 1488 has a weaker underlying disk. Both these disks lie along the major axis defined by the outer isophotes. In addition, we confirm the faint spiral structure in VCC 856 first presented by Jerjen et al. (2000); this is strong evidence for a nearly face-disk. The remaining three dEs do not show any residuals. Most notably, the strongly rotating dE VCC 1947 shows no evidence for a disk component.
In summary, there is evidence for underlying disks and/or substructure in both rotating and non-rotating dEs, but counter examples also exist for both kinematic types which show no evidence of such structure. For the rotating dEs, we present or confirm evidence for underlying disk structure in two dEs, but observe no evidence for any substructure in a third rotating dE. For the non-rotating dEs, we present evidence for a weak disk in one galaxy, in addition to one non-rotating dE with substructure presented in the literature. Two non-rotating dEs show no evidence for underlying structure. For the remaining dEs in our sample, WFPC2 imaging is not deep enough to place limits on the presence of substructure. We conclude that there can be interesting substructure in dEs, but its presence or absence does not appear to be a good indicator of the observed dynamics.
3.4 Line-Strength Indices
We compute line-strength indices according to the Lick/IDS system (Worthey et al., 1994) in the wavelength region . This index system is calibrated to a fixed spectral resolution of . To match indices we must degrade the spectral resolution of our spectra. Although this means sacrificing a wealth of fine structure almost certainly sensitive to stellar populations, higher spectral resolution stellar population models do not yet exist which cover a sufficient range of ages, metallicities and wavelengths. The adopted approach also allows us to compare directly to the measured indices of more luminous elliptical galaxies.
Line-strength indices were computed by first shifting the spectra to rest frame wavelengths and convolving with a wavelength-dependent Gaussian kernel to match the spectral resolution of the Lick/IDS system. Line-strengths were then calculated according to the index definitions of Worthey et al. (1994). The size of the smoothing kernel was determined by matching the measured indices of 16 stars (spectral type F9IV–M0III) observed through the Keck/ESI setup to the values of Worthey et al. (1994). The size of the kernel ranged between (40–45 ESI spectral pixels, Gaussian sigma); the average residual between measured and published indices was . The measured line-strengths for these standard stars are plotted against the published values in Figure 8. Small zero-point corrections due to systematic effects such as sky subtraction and flat fielding errors both in our data and the published systems (Worthey & Ottaviani, 1997) are applied to the measured indices of each galaxy. These corrections were determined from the best fitting offset between our measured standard star indices and the published values assuming a linear relation with unit slope. These corrections are listed in each panel of Figure 8 and range between 0.1 – . We do not correct for line broadening due to the intrinsic velocity dispersion of each dE galaxy as these are much smaller than the Lick/IDS broadening function.
Error bars on the indices were computed via Monte-Carlo simulation. We added noise to a high signal-to-noise template star based on the noise spectrum of each individual galaxy and compute indices with the same procedure described above. Error bars were determined for each index of each galaxy from the rms value after 1000 noise realizations. Error bars include contributions from photon noise, read-out noise and pixel-to-pixel correlations due to Gaussian smoothing.
We present line-strength indices for our Virgo Cluster dE galaxies measured from spectra extracted in a aperture centered on each object. These spectra have signal-to-noise ratios ranging between 50–100 per Å. In Table 4, we list the central line-strength indices and error bars for H, Mgb, Fe5270, and Fe5335 (see Worthey et al. for index definitions). In addition, we list the combined iron index defined as (Fe5270 + Fe5335)/2. Our results for the central regions of VCC 1073 and VCC 543 agree, within the errors, with previously published values of H and (Pedraz et al., 2002). We restrict our line-strength analysis to the central to avoid galaxy light contamination in our sky spectrum. Based on the surface brightness profiles, we estimate the level of this contamination to be a few percent or less in the galaxy center, increasing to in the outer regions. A few percent contamination should not affect the central line-strength values or the kinematic profiles, but could lead to significant errors in the line strengths at large radii where the contamination level is larger.
In Figures 9 and 10, we present line-strength index diagrams comparing the H, Mgb and indices for our dE sample. The majority of dEs are confined to a small region in all three panels with some amount of intrinsic scatter between galaxies. The exception is VCC 1488, a non-rotating galaxy with noted non-axisymmetric features (§ 3.3), which has a significantly higher H measurement. The line-strength indices of the rotating and non-rotating dEs are similarly distributed in each index-index diagrams. Based on the K-S test discussed in § 3.2, we compute the probability that, for each index, the line-strengths of these two populations are drawn from different distributions. The K-S probability is greater than for all our measured indices, meaning the line-strengths of these two samples are statistically consistent with being drawn from a single distribution. We conclude that rotating and non-rotating dEs have similar stellar populations despite very different internal kinematics.
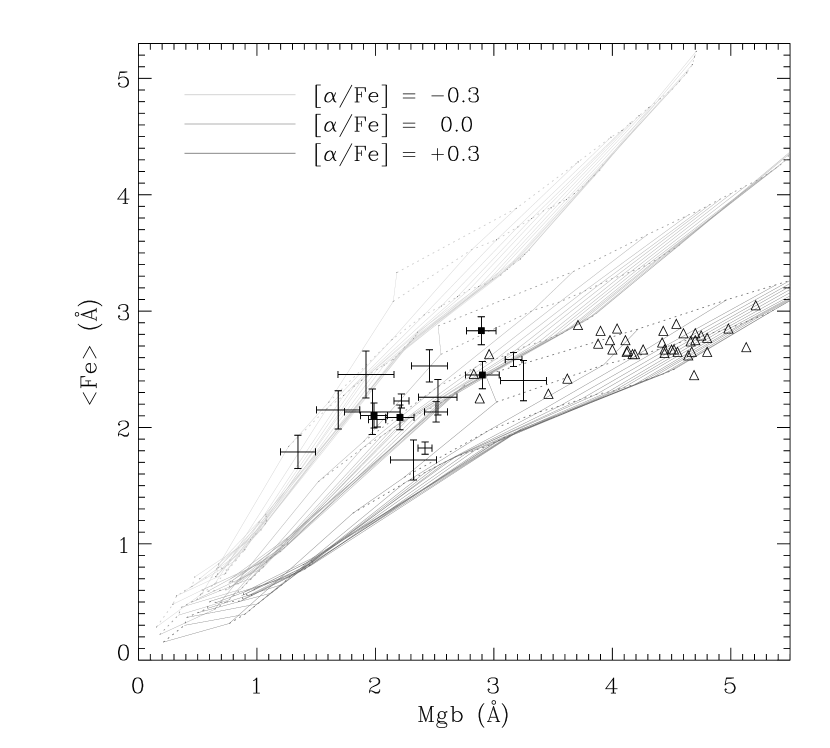
We next compare our dE line-strength indices to the single-burst stellar population models of Thomas, Maraston, & Bender (2002). These models predict line-strength indices for a wide range of metallicities ( dex) and include predictions for both solar and non-solar element abundance ratios. In Figure 9, we investigate the [] ratio of our dE sample by comparing the measured Mgb and indices to model predictions. In this diagram, effects due to age and metallicity are largely degenerate and sensitivity to abundance ratio is maximized. We assume that Mg traces the -elements. The majority of dEs in Figure 9 are consistent with solar abundance ratios, with some scatter towards both the sub- and super-solar abundance ratios between dex which cannot be explained by differences in age and metallicity alone. We again note that the rotating and non-rotating dEs have similar inferred abundance ratios. Gorgas et al. (1997) first suggested that Virgo dEs are consistent with solar abundance ratios based on a smaller dE sample. This is in marked contrast to the sample of classical elliptical galaxies, taken from Trager et al. (2000), also plotted in Figure 9 which have super-solar abundance ratios . This difference in abundance ratios can be interpreted as a difference in the time-scale of star formation: -elements are created rapidly by Type II supernovae while iron is produced by supernovae Type Ia on longer timescales. It can then be argued that the bulk of star formation in classical ellipticals occurred on much shorter timescales as compared to dwarf ellipticals. Our observations are further evidence that dwarf and classical elliptical galaxies have very different star formation histories.
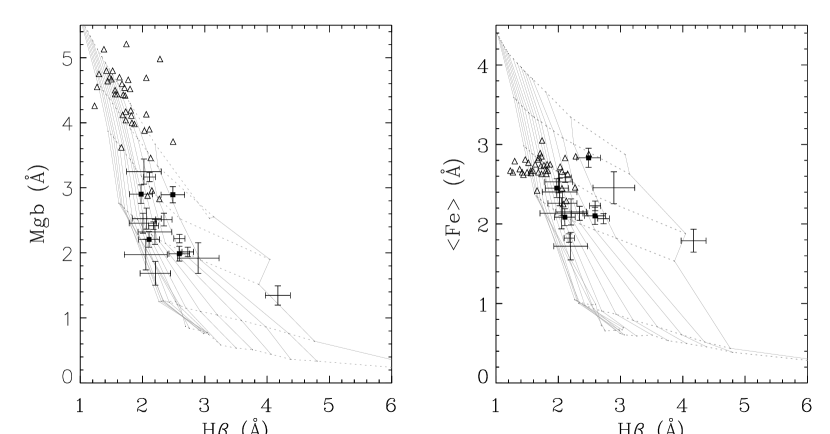
To determine the luminosity-weighted stellar ages and metallicities for our dE sample, we plot the Mgb and indices against H in Figure 10. Note that while conclusions based on relative line-strength differences between dE galaxies are robust, the derived absolute ages and metallicities may be affected by unknown systematic errors. The best fitting age and metallicity was determined for each galaxy by simultaneously minimizing the residuals between the observed line-strengths and the predicted Mgb, , and H indices from the Thomas et al. (2002) solar abundance ratio models. The best fitting age and metallicity for our 17 dE sample are 5 Gyr and dex, with rms spreads of 3 Gyr and 0.1 dex, respectively. This is consistent with the ages and metallicities implied by the dynamically determined -band mass-to-light ratios, , calculated in Geha et al. (2002) for six dEs in the present sample; the single-burst population models of Worthey (1994) predict -band mass-to-light ratios in this range for the ages and metallities stated above. Compared to the Trager et al. sample of classical elliptical galaxies plotted in Figure 10, the average dE in our sample has stronger H indices and weaker Mgb and indices, implying these dEs are younger and more metal poor than a typical classical elliptical galaxy.
Despite the clear separation in the Fundamental Plane (see § 3.2) between dEs and classical elliptical galaxies, Bender, Burstein, & Faber (1993) first noted that the magnesium line-strengths of these two galaxy types follow a tight trend with velocity dispersion. Caldwell, Rose, & Concannon (2003) investigated this correlation for a sample of early-type galaxies which included a much larger number of galaxies with velocity dispersions less than km s-1. They confirm this correlation for Mgb and several other Lick/IDS indices. In addition, the scatter in the line-strengths of H, Mgb, and Fe5270 was found to be in excess of the measurement error for velocity dispersions less than km s-1. In Figure 11, we plot line-strengths as a function of velocity dispersion. We fit a linear relation to the classical elliptical sample of Trager et al. (2000) and compare the result to the positions of the dEs in our sample. The linear fits to classical ellipticals, extrapolated to lower velocity dispersions, are consistent with our measured dE line-strengths. Although the observed scatter for our dE sample is larger than that of the classical ellipticals, our sample size is too small to make a quantitative statement regarding the intrinsic scatter.
4 The Local Environment of Rotating versus Non-Rotating dEs
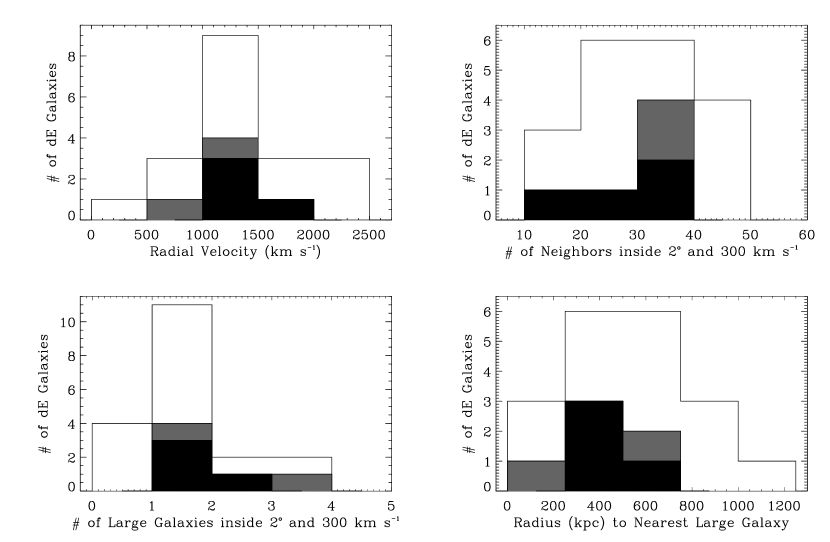
In the above sections we have demonstrated that dEs with and without significant rotation velocities cannot be distinguished based on their internal properties. We next examine whether or not internal rotation is correlated with a dE’s local environment within the Virgo Cluster. As shown in the left panel of Figure 1, rotating and non-rotating dEs are found at varying radii from the center of Virgo. In velocity space (Figure 1, right panels), the non-rotating dEs span the full range of radial velocities found in the Virgo, whereas the rotating dEs appear clustered near the average Virgo radial velocity of km s-1. This is more clearly evident in the first panel of Figure 12. Based on the K-S test discussed in § 3.2, the radial velocity distributions of the rotating versus non-rotating dEs are not significantly different (), although including two additional dEs from the literature (Simien & Prugniel, 2002) makes this difference marginally significant () in the sense that rotating dEs have a narrower range in radial velocities. Conselice et al. (2001) have argued that Virgo Cluster dEs as a population span a much larger range of radial velocities as compared to more luminous classical ellipticals. They interpret this as evidence that dEs are a more recently accreted population. If larger dE samples confirm that rotating dEs span a narrower range of radial velocities compared to non-rotating dEs, this would suggest that their history in the Virgo Cluster is more closely associated with classical elliptical galaxies.
In the remaining panels of Figure 12, we further quantify the local environment of our dE sample by examining neighboring galaxies within (0.5 Mpc) and 300 km s-1 of each dE. These scales were chosen to probe local enhancements within the Virgo Cluster on the scale of small galaxy groups. As a population, Virgo dEs are not preferentially found around larger parent galaxies (Ferguson & Sandage, 1991) in contrast to dEs in the field; local overdensities or proximity to large galaxies would be evidence of recent accretion into the Virgo Cluster from the surrounding field/groups. We compare for the rotating and non-rotating dEs: the number of neighboring galaxies contained within the physical distance and velocity difference stated above, the number of luminous companions () in this same region, and the physical distance to the nearest of these bright galaxies. In all cases, the rotating and non-rotating dEs are similarly distributed based on both inspection of Figure 12 and results of the K-S test. In all three cases the K-S probability is greater than , meaning that the distribution of the two kinematic types in these panels cannot be distinguished. We conclude that internal dE rotation properties are not correlated with proximity to bright galaxies or the local environment within the galaxy cluster.
5 Discussion and Conclusions
We have established that the internal dynamics of dE galaxies span a wide range in rotational support as determined from major axis spectroscopy of 17 dEs in the Virgo Cluster. In our present dE sample, the degree of rotational support does not appear to span a continuous distribution: we observe either dEs with no measurable major axis rotation, or dEs with rotation velocities approaching that expected for a rotationally-flattened object. We therefore have separated our sample into rotating and non-rotating dEs (nominally defined as galaxies with and , respectively) and investigated whether or not other dE properties are correlated with rotation velocity. We show that rotation velocity is not correlated with a dE’s position in the Fundamental Plane, the presence or absence of underlying disks or substructure, absorption-line-strength indices, or local environment.
Currently favored formation models do not naturally predict a dichotomy in the internal dynamics of dE galaxies. One possible explanation for the varying amount of rotational support is different mechanisms for the formation of rotating and non-rotating dEs. Although our observations do not rule out multiple formation mechanisms, they do place very tight constraints on variations in observable properties between the resulting dE populations. In particular, significantly different origins for rotating and non-rotating dEs would need to result in stellar populations that are indistinguishable between the two dE types yet very different from those of more luminous classical ellipticals. It is equally challenging however to produce the range in rotational properties via a single physical process.
Our conclusion that the internal properties and local environments of rotating versus non-rotating cannot be distinguished is limited by the size of our dE sample; increasing the number of dEs, particularly rotating dEs, with spatially-resolved measurements of internal kinematics is an important step towards further understanding the formation of these galaxies. It is equally important to refine the predictions and better understand the limitations of currently proposed dE formation models. For example, does the harassment scenario in which dEs are formed from larger disk galaxies via gravitational interactions produce the observed range of rotational support, and, in particular, can it account for the large fraction of dEs without significant rotation? To what extent do these interactions disrupt the disk of a progenitor galaxy and at what level is substructure predicted in dEs? Similar questions should be asked of any proposed dE formation model. Because dEs are so numerous in nearby galaxy clusters, constraining the formation and evolution of these objects is an important step towards assembling a global picture of galaxy evolution in these regions.
References
- Barazza et al. (2002) Barazza, F. D., Binggeli, B., & Jerjen, H. 2002, A&A, 391, 823
- Bender et al. (1988) Bender, R., Doebereiner, S., & Moellenhoff, C. 1988, A&AS, 74, 385
- Bender et al. (1991) Bender, R., Paquet, A., & Nieto, J.-L. 1991, A&A, 246, 349
- Bender et al. (1992) Bender, R., Burstein, D., & Faber, S. M. 1992, ApJ, 399, 462
- Bender et al. (1993) Bender, R., Burstein, D., & Faber, S. M. 1993, ApJ, 411, 153
- Bingelli et al. (1985) Bingelli, B., Sandage, A., & Tammann, G. A. 1985, AJ, 90, 1681
- Bingelli et al. (1988) Bingelli, B., Sandage, A., & Tammann, G. A. 1988, ARA&A, 26, 509
- Binney & Tremaine (1987) Binney, J., & Tremaine, S. 1987, Galactic Dynamics, Princeton University Press, Princeton
- Bothun & Mould (1988) Bothun, G. D., & Mould, J. R. 1988, ApJ, 324, 123
- Burstein et al. (1997) Burstein, D., Bender, R., Faber, S. M., & Nolthenius, R. 1997, AJ, 114, 1365
- Caldwell et al. (2003) Caldwell, N., Rose, J. A., & Concannon, K. D. 2003, AJ, in press (astro-ph/0303345)
- Conselice et al. (2001) Conselice, C. J., Gallagher, J. S., & Wyse, R. 2001, ApJ, 559, 791
- Dehnen & Gerhard (1994) Dehnen, W., & Gerhard, O. E. 1994, MNRAS, 268, 1019
- De Rijcke et al. (2001) De Rijcke, S., Dejonghe, H., Zeilinger, W. W., & Hau, G. K. T. 2001, ApJ, 559, L21
- De Rijcke et al. (2003) De Rijcke, S., Dejonghe, H., Zeilinger, W. W., & Hau, G. K. T. 2003, A&A, 400, 119
- de Vaucouleurs (1948) de Vaucouleurs, G. 1948, Ann. d’Astrophys., 11, 247
- Faber & Lin (1983) Faber, S. M., & Lin, D. N. C. 1983, ApJ, 266, L17
- Ferguson & Binggeli (1994) Ferguson, H. C., & Binggeli, B. 1994, A&A Rev., 6, 67
- Ferguson & Sandage (1991) Ferguson, H. C., & Sandage, A. 1991, AJ, 101, 765
- Freedman et al. (2001) Freedman, W. L., et al. 2001, ApJ, 553, 47
- Geha et al. (2002) Geha, M., Guhathakurta P., & van der Marel, R. P. 2002, AJ, 124, 3073
- Geha (2003) Geha, M. 2003, Ph.D. thesis, University of California, Santa Cruz
- Gorgas et al. (1997) Gorgas, J., Pedraz, S., Guzman, R., Cardiel, N., & Gonzalez, J. J. 1997, ApJ, 481, L19
- Graham & Guzman (2003) Graham, W. A., & Guzman, R. 2003, AJ, 125, 2936
- Guzman et al. (2003) Guzman, R., Graham, A. W., Matkovic, A., Vass, I., Gorgas, J., & Cardiel, N. 2003, in “Star Formation through Time”, ed. Perez, Gonzalez Delgado, Tenorio-Tagle, in press (astro-ph/0303390)
- Holtzman et al. (1995) Holtzman, J. A., Burrows, C. J., Casertano, S., Hester, J. J., Trauger, J. T., Watson, A. M., & Worthey, G. 1995, PASP, 107, 1065
- Jedrzejewski (1987) Jedrzejewski, R. J. 1987, MNRAS, 226, 747
- Jerjen et al. (2000) Jerjen, H., Kalnajs, A., & Binggeli, B. 2000, A&A, 358, 845
- Kormendy (1985) Kormendy, J. 1985, ApJ, 295, 73
- Miller et al. (1998) Miller, B. W., Lotz, J. M., Ferguson, H. C., Stiavelli, M., & Whitmore, B. C. 1998, ApJ, 508, L133
- Moore et al. (1998) Moore, B., Lake, G., & Katz, N. 1998, ApJ, 495, 139
- Pedraz et al. (2002) Pedraz, S., Gorgas, J., Cardiel, N., Sanchez-Blazquez, P., & Guzman, R. 2002, MNRAS, 332, L59
- Peterson & Caldwell (1993) Peterson, R. C., & Caldwell, N. 1993, AJ, 105, 1411
- Prugniel & Heraudeau (1998) Prugniel, Ph., & Heraudeau, P. 1998, A&AS, 128, 229
- Rest et al. (2001) Rest, A., et al. 2001, AJ, 121, 2431
- Schlegel et al. (1998) Schlegel, D. J., Finkbeiner, D. P., & Davis, M. 1998, ApJ, 500, 525
- Sérsic (1968) Sérsic, J. L. 1968, Atlas de Galaxias Australes (Córdoba: Obs. Astron., Univ. Nac. Córdoba)
- Sheinis et al. (2002) Sheinis, A. I., Bolte, M., Epps, H. W., Kibrick, R. I., Miller, J. S., Radovan M. V., Bigelow, B. C., & Sutin, B. M. 2002, PASP, 114, 851
- Simien & Prugniel (2002) Simien, F., & Prugniel, Ph. 2002, A&A, 384, 371
- Stiavelli et al. (2001) Stiavelli, M., Miller, B. W., Ferguson, H. C., Mack, J., Whitmore, B. C., & Lotz, J. M. 2001, AJ, 121, 1385
- Thomas et al. (2002) Thomas, D., Maraston, C., & Bender, R. 2003, MNRAS, 339, 897
- Trager et al. (2000) Trager, S. C., Faber, S. M., Worthey, G., & González, J. J. 2000, AJ, 119, 1645
- Trentham & Tully (2002) Trentham, N., & Tully, R. B. 2002, MNRAS, 335, 712
- van der Marel (1994) van der Marel, R. P. 1994, MNRAS, 270, 271
- Worthey et al. (1994) Worthey, G., Faber, S. M., González, J. J., & Burstein, D. 1994, ApJS, 94, 687
- Worthey (1994) Worthey, G. 1994, ApJS, 95, 107
- Worthey & Ottaviani (1997) Worthey, G., & Ottaviani, D. L. 1997, ApJS, 111, 377
| Galaxy | (J2000) | (J2000) | Type | Ref | |||||
|---|---|---|---|---|---|---|---|---|---|
| (h : m : s) | (::) | ( km s-1) | ( km s-1) | ( km s-1) | |||||
| Non-Rotating Dwarf Elliptical Galaxies | |||||||||
| VCC 452 | 12:21:04.7 | 11:45:18 | dE4N | 15.34 | 1380 | 1 | |||
| VCC 745/NGC 4366 | 12:24:47.0 | 07:21:10 | dE6N | 14.74 | 1234 | 2 | |||
| VCC 917/IC 3344 | 12:26:32.4 | 13:34:43 | dE6 | 13.93 | 1186 | 1 | |||
| VCC 940/IC 3349 | 12:26:47.1 | 12:27:15 | dE1N | 14.83 | 1563 | 1 | |||
| VCC 1073/IC 794 | 12:28:08.6 | 12:05:36 | dE3N | 13.84 | 1862 | 2,3 | |||
| VCC 1087/IC 3381 | 12:28:15.1 | 11:47:23 | dE3N | 14.33 | 650 | 1,4 | |||
| VCC 1254 | 12:30:05.3 | 08:04:29 | dE0N | 14.58 | 1220 | 2 | |||
| VCC 1261/NGC 4482 | 12:30:10.4 | 10:46:46 | dE5N | 13.61 | 1845 | 1,4 | |||
| VCC 1308/IC 3437 | 12:30:45.8 | 11:20:34 | dE6N | 15.42 | 1779 | 1 | |||
| VCC 1386/IC 3457 | 12:31:51.3 | 12:39:21 | E3:N | 14.65 | 1150 | 1 | |||
| VCC 1488/IC 3487 | 12:33:13.4 | 09:23:50 | E6:aaAlthough Bingelli et al. (1985) classify VCC 1488 as an “E6:”, its nearly exponential surface brightness profile and position in the Fundamental Plane suggest the correct classification is dE. | 14.78 | 1157 | 1 | |||
| VCC 1577/IC 3519 | 12:34:38.4 | 15:36:10 | dE4 | 15.24 | 361 | 2 | |||
| VCC 1876/IC 3658 | 12:41:20.4 | 14:42:02 | dE5N | 14.64 | 95 | 2 | |||
| Rotating Dwarf Elliptical Galaxies | |||||||||
| VCC 543/UGC 7436 | 12:22:19.5 | 14:45:39 | dE5 | 14.58 | 923 | 1,3,4 | |||
| VCC 856/IC 3328 | 12:25:57.8 | 10:03:13 | dE1N | 14.33 | 1014 | 1,4 | |||
| VCC 1036/NGC 4436 | 12:27:41.6 | 12:18:59 | dE6/dS0N | 13.93 | 1324 | 1,4 | |||
| VCC 1947 | 12:42:56.3 | 03:40:35 | dE2N | 14.58 | 1083 | 1 | |||
Note. — Galaxy classifications are taken from Bingelli et al. (1985); object types including “:” indicate uncertainty in the classification. Apparent and absolute magnitudes are determined inside an aperture. The absolute magnitude, , assumes a Virgo Cluster distance modulus of and is corrected for foreground dust extinction according to Schlegel et al. (1998). The heliocentric systemic velocity is determined from the mean of each velocity profile. The rotation speed and associated error bar are determined as described in § 3.1. The average line-of-sight velocity dispersion is determined for to avoid nuclear contamination if present. The final column refers to published kinematic observations as follows: 1 = this paper, 2 = Geha et al. (2002), 3 = Pedraz et al. (2002), and 4 = Simien & Prugniel (2002).
| Galaxy | Exposure Time | PAslit | Seeing FWHM |
|---|---|---|---|
| (s) | (∘) | (′′) | |
| VCC 543 | 1800 | 0.9 | |
| VCC 745 | 1600 | 45 | 0.8 |
| VCC 856 | 1500 | 80 | 0.7 |
| VCC 940 | 3600 | 0 | 0.7 |
| VCC 1036 | 900 | 0.8 | |
| VCC 1087 | 1500 | 0.8 | |
| VCC 1261 | 2700 | 0.8 | |
| VCC 1308 | 3600 | 60 | 0.7 |
| VCC 1386 | 3600 | 0.9 | |
| VCC 1488 | 1500 | 80 | 0.7 |
| VCC 1947 | 900 | 0.8 |
Note. — Exposure time, slit position angle and seeing FWHM for the eleven dEs whose Keck/ESI kinematics are presented in this paper. The slit was placed on the major axis of each galaxy. Seeing FWHMs were determined from guider camera images taken simultaneously with the observations.
| Galaxy | Imaging | ||||||||
|---|---|---|---|---|---|---|---|---|---|
| [′′ (kpc)] | (mag arcsec-2) | ||||||||
| Non-Rotating Dwarf Elliptical Galaxies | |||||||||
| VCC 452 | WFPC2 | 0.15 | 1.6 | 9.6 (0.71) | 22.3 | 1.84 | 2.45 | 0.78 | |
| VCC 745/NGC 4366 | ESI | 0.33 | 1.5 | 10.0 (0.74) | 21.1 | 2.24 | 3.05 | 0.81 | |
| VCC 917/IC 3344 | WFPC2 | 0.42 | 2.9 | 12.2 (0.90) | 21.4 | 2.07 | 2.80 | 0.63 | |
| VCC 940/IC 3349 | WFPC2 | 0.07 | 1.3 | 13.9 (1.03) | 22.2 | 2.15 | 2.55 | 0.80 | |
| VCC 1073/IC 794 | WFPC2 | 0.20 | 1.9 | 11.1 (0.82) | 21.1 | 2.29 | 3.05 | 0.79 | |
| VCC 1087/IC 3381 | ESI | 0.26 | 1.4 | 14.4 (1.07) | 21.1 | 2.26 | 2.95 | 0.64 | |
| VCC 1254 | WFPC2 | 0.07 | 2.9 | 14.4 (1.07) | 22.4 | 2.13 | 2.45 | 0.83 | |
| VCC 1261/NGC 4482 | WFPC2 | 0.26 | 1.9 | 7.3 (0.54) | 21.0 | 2.13 | 3.13 | 0.85 | |
| VCC 1308/IC 3437 | WFPC2 | 0.23 | 1.3 | 9.5 (0.70) | 21.7 | 2.02 | 2.77 | 0.78 | |
| VCC 1386/IC 3457 | WFPC2 | 0.21 | 1.3 | 17.1 (1.27) | 22.5 | 2.18 | 2.37 | 0.81 | |
| VCC 1488/IC 3487 | ESI | 0.38 | 1.6 | 10.0 (0.74) | 21.2 | 1.97 | 2.87 | 0.62 | |
| VCC 1577/IC 3519 | WFPC2 | 0.41 | 1.1 | 10.5 (0.78) | 22.4 | 1.93 | 2.45 | 0.82 | |
| VCC 1876/IC 3658 | WFPC2 | 0.45 | 0.8 | 10.5 (0.78) | 21.8 | 1.94 | 2.64 | 0.70 | |
| Rotating Dwarf Elliptical Galaxies | |||||||||
| VCC 543/UGC 7436 | WFPC2 | 0.46 | 1.4 | 11.9 (0.88) | 21.2 | 2.01 | 2.84 | 0.54 | |
| VCC 856/IC 3328 | ESI | 0.09 | 1.6 | 13.0 (0.96) | 21.4 | 2.14 | 2.81 | 0.67 | |
| VCC 1036/NGC 4436 | ESI | 0.54 | 1.5 | 13.8 (1.02) | 20.6 | 2.23 | 3.12 | 0.51 | |
| VCC 1947 | ESI | 0.19 | 1.3 | 8.3 (0.62) | 21.3 | 2.11 | 3.00 | 0.82 | |
Note. — The second column refers to the source of our imaging (HST/WFPC2 or Keck/ESI). The ellipticity is the average measured between . The Sérsic index , effective (half-light) radius , and effective surface brightness are determined by fitting a Sérsic model to the galaxy surface brightness profile outside where the radius is measured along the major axis. The Fundamental Plane parameters , , and were determined from quantities in this table and Table 1 according to the definitions of Bender et al. (1992). The -values are defined in the -band, and we assume = 0.8 in calculating these parameters. The last column lists the disky/boxy parameter (expressed as a percentage) discussed in § 3.3 determined over the radial range .
| Galaxy | H | Mgb | Fe5270 | Fe5335 | |
|---|---|---|---|---|---|
| (Å) | (Å) | (Å) | (Å) | (Å) | |
| Non-Rotating Dwarf Elliptical Galaxies | |||||
| VCC 452 | |||||
| VCC 745 | |||||
| VCC 917 | |||||
| VCC 940 | |||||
| VCC 1073 | |||||
| VCC 1087 | |||||
| VCC 1254 | |||||
| VCC 1261 | |||||
| VCC 1308 | |||||
| VCC 1386 | |||||
| VCC 1488 | |||||
| VCC 1577 | |||||
| VCC 1876 | |||||
| Rotating Dwarf Elliptical Galaxies | |||||
| VCC 543 | |||||
| VCC 856 | |||||
| VCC 1036 | |||||
| VCC 1947 | |||||