The AGN content of the z=0.83 cluster MS1054-0321
Abstract
We present a survey of X-ray point sources in a 91 ksec Chandra ACIS-S observation of the z=0.83 cluster MS1054-0321. We detect 47 X-ray sources within the field, of which two are immediately confirmed from pre-existing spectroscopy to be at the redshift of the cluster. At fluxes brighter than erg s-1 cm-2 we find a excess compared to predictions from field surveys, consistent with an excess of approximately AGN. If these sources are associated with the cluster, they too are AGN with luminosities of order erg s-1. Combined with the identification of 7 cluster AGN from deep radio observations (Best et al. 2002), these observations suggest significantly enhanced AGN activity in MS1054-03 compared to local galaxy clusters. Interestingly, the excess of X-ray detected AGN is found at radial distances of between 1 and 2 Mpc, suggesting they may be associated with infalling galaxies. The radio AGN are seen within the inner Mpc of the cluster and are largely undetected in the X-ray, suggesting they are either intrinsically less luminous and/or heavily obscured.
keywords:
1 Introduction
Optical studies suggest that active nuclei are relatively rare in cluster environments. Surveying low redshift () cluster fields, Dressler et al. (1985) found only 1% of cluster members showed evidence for AGN activity in their optical spectra. A subsequent study of several distant clusters revealed no increase in the cluster AGN fraction to (Dressler et al. 1999). Recently, however, surveys of cluster fields at X-ray wavelengths are uncovering surprisingly large numbers of point sources, many of which are confirmed to be cluster AGN.
X-ray surveys of point sources within cluster fields have been hindered by the high levels of soft X-ray flux from the hot intra-cluster medium and by the traditionally poor angular resolution of X-ray telescopes. The current generation of X-ray observatories, however, offer unprecedented resolution and positional accuracy, as well as high sensitivity over the full X-ray band. Furthermore, multi-scale wavelet detection techniques (e.g. Freeman et al. 2000) can now reliably separate small-scale point source emission from surrounding larger-scale diffuse cluster emission. Consequently, several studies of point sources serendipitously observed in pointed cluster observations have recently been published, nearly all of which report an excess of point sources in these fields.
At low redshift, the excess of X-ray sources seems to be largely due to low luminosity AGN (LLAGN) associated with the cluster. Lazzati et al. (1998), using a wavelet detection algorithm on ROSAT PSPC data, examined the fields of A194 () and A1367 () and found 26 and 28 sources, respectively, where only 9 were expected. Sun and Murray (2002) reobserved A1367 with Chandra and resolved 59 point-like sources, 8 of which are confirmed cluster members. The identified sources, with typical X-ray luminosities of a few erg s-1, have spectra consistent with radiation from central nuclei, thermal halos, and stellar components. In addition to these identified objects, a 2.5 excess in source counts at bright fluxes is found in both hard and soft bands. If these unidentified sources are also associated with the cluster, they have X-ray luminosities consistent with LLAGN and unusually low optical luminosities. A similar, though slightly more X-ray luminous population was reported in A2256 () by Henry & Briel (1991), who found twice as many sources in a ROSAT PSPC observation than were expected for a blank field. Among these sources, they noted two cluster member AGN with erg s-1, as well as a number of optically ‘dark’ objects with comparable X-ray fluxes.
At higher redshifts, more luminous AGN are found in several clusters. In the field of A2104 (), Martini et al. (2002) find that all X-ray sources with optical counterparts brighter than R=20 and B-R colors consistent with the cluster sequence are indeed AGN in the cluster, with ranging from 1041-45 erg s-1. Only one of the six has spectral characteristics which would have led to it being optically identified as an AGN. The AGN hosts in A2104 are photometrically and spectroscopically similar to old, red galaxies, but have a higher velocity dispersion than non-AGN cluster members, suggesting some may be falling into the cluster for the first time. Cappi et al. (2001) identify X-ray source excesses in 3C295 () and RXJ0030 () at fluxes consistent with luminosities at the cluster redshift of 1042-43 erg s-1, and both are found to contain spectroscopically confirmed cluster AGN. Finally, Pentericci et al. (2002) report the association of 2, and possible association of as many as 6, AGN with L erg s-1 in a protocluster around the radio galaxy MRC 1138-262.
Not all moderate to high redshift clusters contain luminous AGN, however. Molnar et al. (2002) found an excess of sources around A1995 () at fluxes consistent with starburst luminosities at the cluster redshift. They also surveyed MS0451 () and found no evidence for an excess of sources. This is not inconsistent with MS0451 housing a population similar to that seen in A1995, which would be too faint to observe in the more distant cluster, but it does rule out a population of more luminous sources such as those seen in 3C295 and RXJ003. They conclude that not all clusters exhibit source excesses at these flux levels, and suggest that different types of sources appear to dominate in different clusters.
As part of a programme to investigate the prevalence of AGN activity in galaxies as a function of redshift and dynamical state, we present X-ray observations of one of the most distant known galaxy clusters. At , MS1054-03 is a well studied, rich (Abell class 3) cluster with a bolometric erg s-1. It was the most distant cluster in the Einstein Medium Sensitivity Survey X-ray selected cluster sample (Gioia et al. 1990) and has been the subject of an extensive observing campaign yielding a Hubble Space Telescope (HST) mosaic (van Dokkum et al. 2000), deep ground-based infrared and optical imaging (Franx et al. in prep), and Keck spectroscopy (van Dokkum et al. 2000). Substantial substructure in the distribution of galaxies is matched by the diffuse soft X-ray emission, and weak-lensing analysis indicates that the cluster is young, massive, and still relaxing (Hoekstra, Franx, & Kuijken 2000). Though the Butcher-Oemler fraction, , is fairly low for this redshift, the fraction of early-type galaxies in the central regions of the cluster (44%) is quite low and the fraction of merging systems (17%) is quite high (van Dokkum et al. 2000). Extremely deep radio observations at 5 GHz have revealed 6, and possibly 7, radio-loud AGN associated with the cluster (Best et al. 2002; see §4.3). To probe the AGN content in the X-rays, we analyze a 91 ksec Chandra exposure of the field obtained by Jeltema et al.(2001).
§2 describes the compilation of the X-ray sourcelist and the identification of optical counterparts. In §3, the X-ray number counts in the MS1054-03 field are derived and the excess over the expected counts in a ‘blank field’ is identified. Possible reasons for the excess are discussed in §4, along with its relation to the radio source excess observed by Best et al. (2002). Finally, we summarize our conclusions in §5. Throughout the paper, we assume an , , and H0 = 70 km s-1 Mpc-1 cosmology.
2 X-ray sourcelist
| ID | Name | RA | Dec | Err | Net | Source | 0.5 - 8 keV Flux | Hardness |
|---|---|---|---|---|---|---|---|---|
| (CXOU) | (J2000) | (J2000) | (arcsec) | Counts | Significance | ( erg cm-2 s-1) | Ratio | |
| 1 | 105658.8-033850 | 10:56:58.82 | -03:38:50.7 | 0.50 | 442.9 | 111.7 | 3.580.17 | -0.360.04 |
| 2 | 105710.4-034013 | 10:57:10.49 | -03:40:13.9 | 0.50 | 302.8 | 88.3 | 2.460.14 | -0.570.05 |
| 3 | 105655.6-034029 | 10:56:55.65 | -03:40:29.4 | 0.50 | 273.1 | 86.7 | 2.180.13 | -0.590.05 |
| 4 | 105646.3-034023 | 10:56:46.31 | -03:40:23.3 | 0.50 | 251.4 | 71.7 | 2.140.13 | -0.300.06 |
| 5 | 105646.5-033905 | 10:56:46.56 | -03:39:05.7 | 0.50 | 199.4 | 64.9 | 1.640.11 | -0.500.06 |
| 6 | 105650.6-033509 | 10:56:50.66 | -03:35:09.1 | 0.51 | 163.0 | 45.5 | 1.310.10 | -0.770.05 |
| 7 | 105710.6-033500 | 10:57:10.65 | -03:35:00.9 | 0.53 | 176.8 | 34.6 | 1.450.11 | -0.790.05 |
| 8 | 105705.1-033541 | 10:57:05.11 | -03:35:41.9 | 0.52 | 125.2 | 33.5 | 1.000.09 | -0.570.07 |
| 9 | 105708.4-033611 | 10:57:08.48 | -03:36:11.5 | 0.52 | 115.5 | 31.3 | 0.920.08 | -0.520.08 |
| 10 | 105646.9-033510 | 10:56:46.95 | -03:35:10.6 | 0.52 | 112.7 | 30.9 | 0.910.08 | -0.930.03 |
| 11 | 105714.1-033348 | 10:57:14.14 | -03:33:48.5 | 0.56 | 185.7 | 30.4 | 1.640.12 | -0.530.06 |
| 12 | 105705.5-033550 | 10:57:05.52 | -03:35:50.5 | 0.52 | 84.9 | 23.5 | 0.670.07 | -0.580.09 |
| 13 | 105700.0-033446 | 10:57:00.05 | -03:34:46.4 | 0.54 | 69.9 | 19.3 | 0.580.07 | -0.500.10 |
| 14 | 105641.4-033853 | 10:56:41.40 | -03:38:53.7 | 0.53 | 59.0 | 18.7 | 0.490.06 | -0.350.12 |
| 15 | 105650.0-033343 | 10:56:50.03 | -03:33:43.8 | 0.57 | 85.2 | 18.2 | 0.720.08 | -0.560.09 |
| 16 | 105707.6-034147 | 10:57:07.61 | -03:41:47.1 | 0.53 | 48.7 | 17.8 | 0.780.11 | -0.500.12 |
| 17 | 105708.1-033940 | 10:57:08.14 | -03:39:40.0 | 0.52 | 48.4 | 17.1 | 0.400.06 | -0.490.13 |
| 18 | 105648.8-033726 | 10:56:48.90 | -03:37:26.0 | 0.52 | 48.6 | 16.1 | 0.390.05 | -0.640.11 |
| 19 | 105702.7-033943 | 10:57:02.73 | -03:39:43.4 | 0.51 | 36.5 | 13.1 | 0.280.04 | 0.080.17 |
| 20 | 105652.6-033819 | 10:56:52.67 | -03:38:19.8 | 0.51 | 36.4 | 12.8 | 0.290.05 | -0.440.15 |
| 21 | 105643.8-033829 | 10:56:43.81 | -03:38:29.8 | 0.54 | 32.5 | 10.7 | 0.270.04 | 0.100.17 |
| 22 | 105705.4-033433 | 10:57:05.48 | -03:34:33.6 | 0.57 | 33.9 | 10.6 | 0.280.05 | -0.480.14 |
| 23 | 105650.8-033504 | 10:56:50.90 | -03:35:04.8 | 0.57 | 22.5 | 7.4 | 0.180.04 | -0.460.20 |
| 24 | 105713.0-033528 | 10:57:13.04 | -03:35:28.3 | 0.74 | 27.9 | 7.3 | 0.230.04 | -0.470.18 |
| 25 | 105715.6-033502111CXOU105715.7-033502 and CXOU105715.7-033506 are resolved by WAVDETECT as two separate detections in the full band, but are detected as a single source in the soft band. | 10:57:15.65 | -03:35:02.2 | 0.60 | 22.3 | 7.2 | 0.180.04 | -0.550.16 |
| 26 | 105715.7-033506a | 10:57:15.72 | -03:35:06.5 | 0.63 | 20.7 | 6.4 | 0.170.04 | -0.470.17 |
| 27 | 105644.4-033807 | 10:56:44.40 | -03:38:07.3 | 0.54 | 15.8 | 5.8 | 0.130.03 | 0.320.24 |
| 28 | 105651.4-033800 | 10:56:51.46 | -03:38:00.5 | 0.53 | 15.1 | 5.7 | 0.120.03 | -0.770.16 |
| 29 | 105704.9-033820 | 10:57:04.92 | -03:38:20.7 | 0.57 | 17.5 | 5.7 | 0.140.03 | 0.670.18 |
| 30 | 105656.3-033636 | 10:56:56.33 | -03:36:36.5 | 0.54 | 16.4 | 5.3 | 0.130.03 | -0.250.23 |
| 31 | 105704.8-034053 | 10:57:04.86 | -03:40:53.8 | 0.56 | 13.7 | 5.0 | 0.110.03 | 0.110.26 |
| 32 | 105702.4-033337 | 10:57:02.42 | -03:33:37.8 | 0.63 | 14.7 | 4.9 | 0.120.03 | 0.050.25 |
| 33 | 105643.7-033733 | 10:56:43.77 | -03:37:33.1 | 0.58 | 13.5 | 4.8 | 0.110.03 | -0.140.27 |
| 34 | 105647.9-033401 | 10:56:47.96 | -03:34:01.9 | 0.66 | 17.2 | 4.8 | 0.140.04 | 0.420.23 |
| 35 | 105649.0-033833 | 10:56:49.00 | -03:38:33.5 | 0.54 | 10.6 | 4.3 | 0.080.02 | -0.550.25 |
| 36 | 105647.7-034002 | 10:56:47.73 | -03:40:02.6 | 0.61 | 12.3 | 4.3 | 0.100.03 | -0.170.29 |
| 37 | 105710.5-033611 | 10:57:10.58 | -03:36:11.6 | 0.58 | 10.4 | 4.1 | 0.080.02 | -0.200.31 |
| 38 | 105648.5-033324 | 10:56:48.56 | -03:33:24.8 | 0.64 | 12.3 | 3.9 | 0.100.03 | 1.000.00 |
| 39 | 105651.9-033623 | 10:56:51.96 | -03:36:23.4 | 0.60 | 10.7 | 3.9 | 0.080.02 | -0.440.27 |
| 40 | 105649.6-033452 | 10:56:49.64 | -03:34:52.7 | 0.59 | 10.6 | 3.8 | 0.080.02 | -0.210.31 |
| 41 | 105645.2-033609 | 10:56:45.21 | -03:36:09.9 | 0.62 | 10.0 | 3.8 | 0.080.03 | 0.170.30 |
| 42 | 105700.3-033649 | 10:57:00.32 | -03:36:49.6 | 0.55 | 12.9 | 3.7 | 0.100.03 | 0.520.25 |
| 43 | 105702.2-034059 | 10:57:02.26 | -03:40:59.5 | 0.53 | 8.8 | 3.6 | 0.070.02 | -0.410.30 |
| 44 | 105652.9-033336 | 10:56:52.97 | -03:33:36.3 | 0.68 | 10.2 | 3.3 | 0.080.03 | -0.330.30 |
| 45 | 105705.5-033850 | 10:57:05.56 | -03:38:50.0 | 0.60 | 8.3 | 3.2 | 0.060.02 | 0.640.26 |
| 46 | 105706.2-034016 | 10:57:06.24 | -03:40:16.0 | 0.59 | 7.6 | 3.1 | 0.060.02 | 0.850.18 |
| 47 | 105656.3-033929 | 10:56:56.30 | -03:39:29.1 | 0.54 | 7.5 | 3.0 | 0.060.02 | 0.170.35 |
Our analysis uses an archival 91 ksec exposure of MS1054-03 taken with the back-illuminated Chandra ACIS-S3 detector on 2000 April 21-22, and first published in Jeltema et al. (2001). We reduced the data with standard CIAO tools, using CALDB version 2.1 which includes an improved ACIS-S3 gain map. There were three periods of significant background flaring during the integration which we excluded, leaving a useable exposure of 74 ksec. The data were filtered by pulse height energy into soft (0.5 - 2 keV), hard (2 - 8 keV), and full (0.5 - 8 keV) bands. Exposure maps were made in each band to estimate variation in effective exposure across the sky due to instrumental effects and source dither. These maps are energy dependent, and were made assuming a power-law spectrum with a photon index = 1.7, typical of unobscured AGN at our flux limit ( erg s-1 cm-2; see Figure 3 of Tozzi et al. 2001). The WAVDETECT source detection algorithm (Freeman et al. 2000) was used to construct independent point source lists in each band. A significance threshold of was used, corresponding to an average detection of less than one false source over the area of a single, full-resolution ACIS chip. We further limited our source lists by rejecting sources with a WAVDETECT source significance parameter of less than 3.0. Though this cut-off is arbitrary - the few sources with lower values may be real - visual inspection suggests it is a reasonable, conservative limit and its definition in terms of this parameter is computationally convenient. We find 47 sources in the full band, 33 in the soft band, and 24 in the hard band. Excepting a soft band only detection of a peak in the cluster emission, there are no soft or hard band detections which are not also full band detections. We will use only the full band source list in the rest of this analysis, and fluxes and luminosities are quoted for the observed 0.5 - 8 keV band.
We used the Starlink ASTROM package to astrometrically correct the X-ray source positions. AGN with accurately known coordinates in the optical and/or radio were aligned with their Chandra counterparts in a 6-parameter fit. Eleven sources were used in total, and achieved a good coverage of the chip. The RMS fit residuals were all 1.2″, with a mean of 0.48″. The positional errors include the error in RA and Dec from WAVDETECT, of order 0.25″for a typical source, with a 0.5″astrometric error added in quadrature.
Hardness ratios for each source are defined as , where and are the counts in the 2 - 8 keV and 0.5 - 2 keV bands, respectively. Background subtracted hard and soft band counts were obtained through aperature photometry in the WAVDETECT source regions. The detected sources are listed in Table 1, and shown in Fig. 1.
2.1 Optical counterparts
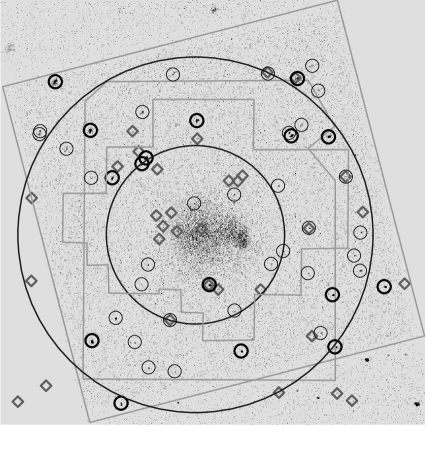
As illustrated in Figure 1, there is a wealth of optical observations of MS1054-03, none of which completely match the ACIS-S3 field of view (FOV). Deep HST mosaics made with the Wide-field Planetary Camera 2 (WFPC2) in the F606W and F814W filters cover a central area of , corresponding to a radius of 1 Mpc from the cluster center at the cluster redshift (van Dokkum et al. 2000). Spectroscopy of selected objects has been obtained with the Keck telescope over an area of yielding redshifts for over 200 objects in the field, 130 of which are confirmed cluster members (van Dokkum et al. 2000).
Where coverage allowed, optical counterparts for X-ray sources were identified from the Keck data and the HST mosaic. Each identification was examined by eye, and the largest observed offset was 1.35 arcsec. All 15 X-ray sources in the HST FOV were identified. 19 out of 31 sources in the Keck FOV were identified, of which 7 were in the HST FOV. In all, optical counterparts were found for 27 of the 47 X-ray sources. Restframe U - B colors are available for only 11 sources within the HST FOV (cf. van Dokkum et al. 2000); none of these lie within 0.2 mags of the cluster sequence. However, as the HST data covers only the inner regions of the cluster, available optical color data can give no indication of the likely cluster membership of sources further from the cluster center (see §3.2, §4.4).
Spectroscopic redshifts were available for just 7 of the X-ray sources, of which two were found to be at the cluster redshift. CXOU105702.7-033943 (source 19) is a visually confirmed match to KECK ID 564. It has extended morphology, is on the cluster sequence, and is also detected in the radio (see §4.3). It has a rest frame erg s-1, and a hardness ratio of 0.08 which corresponds to an obscuring column of a few times atoms cm-3 for a typical powerlaw spectrum with energy index, , of 0.7 to 1. CXOU105710.6-033500 (source 7) is consistent with being a match to KECK ID 2152, which is brighter and bluer than the cluster sequence. It has a rest frame erg s-1, and a hardness ratio of -0.79, suggesting a somewhat softer spectrum with for an unobscured powerlaw.
3 Source counts
We are interested in how many more of the detected X-ray sources in the MS 1054 field may be associated with the cluster. In the absence of complete spectroscopic identifications, we begin by looking for an excess over the source counts expected in a cluster-free field.
3.1 Determining the source counts
Determination of the survey area available to this observation at a given flux is complicated by variation of the effective exposure over the field due to instrumental effects, and by the diffuse emission from the hot cluster gas. We account for these effects by calculating a flux limit map, which indicates the flux of the faintest source which would have been included in our source list at each position on the chip. The sky area available at a given flux limit is then the summed value of all pixels with lower values.
We have chosen to limit our catalog in terms of the WAVDETECT source significance parameter, , defined as
where are the net source counts and are the background counts within the source region (Chandra X-ray Center, 2002).
The detected source counts are related to the incident source flux, (erg cm-2 s-1), the effective exposure area, EA (cm2), and the exposure time, (s), by
where K is a conversion factor from ergs to counts assuming an powerlaw spectrum.
The background counts in the source region depend on the local background level, , as well as the on size of the source, , which for point sources mainly reflects the off-axis degradation of the Chandra PSF. We treat the diffuse cluster emission as local background.
Therefore the flux limit, , for inclusion in our source list is
In practice, maps of the same size and resolution as the data were made for quantities , , and , allowing calculation of for each pixel. The derivation of the exposure map is discussed in the previous section.
To produce a map of the true background plus the diffuse cluster emission, we first subtracted all identified point sources using the CIAO tool dmcalc. We filled the resulting “holes” with pixel values sampled from the Poisson distribution whose mean and standard deviation equalled that of the surrounding background pixels with dmfilth. This source-free image was then smoothed with a 30″ Gaussian kernal using csmooth. Our background estimate was compared to the output background image from WAVDETECT to ensure no significant error was introduced by the inclusion of low significance “sources” in our map which are excluded during the wavelet detection process. The WAVDETECT background image was not used directly due to minor artifacts left from the iterative subtraction of bright sources.
In theory, the size of a detected point source should equal the size of the Chandra PSF, which depends largely on source angular distance from the optical axis, and also to some extent on source energy. The Chandra PSF library contains radially averaged encircled energy curves for several off-axis angles at a number of calibration energies, and these data were interpolated to create a map of PSF size over the extent of the S3 chip. We used the calibration data at 1.49 keV, as this was the value chosen for the WAVDETECT input parameter eenergy which specifies the PSF curves used in the detection algorithm. Comparing the source sizes reported by WAVDETECT for detected sources with those predicted by our source size map, we noted the WAVDETECT values were significantly higher at low off-axis angles. This appears to be due to a trend toward higher values of the WAVDETECT source extent parameter, PSFRATIO, near the optical axis, and not to an inconsistency in the expected PSF size (WAVDETECT PSF_SIZE ). Since our estimation of the limiting flux hinges on whether the source would have been detected by the wavelet detection algorithm, we have empirically fit the dependence of WAVDETECT source size on off-axis angle and included this in our source size map.
3.2 The source excess
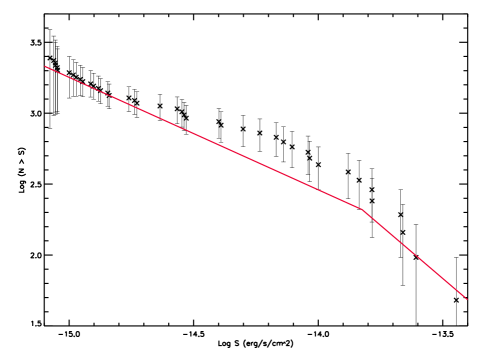
Figure 2 shows the resulting number counts for the MS 1054 field. We have overplotted the best fit to number counts from the ELAIS Deep X-ray Survey (EXDS) presented in Manners et al. (2002). We choose the EXDS number counts computed in the 0.5 - 8 keV band for ease of comparison. Comparisons of the EXDS counts in soft and hard bands show them to be fully consistent with counts derived from other Chandra deep surveys, notably that of Mushotsky et al. (2000) obtained with the S3 chip. A clear excess of sources is seen at moderate fluxes in the MS1054-03 field, reaching 50% at erg cm-2 s-1, which corresponds to a source luminosity of erg s-1 at the redshift of the cluster. Sources with fluxes in the range contributing to this excess are highlighted in Figure 1, where they are seen to avoid the cluster center.
We have repeated the analysis with sources detected independently in the soft and hard bands. Consistent with earlier papers (Cappi et al. 2001, Pentericci et al. 2002), we detect an excess of comparable significance in the soft band sources but no significant excess of hard sources.
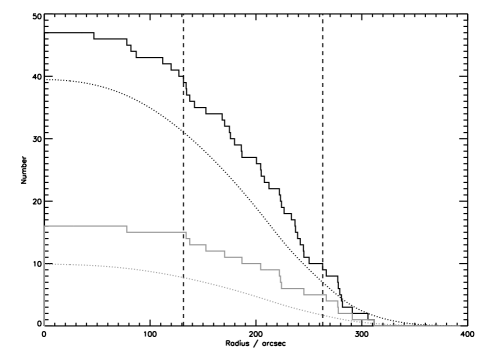
To investigate where in the field these excess sources are, we compare radial source histograms for the data and a simulated field with the same spatially-dependent sensitivity. The latter was made by converting the flux limit map described above to an “expected source” map, using the EXDS number counts to obtain the fractional expected source count per pixel at each limiting flux. Cumulative radial source counts for our data and for the cluster-free field are compared in Figure 3 from a distance of 400″ to the cluster center. We show both the sources detected to the survey limit (upper, dark line), and those contributing to the excess at fluxes above erg s-1 cm-2 (lower, light line). The 47 sources detected at all fluxes compare with 40 sources expected over the same area for a cluster-free observation. As sources 105715.7-033502 and 105715.7-033506 may constitute a single object (see footnote to Table 1), we reliably detect 6 sources more than we would expect in a blank field. This is only a 1 excess overall, and is fully consistent with observed levels of cosmic variance in Chandra deep survey fields (Manners et al. 2002). At fluxes higher than erg s-1 cm-2, however, we expect only 10 sources, and detect 16, which corresponds to an excess of . It is clear from Figure 3 that this excess arises in the outer regions of the cluster between 1 and 2 Mpc. The two confirmed X-ray detected cluster AGN, one brighter and one fainter than the erg s-1 limit, are found 134″ and 222″ from the cluster center, corresponding to distances of 1.0 and 1.7 Mpc.
4 Discussion
4.1 Cosmic variance
While the probability of randomly observing as many excess sources as are seen in this field over the entire flux range is 0.19, the result at brighter fluxes has a probability of only 0.05. As noted by Cappi et al. (2001), the magnitude of the excess – 50% at erg s-1 cm-2 – is higher than the 20%-30% variation seen in deep field surveys due to cosmic variance. Furthermore, the fact that this magnitude of excess sources has been detected in all but one of the seven Chandra pointed observations of clusters argues strongly against explanation by cosmic variance.
4.2 Gravitational lensing
As noted in Cappi et al. (2001), gravitational lensing of background sources by the cluster is also not a viable explanation for the observed effect. An intervening lens produces two effects which alter the apparent source counts in opposite senses. The apparent luminosity of sources is boosted by the lens, but the sky area in the lensed regions is decreased. Whether an increase or a deficit of sources is observed depends critically on the slope of the number counts being lensed. If the unlensed integral source counts are described as a powerlaw
then the counts boosted by a factor will be
where is the angular distance from the lens center. For source populations with an integral slope the apparent source counts will be depleted, while those with steeper slopes will be enhanced.
The effect of lensing by clusters of galaxies on the resolved and unresolved components of the X-ray background (XRB) is discussed at length in Refregier & Loeb (1997), who predict an overall depletion of resolved sources due to the shallow slope of the XRB number counts at fluxes fainter than erg s-1. The measured slope of the full band EXDS number counts over the flux range (1.1 - 15) erg s-1cm-2 is , steepening to a Euclidean slope at brighter fluxes (Manners et al. 2002). Lensing in the MS1054-03 field should lead to a deficit rather than an excess of in the number counts at all fluxes fainter than the break.
To investigate whether this effect might be significant enough to significantly deplete the source counts in the inner regions of the cluster, we model the cluster as a single isothermal sphere (SIS) with a central density profile . While clearly a gross approximation to the complex mass structure observed in MS1054-03, the SIS profile provides a simple estimate of the magnitude of the lensing effect. For a SIS lensing potential, the lensing factor, , can be expressed as
where is the Einstein radius. Following Blandford & Narayan (1992), is given in terms of the angular diameter distances between the source and the lens, , and between the source and the observer, :
where is the velocity dispersion of the lens, in units of 300 km s-1.
The velocity dispersion of MS1054-03 has been measured dynamically (Tran et al. 1999; km s-1) and estimated through weak lensing analysis (Hoekstra et al. 2000; km s-1). We adopt a value of 1200 km s-1.
The effect of lensing on the measured source counts is less than 5% beyond 1Mpc and less than 10% beyond 0.5 Mpc. As we expect detection of only a few sources interior to 0.5 Mpc in a blank field (see Figure 3), the lensing deficit is effectively negligible at all radii.
4.3 Radio overlap
Best et al. (2002) conducted extremely deep radio observations of MS1054-03 at 5 GHz with a full-width-half-power primary antenna beam diameter of . They detected 34 sources to a 6 level of 32 Jy, compared with 25 expected from a blank field. The excess radio source counts are all found within 1 Mpc of the cluster center, and 8 sources are spectroscopically confirmed cluster members. Of the cluster radio sources, seven appear to be powered by AGN. On the basis of radio flux density to optical emission line flux ratio, Best et al. (2002) report six cluster AGN and one ambiguous source with a ratio between that expected for AGN and that expected for star-forming galaxies. The ambiguous source is detected in the X-ray image with a erg s-1, however, which confirms it is an AGN. Four of these host galaxies are in merging systems, suggesting the activity may be induced by interactions.
Six sources are detected in both radio and X-ray, only one of which is at the cluster redshift. The single cluster AGN detected in both the X-ray and the radio is CXOU105702.7-033943 (source 19; Best et al. source 14). As stated earlier, the optical counterpart has galactic morphology and colors on the cluster sequence and the X-ray hardness ratio is consistent with a typical AGN powerlaw spectrum with moderate ( atoms cm-3) intrinsic absorption. The radio and X-ray luminosities are in good agreement with the Elvis et al. mean SED for radio-loud AGN (see below, and Figure 4).
The fraction of X-ray sources detected in the radio – 6 out of 47 – is consistent with the observation that 10% of all AGN are radio-loud (e.g. Sramek & Weedman 1980). If this fraction holds within the cluster, we would expect no more than one of the two confirmed or six suspected X-ray AGN to be radio-loud. Referencing the mean SED of Elvis et al. (1994), the expected radio flux for a radio-quiet QSO with erg s-1 cm-2 is an order of magnitude lower than the radio detection limit. The detection of just one of the X-ray AGN in MS1054-03 at radio wavelengths is therefore consistent with expectation.

The small fraction of radio sources detected in the X-ray – 6 out of 34 – is perhaps more surprising. While many of the field radio sources are likely to be starburst galaxies which we would not expect to detect in X-ray observations at this depth, at least 7 of the sources are radio-loud cluster AGN which should emit strongly in the X-ray. However, since the radio to X-ray flux ratio in AGN is seen to vary by several orders of magnitude (Brinkmann et al. 2000, Bauer et al. 2002), it is difficult to estimate the expected X-ray luminosity of the radio AGN. In figure 4 we plot the radio flux of the seven cluster radio AGN versus the expected X-ray flux calculated from the Elvis et al. (1994) mean radio-loud QSO SED. Following the Elvis et al. SED, all seven sources could have been detected in our X-ray observation. Though scatter around the mean might account for the non-detection of the fainter radio sources, the brightest sources have predicted X-ray fluxes which are 1 to 2.5 orders of magnitude brighter than the flux limit.
Dense absorbing columns could provide a possible explanation. Obscuration of 12 – 70% of the 0.5 - 8 keV X-ray flux expected from the faintest four radio detections would be sufficient to put them below the X-ray detection limit. This level of absorption would result from relatively modest columns of atoms cm-3 up to a few times atoms cm-3. For the brightest three radio sources, 95% to 99% of the expected X-ray flux would need to be absorbed to push them below the detection limit. Absorbing columns of atoms cm-3, as are found to be relatively common in Seyfert 2s (e.g. Maoilino et al. 1998), would be needed for these three objects.
It is possible the Elvis et al. mean SED, derived from a sample of 18 luminous X-ray selected radio-loud QSOs, is not representative of the weaker radio AGN populating MS1054-03. Sambruna & Eracleous (1999) include weaker radio galaxies in their X-ray survey which, in the unified model, contain substantial absorption along the line of sight and may more closely resemble the sources in our cluster. The dotted line in Figure 4 shows their empirical relation of lobe 5 GHz luminosity to hard X-ray flux, assuming that lobe emission dominates the radio flux, and extrapolating hand band X-ray flux to full band flux using an unobscured powerlaw spectrum with an energy index, . The resulting expected X-ray fluxes are likely too high, as non-negligible radio flux may arise from the compact core and obscuring material having little effect on the hard band flux may significantly absorb flux at lower energies. However, even these optimistically high fluxes suggest that all seven radio AGN in MS1054-03 may be too faint to be observed in the X-ray.
A third possibility is that the radio luminosities may be contaminated by a stellar component. The low optical emission line flux to radio flux density values, as well as the red optical colours of the radio sources which are consistent with the cluster sequence, argue against a post-starburst origin. However, we cannot entirely rule out some amount of the radio emission arising from stellar activity rather than AGN activity, and this could help to explain the X-ray non-detections.
If the stellar contamination to the radio fluxes is low, and if the usual radio-loud to radio-quiet ratio holds throughout the cluster, the radio-detected AGN may trace a larger AGN population nearer to the the cluster core. For the 7 detected radio-loud AGN, one would expect radio-quiet counterparts. Like the radio-loud but X-ray quiet sources, these would need to be either heavily obscured or simply much less luminous than the detected X-ray sources to avoid detection in the current data. While a vast increase in the fraction of heavily obscured objects in the inner regions of the cluster seems improbable, a population of less luminous AGN, such as those observed in clusters at low redshift, cannot be ruled out. Alternatively, the radio-loud to radio quiet fraction within the core of MS1054 may be elevated due to a dependence on AGN luminosity and/or environment.
4.4 Radial distributions
The X-ray detected AGN are not distributed randomly within the cluster but tend to populate the outer 1-2 Mpc, suggesting they may just be falling into the cluster. Similarly, Martini et al. (2002) note that while the galaxies hosting the cluster AGN in A2104 have colors on the cluster sequence, their velocity dispersion is larger than the mean cluster dispersion, perhaps suggesting recent infall. If galaxies hosting luminous cluster AGN are found to be recent arrivals to the dense cluster environment, it may indicate the AGN activity is induced by infall. It is an open debate whether introduction into a cluster environment serves purely to quench star formation activity in infalling field galaxies, or results in an initial enhancement in activity before quenching begins (cf. Poggianti 2002, and references therein). The post-starburst ‘k+a’ galaxies seen in abundance in distant clusters (Dressler et al. 1999) may be evidence of the latter scenario, if it is found that starburst activity in the field is not sufficient to account for them. If the conditions prompting starbursts in infalling members also serve to fuel AGN, the detection of an excess of AGN at the edges of dynamically active clusters may be expected, and could be a discriminator between the two scenarios described above.
Finally, it is worth emphasizing in this context that the AGN identified by radio observations are found somewhat nearer to the cluster center ( Mpc). If they are the radio-loud members of a population of weaker AGN which are below the X-ray flux limit, they may indicate a decrease of AGN activity in host galaxies which have been longer resident in the dense cluster environment.
5 Conclusions
We have detected an excess of point sources in the field of the rich cluster MS1054-03 at . The excess is most significant at fluxes brighter than S erg s-1 cm-2 (corresponding to a rest frame erg s-1 for cluster members) and arises in the outer parts of the cluster field, at angular separations consistent with radial distances of 1 - 2 Mpc from the cluster center. The observed source counts cannot be accounted for by cosmic variance, and gravitational lensing of background counts by the cluster is expected to be negligible across the field. We conclude the most likely explanation of the excess counts are a number of luminous (L erg s-1) AGN associated with the cluster. The X-ray excess arises between 1 and 2 Mpc from the cluster center, exterior to the excess of radio sources identified by Best et al. (2002). Follow-up observations will be necessary to completely identify the X-ray detections in this field, but the association of two luminous AGN with the cluster is already confirmed from existing observations. CXOU105710.6-033500 (source 7) is 1.7 Mpc from the cluster center with a luminosity of erg s-1, and CXOU105702.7-033943 (source 19) is 1.0 Mpc from the cluster center with a luminosity of erg s-1. Including the further 6 radio AGN detected at 5 GHz by Best et al. (2002), there are at least 8 luminous active nuclei associated with MS1054-03.
This study augments earlier results, confirming that luminous AGN can and do reside in rich cluster environments. The luminosities of erg s-1 we observe at suggest this population is similar to that seen in 3C295 and RXJ0030 at (Cappi et al. 2001). Fainter populations such as the LLAGN seen in nearby clusters and the starburst population seen in A1995 at may also be present in higher redshift clusters such as MS1054-03. The radio AGN detected by Best et al. (2002) but not detected in the X-ray may be evidence of just such a weaker population in MS1054-03. However, there is no low redshift equivalent to the population of luminous sources which are apparently common in high redshift clusters like MS1054-03. As not all clusters exhibit a population of point sources, the extent and strength of AGN activity within a cluster is likely dependent on both redshift and dynamical state. Further study will be directed to examining these relations. Finally, the fact that the luminous X-ray sources in MS1054-03 are observed only at the edges of the cluster is suggestive of infall induced activity, the quenching of which may give rise to fainter AGN at smaller cluster-centric radii. Exploring this possibility is another motivation for further complete surveys of AGN in distant clusters.
Acknowledgments
We thank Pieter van Dokkum for his generous help with this work, and the referee for helpful comments. OJ thanks Ignas Snellan and Andy Lawrence for useful discussions, and the School of Physics, University of Edinburgh for partial funding. PNB and OA gratefully acknowledge the support of the Royal Society.
References
Bauer F. E., Alexander D. M., Brandt W. N., Hornschemeier A. E., Vignali C., Garmire G. P., Schneider D. P., 2002, AJ, 124, 2351
Best P. N., van Dokkum P. G., Franx M., Rottgering H. J. A., 2002, MNRAS, 330, 17
Blandford R. D. & Narayan R., 1992, ARA&A, 30, 311
Brinkmann W. et al., 2000, A&A, 356, 445
Cappi M. et al., 2001, ApJ, 548, 624
Chandra X-ray Center, 2002, The CIAO Detect Manual (CIAO Software Release V2.2.1), (Cambridge: Chandra X-Ray Center)
Dressler A., Thompson I. B. Shectman S. A., 1985, ApJ, 288, 481
Dressler A., Smail I., Poggianti B. M., Butcher H., Couch W. J., Ellis R. S., Oemler A., 1999, ApJS, 122, 51
Franx M. et al., in preparation
Freeman P. E., Kashyap V., Rosner R., Lamb D. Q., 2002, ApJ, 138, 185
Gioia I. M., Maccacaro T., Schild R. E., Wolter A., Stocke J. T., Morris S. L., Henry J. P., 1990, ApJS, 72, 567
Henry J. P. & Briel U. G., 1991, A&A, 246, L14
Hoekstra H., Franx M., Kuijken K., 2000, 532, 88
Jeltema T. E., Canizares C. R., Bautz M. W., Malm M. R., 2001, ApJ, 562, 124
Lazzati D., Campana S., Rosati P., Chincarini G., Giacconi R., 1998, A&A, 331, 41
Manners J. et al., 2002, MNRAS, in press
Martini P., Kelson D., Mulchaey J. S., Trager S. C., 2002, ApJ, 576, L109
Molnar S. M., Hughes J. P., Donahue M., Joy M., 2002, ApJ, 573, L91
Mushotsky R. F, Cowie L. L, Barger A. J., Arnaud K. A, 2000, Nature, 404, 459
Pentericci L., Kurk J. D., Carilli C. L., Harris D. E., Miley G. K., Rottgering H. J. A., 2002, A&A, in press (astro-ph 0209392)
Poggianti B. in ”Galaxy Evolution in Groups and Clusters”, 2002, eds. Lobo, Serote-Roos and Biviano, Kluwer, in press (astro-ph 0210233)
Refregier A. and Loeb A., 1997, ApJ, 478, 476
Sun M., Murray S. S., 2002, ApJ, 577, 139
Tozzi P. et al., 2001, ApJ, 562, 42
Tran K. H., Kelson D. D., van Dokkum P., Franx M., Illingworth G. D., Magee D., 1999, ApJ, 522, 39
van Dokkum P. G., Franx M., Fabricant D., Illingworth G. D., Kelson, D., 2000, ApJ, 541, 95